Open Journal of Composite Materials
Vol. 3 No. 3 (2013) , Article ID: 34468 , 12 pages DOI:10.4236/ojcm.2013.33007
Thermal Diffusivity and Thermal Conductivity of Epoxy-Based Nanocomposites by the Laser Flash and Differential Scanning Calorimetry Techniques
![]()
1Materials Science and Engineering Program, Binghamton University, Binghamton, USA; 2Department of Chemistry, Binghamton University, Binghamton, USA.
Email: *wjones@binghamton.edu
Copyright © 2013 Jasper Chiguma et al. This is an open access article distributed under the Creative Commons Attribution License, which permits unrestricted use, distribution, and reproduction in any medium, provided the original work is properly cited.
Received March 29th, 2013; revised April 29th, 2013; accepted May 29th, 2013
Keywords: Nanocomposites; Thermal Diffusivity; Thermal Conductivity; Heat Capacity; Laser Flash; Differential Scanning Calorimetry
ABSTRACT
Nanocomposites were fabricated by using a commercial two part epoxy as a matrix and multiwalled carbon nanotubes, graphite fibers and boron nitride platelets as filler materials. Multiwalled carbon nanotubes (MWCNTs) that were produced by chemical vapor deposition were found to produce nanocomposites with better thermal diffusivity and thermal conductivity than the MWCNTs that were produced by the combustion method. Compared to the MWCNTs produced by both methods and graphite fibers, boron nitride produced nanocomposites with the highest thermal conductivity. Specific heat capacity was measured by using differential scanning calorimetry and thermal diffusivity was measured by using the laser flash.
1. Introduction
One of the major challenges that are encountered in the packaging of semiconductor electronic devices is the progressive increase in the power level of operating devices. Balancing the reduction of semiconductor device feature sizes with reliable operation continues to be a challenge. The effective transfer of heat from an intergrated circuit and its heat spreader to a heat sink is a vital step in solving the challenge. Thermal management within the area of the chip calls for addressing thermal impedance in the following areas: junction-to-case, case-to-heat sink and heat sink-to-ambient [1].
Nanocomposites with superior thermal transport properties have great application potential in microelectronics as thermal interface materials (TIMs). A polymer matrix and a thermally conducting organic or inorganic filler with nanoscale dimensions are the two components that constitute a nanocomposite that is suitable for thermal interface applications. Some organic fillers that have been used as fillers are carbon nanotubes, graphite fibers and more recently graphene. Usually, materials such as Al2O3, AlN and BN are used as inorganic fillers [2,3].
Epoxy resins are among some of the polymer materials that are resistant to adverse conditions and are characterized by good stiffness, strength, stability and chemical resistance and adhere well to embedded fillers [4]. As a result, they have been used in a lot of electronics such as resistors, inductors, capacitors, lasers, low loss dielectric and waveguide where toughness and resistance to high temperatures are required. With the increase in demand for affordable interfacial materials that are capable of dissipating heat effectively in electronic systems, nanomaterials like carbon nanotubes have been incorporated in epoxies and other suitable polymers such as polyimides to form nanocomposites [5]. The choice of polymer matrix is greatly influenced by the anticipated area of application. For instance, high temperature applications in spaceships would require the use of polyimides and epoxies [6].
The filler materials are selected based on their properties which they are expected to impart on the polymer matrix. Besides carbon nanotubes, other materials that have been used as fillers include nanotubes and nanoparticles of metal as well graphite fibers among others [7].
Melt mixing, solution casting and in-situ polymerizetion are the three predominant ways of preparing nanocomposites[8]. Solution casting is mostly used because it does not require any specialized equipment to melt polymers some of which melt at very high temperatures. A major issue associated with the fabrication of nanocomposites is the dispersion of nanofillers in the polymer matrix [9,10]. While they have high thermal conductivity, estimated at 6000 Wm−1∙K−1 and carrier mobility estimated to be 105 cm2∙V−1∙s−1, carbon nanotubes have high interfacial energy as a result of their high aspect ratio which causes them to agglomerate and as a result make it difficult to disperse them in solvents [11]. Bath sonication, tip sonication, functionalization and use of surfactants are some of the methods that are currently being used to disperse carbon nanotubes in order to overcome the problem of agglomeration [12]. With the dispersion of carbon nanotubes it is anticipated that a continuous percolation pathway through which current can flow is formed.
A percolation network or continuous path from one end of a material to the other is formed when the number of nanotubes per unit volume of polymer exceeds a certain threshold value [13]. However, too much dispersion has the disadvantage of having isolated carbon nanotube strands insulated with the polymer matrix resulting in higher resistance. It has also been found that at higher concentrations of carbon nanotubes, the aggregated sample tend to conduct better [14]. Ideally, electrical percolation at the smallest possible loading of carbon nanotubes is desired, yet this can be made non-desirable by polymer encapsulation. Despite all these challenges, due to the many envisioned applications of carbon nanotubepolymer nanocomposites, researchers in many branches of materials science continue to find ways to enhance their mechanical, electrical and electronic properties.
Table 1 shows the materials that were used as fillers in the preparation of epoxy nanocomposites. All these materials were obtained courtesy of Nanodynamics Inc.
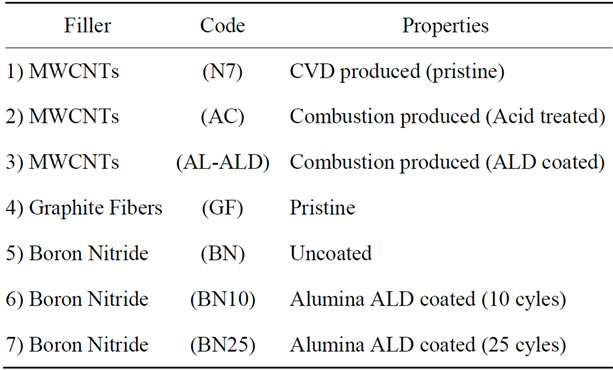
Table 1. Fillers for nanocomposites.
Buffalo. Except for the CVD produced MWCNTs, all the carbon nanotubes were products of Nanodynamics which were produced by the combustion of ethylene in air with the use of a nickel catalyst.
There are four major methods that have been used to measure thermal conductivity, namely the Hot wire method, Laser Flash, Thermal conductivity from the Dynamic Response of the DSC and the Scanning Thermal Microscopy [15-19]. In this work we make use of the flash method. In the thermal flash method, the front face of a small wall-shaped sample receives a pulse of radiant energy coming from a laser or a flash lamp. Figure 1 illustrates how the thermal diffusivity value is computed from the resulting temperature response on the opposite (rear) face of the sample. The speed with which
 (1)
(1)
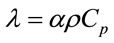
heat propagates through a material is known as thermal diffusivity. It is related to thermal conductivity by equation 1, where, λ is thermal conductivity in Wm−1∙K−1, α is thermal diffusivity in m2∙s−1, ρ is density in kg∙m−3 and Cp is specific heat capacity in J∙kg−1∙K−1.
Thermal conductivity is the time rate of steady heat flow through unit thickness of an infinite slab of homogeneous material in a direction perpendicular to the surface, induced by unit temperature difference. It is the property that determines the working temperature levels of a material. The amount of heat required to raise the temperature of a given substance or material by 1˚C or 1 K, is the heat capacity of the material. Specific heat capacity is a thermodynamic quantity that determines the amount of heat necessary to raise by one degree the temperature of a unit mass of material [20].
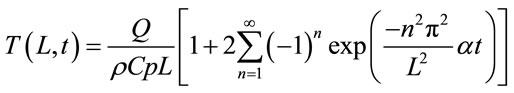
In order to calculate the thermal conductivity, α has to be determined as well as the Cp. Equation (2) represents the Fourier series solution that represents the temperature rise of the backside of the sample.
 (2)
(2)
Q, ρ, Cp and L are the energy of the laser pulse per unit area, density of the sample, specific heat capacity of the sample and thickness of the sample respectively. In order
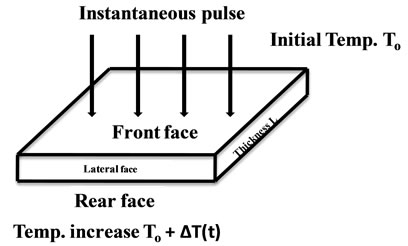
Figure 1. Schematic of the flash method.
to normalize Equation (2) in terms of the maximum backside temperature (Tmax(L)), Equations (3) and (4) have been defined.
 (3)
(3)
 (4)
(4)
Equations (3) and (4) lead to the Fourier series Equation (5)
 (5)
(5)
when V(L,t) is 0.5, that is 50% of the peak value, ω is equal to 1.388 and the expression of α will be Equation (6).
 (6)
(6)
In Equation (6), t1/2 is the time required for the backside temperature to reach half of the maximum temperature rise. This is the equation that is used to calculate thermal diffusivity by measuring t1/2 when the dimensionless temperature V(L,t) is equal to 0.5. Figure 2 shows the relationship between V(L,t) and ω [21].
The specific heat capacity, Cp, is related to the amount of heat, the substance in question and temperature by the Equation (7):
 (7)
(7)
where Q is the amount heat, m is the mass of substance and ∆T is the change in temperature. The thermal analysis tool that is used to determine specific heat capacity is the DSC. It measures the temperature and heat flow associated with important transitions in materials as a function of time and temperature. Glass transition temperature, melting point, latent heat of melting, latent heat of crystallization, endothermic and exothermic natures of transition, degree of crystallinity, phase changes are other measurements that can be obtained by DSC besides
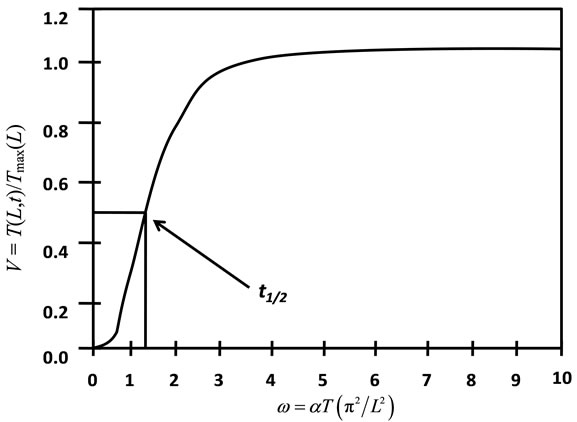
Figure 2. Relation between V(L,t) and ω.
specific heat capacity [22].
While the method is based on an ideal method which assumes that the sample is homogeneous and isotropic, and the thermophysical properties and the density are uniform, constant and invariant with temperature within the experimental conditions, among other assumptions, this is not always the case with composites. The extension of the flash method to composites assumes that the sample thickness is much larger than the fiber diameter, the fiber volume fraction is as large as possible, and the matrix is in perfect thermal contact, that is, the interfacial conductance is large [23,24].
Given the nanoscale diameter of our nanotubes and the microscale dimensions of the carbon fibers and thegraphite fibers we have the confidence that our composites meet the requirements for thermal diffusivity measurements using the flash method.
2. Experimental
A commercial epoxy resin (Epon Resin 815C) and a curing agent (Epikure 3140 Curing Agent) were obtained from Miller Stephenson Chemicals Co. Inc. and Methyl Ethyl Ketone (MEK) was obtained from Aldrich Chemicals Company. All chemical were used as received. MWCNTs in 5 ml of MEK were bath sonicated for 1hr to achieve dispersion followed by the addition of 2 g of Epon Resin 815C and further sonication for 30 minutes to achieve mixing. The suspensions were then poured into Teflon mold cups and left overnight to evaporate the solvent. This was followed by the addition of 2 g of the Epikure 3140 Curing Agent. After thorough mixing, the nanocomposites were degassed under vacuum for an hour and then left to cure at room temperature for 72 hours. Samples of dimensions 12.7 mm × 12.7 mm × 0.134 mm were cut using a diamond saw and polished to achieve smooth surfaces. Thermal diffusivity data were collected using a FlashLineTM2000 Thermal Properties Analyzer from Anter Corporation. This instrument has the following attributes: lower cost-bench-top system, xenon flash, operating temperature from RT to 330˚C, loading capacity of four specimen (30 mm diameter), specific heat capacity determination, thermal conductivity measurement, ASTM E-1461. Samples for thermal diffusivity measurements were coated with a thin layer of graphite to increase emissivity and eliminate transparency. The volumes of the samples were determined from the length, width and thickness of the samples. The densities of the samples were then calculated from their mass and volume.
The specific heat capacity of each sample was determined using a Differential Scanning Calorimeter (DSC). The heating procedure involved a number of steps. Firstly, heating was done in the absence of a reference pan and a sample pan in order to achieve baseline correction. The pans are made of sapphire. Secondly, heating was done in the presence of empty reference and sample pans to measure background heat flow. Thirdly, the calibration constant k was calculated. Lastly, each weighed sample was run through the calorimeter to determine the heat flow at room temperature and calculate the corresponding Cp. The DSC used nitrogen as a purge gas and the mass flow set at 50 ml/min for the sample purge. The ramp rate was 3.000˚C/min up to 50˚C.
Using the outlined procedure, Epon Resin 815C nanocomposites were prepared with loadings of MWCNTs, Graphite fibers and Boron Nitride ranging from 0 - 0.5 wt%. In order to see whether there would be improvement in thermal properties at higher loadings, nanocomposites with MWCNTs and graphite fibers were also prepared with percent loadings of 0 - 25 wt%. In order to improve the chances of seeing the filler materials using Field Emission Scanning Electron Microscopy (FESEM) type Supra 55, the cast nanocomposites were fractured and the lateral side examined. The MWCNTs were analyzed using High Resolution Transmission Electron Microscopy (HRTEM).
3. Results and Discussion
Figure 3 shows the surface morphology of the fillers. The micrographs were obtained using FESEM and HRTEM. While the structure of the fillers can be clearly seen, it was not possible to see them in the nanocomposites. In order to increase the chances of seeing the fillers in the nanocomposites, the nanocomposites were fractured. Figure 4 shows FESEM images of the fractured surfaces. Table 2 shows the diffusivity data that were collected for the epoxy nanocomposites at each percentage loading. The tabulated thermal diffusivity data at each percentage loading were obtained by averaging three thermal diffusivity readings that corresponded to three half-times and three laser shots. The laser flash gives thermal diffusivity data output that corresponds to different models that have been used to calculate thermal diffusivity. Among these models are those by Parker, Koski, Heckman, Cowan and Cowan and Taylor. The diffusivity data by all the models were very much in agreement. In this work, we selected the diffusivity data from the Parker model and plotted the average diffusivity from the three shots as a function of percentage loading.
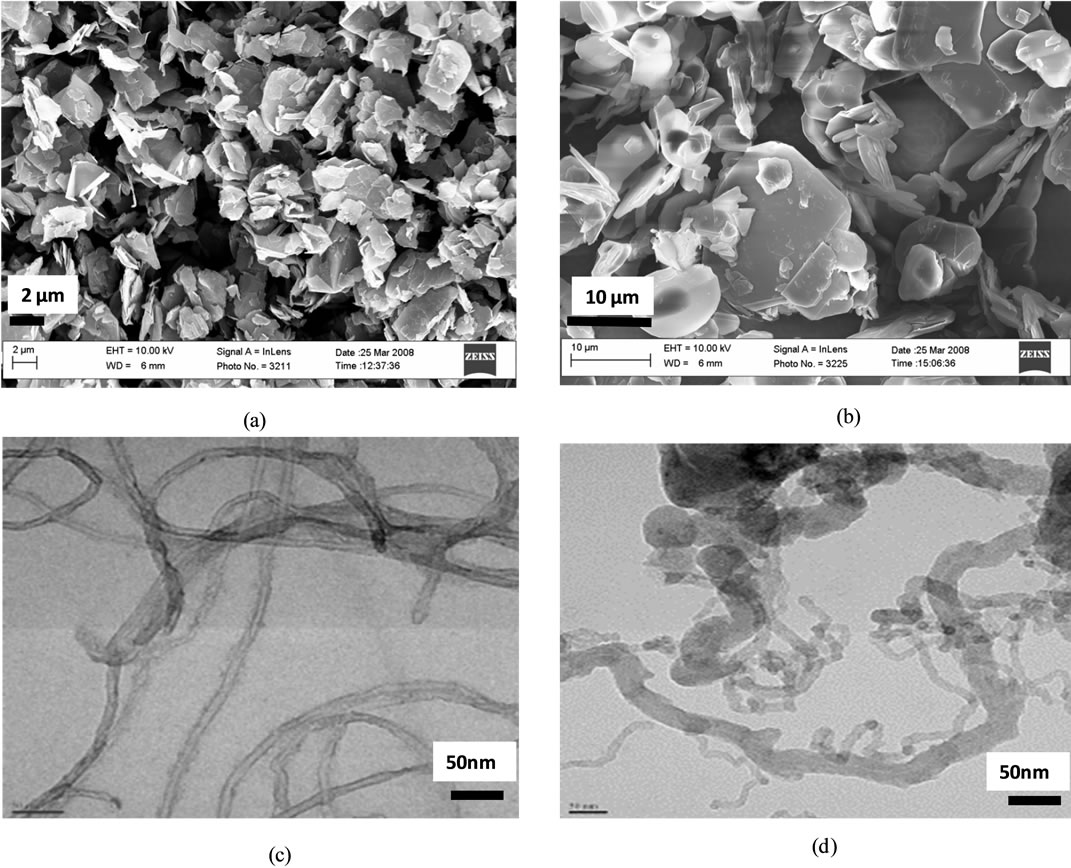
Figure 3. FESEM of (a) Graphite fibers (b) Boron Nitride Platelets (c) TEM, CVD MWCNTs (d) TEM, Acid treated MWCNTs.
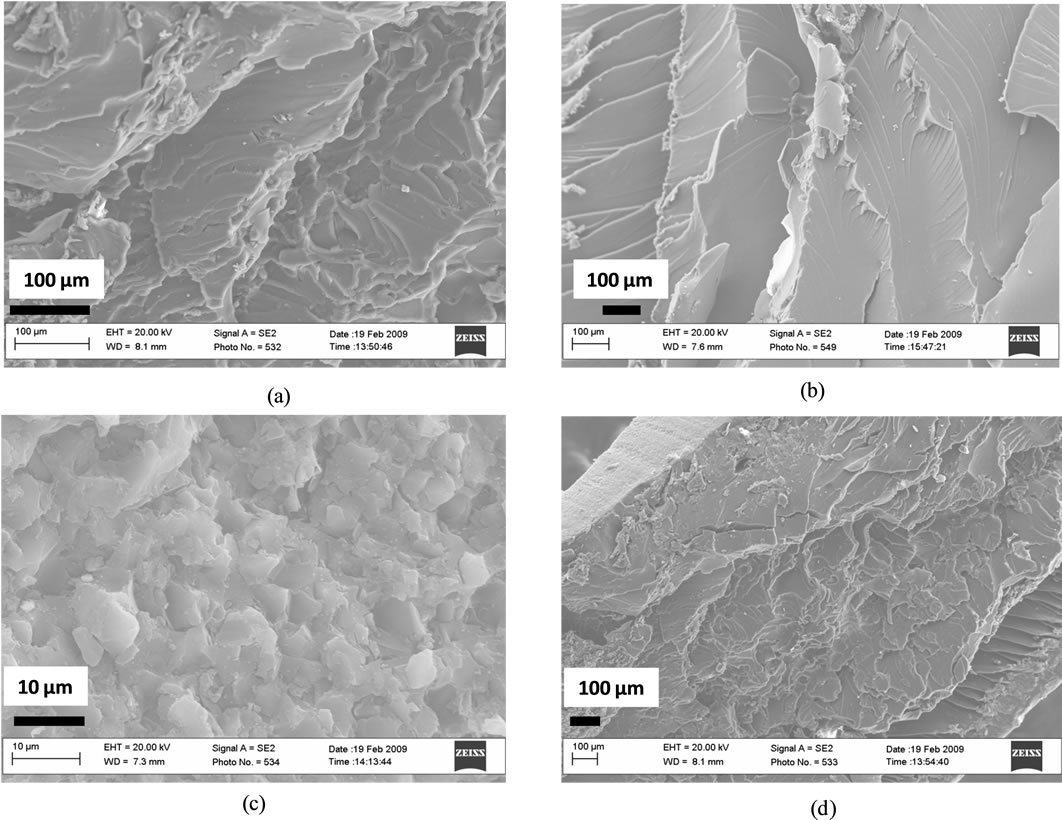
Figure 4. (a) Epoxy/MWCNTs (b) Epoxy/BN (c) Epoxy/Carbon Fibers (d) Fracture surface of nanocomposite.
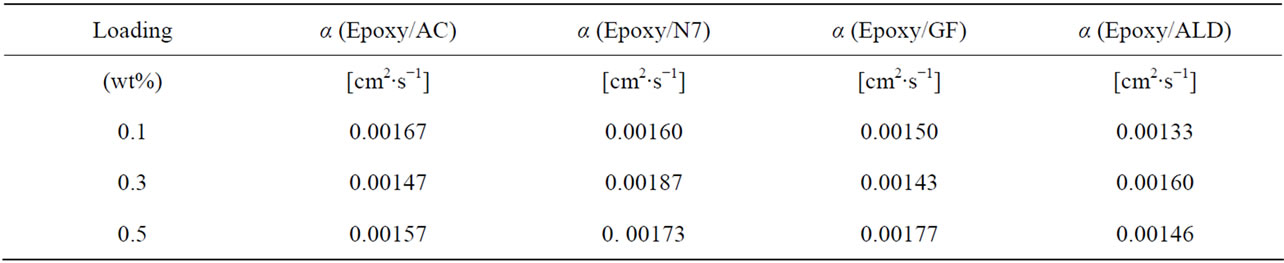
Table 2. Diffusivity data of epoxy nanocomposites at each loading.
The same procedure was followed to process the data that were collected for all the nanocomposites filled with the materials listed in Table 1. Figure 5 shows plots of the thermal diffusivities of the epoxy nanocomposites with all the carbon nanotubes as well as Graphite fibers at filler loadings of 0.1, 0.3 and 0.5 wt%. It can be seen in these plots how each filler material influences the thermal diffusivity of the epoxy matrix. In Figure 5, we see that within the same percentage loading the nanocomposite loaded with CVD produced MWCNTs achieves the highest thermal diffusivity of 1.87 × 10⁻³ cm2∙s−1 at 0.3 wt% loading before dropping slightly to 1.73 × 10⁻³ cm2∙s−1.
The nanocomposite loaded with acid treated MWCNTs achieved a maximum diffusivity of 1.67 × 10⁻³ cm2∙s−1 at 0.1 wt% loading, the highest of them all at that low loading. After that increase a continuous drop is observed. Just like the CVD produced MWCNTs filled nanocomposite, the ALD coated MWCNTs loaded nanocomposite showed a maximum in thermal diffusivity of 1.60 × 10⁻³ cm2∙s−1 at 0.3 wt%. However, the thermal diffusivity value is lower than that of the CVD produced MWCNT filled nanocomposite at 0.3 wt%. The Graphite fiber loaded nanocomposite exhibits a gradual increase in thermal diffusivity and it reaches a maximum of 1.77 × 10⁻³ cm2 × s−1 at 0.5 wt% loading. Figure 6 shows the plots of the specific heat capacities of each nanocomposite in the 18˚C - 30˚C range. The specific heat capacity in all cases increases systematically with temperature. The data were obtained from DSC measurements. Figure 7 shows the plots of the specific heat capacities at each loading at 25˚C for each nanocomposite. While the spe-
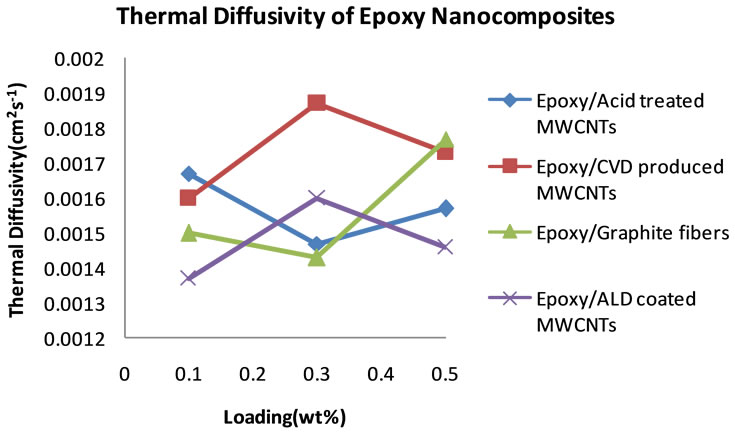
Figure 5. Plot of thermal diffusivity of epoxy nanocomposites as a function of percent loading of fillers.
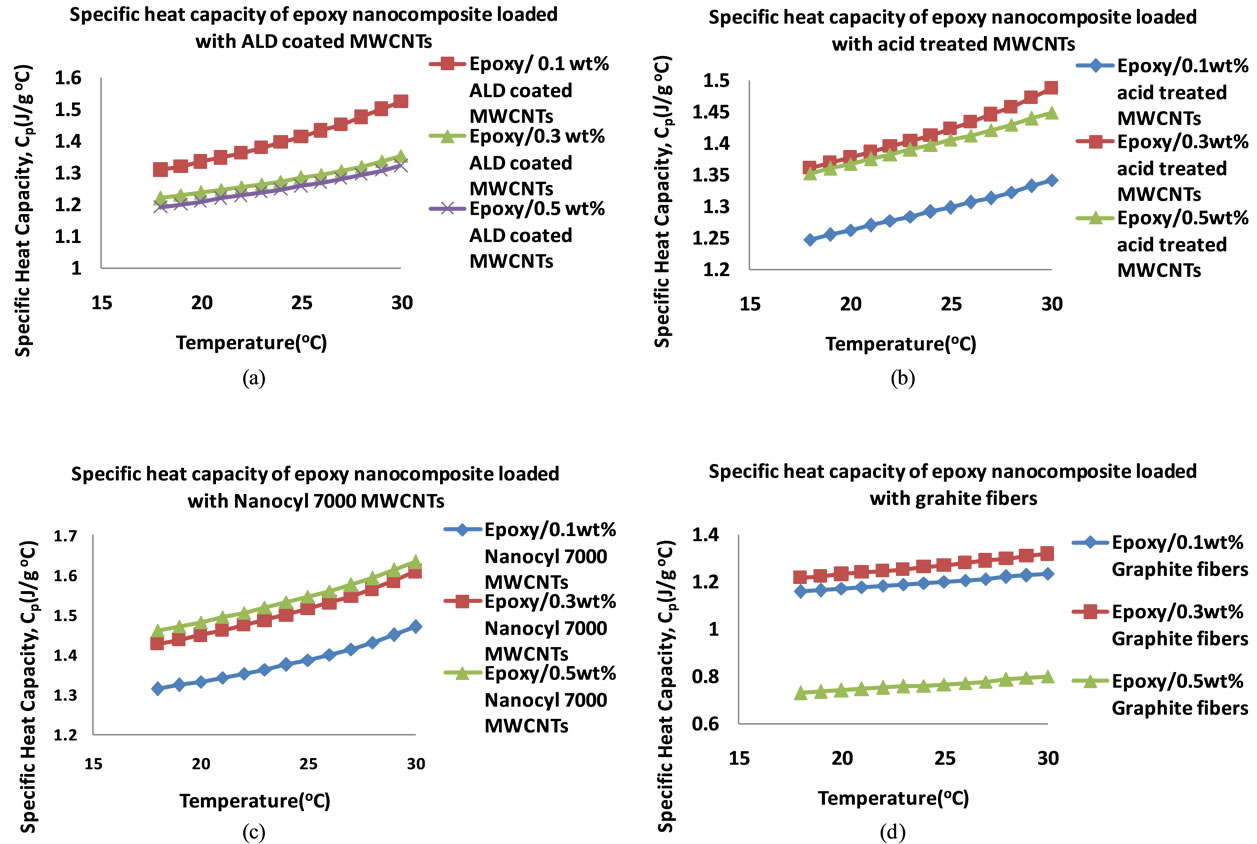
Figure 6. Plots of specific heat capacities of epoxy nanocomposites in the 18˚C - 30˚C temperature range filled with (a) ALD coated MWCNTs (b) Acid treated MWCNTs (c) CVD produced MWCNTs (d) Graphite fibers.
cific heat capacities of the other nanocomposites decreases at 0.5 wt% loading, the specific heat capacity of the CVD produced MWCNTs loaded nanocomposite continues to increase. From these specific heat capacity data, density of nanocomposite samples and their thermal diffusivity values, thermal conductivities for each sample at each loading were calculated. Table 3 shows the thermal conductivity data of the nanocomposites. Figure 8 shows the plots of the thermal conductivity data shown in Table 3. The CVD produced MWCNTs filled nanocomposite achieved the highest thermal conductivity. In order to find out what the thermal diffusivity trend would be with further filler loadings, nanocomposites were prepared with filler loadings of up to 25 wt%.
Nanocomposites were successfully prepared with all these fillers except the CVD produced MWCNTs because
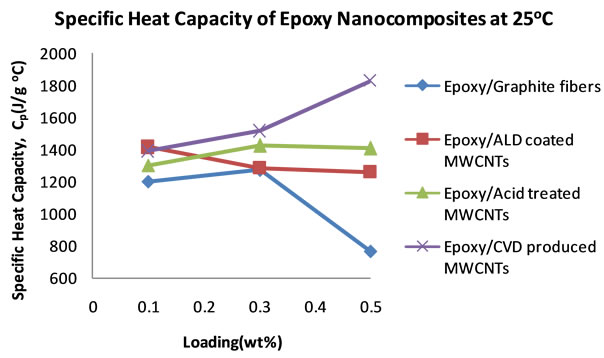
Figure 7. Plots of specific heat capacities of epoxy nanocompositesat 25˚C as the filler loading increases.
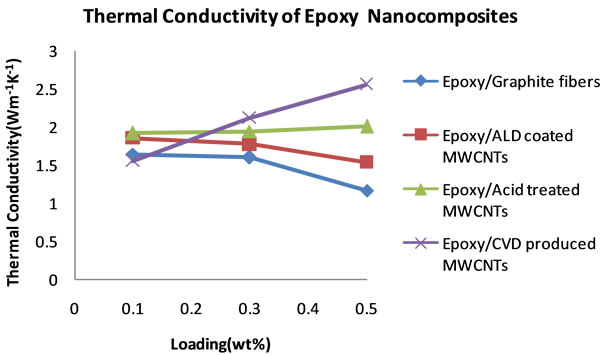
Figure 8. Plots of thermal conductivities of epoxy nanocomposites from 0.1 to 0.5 wt% loading
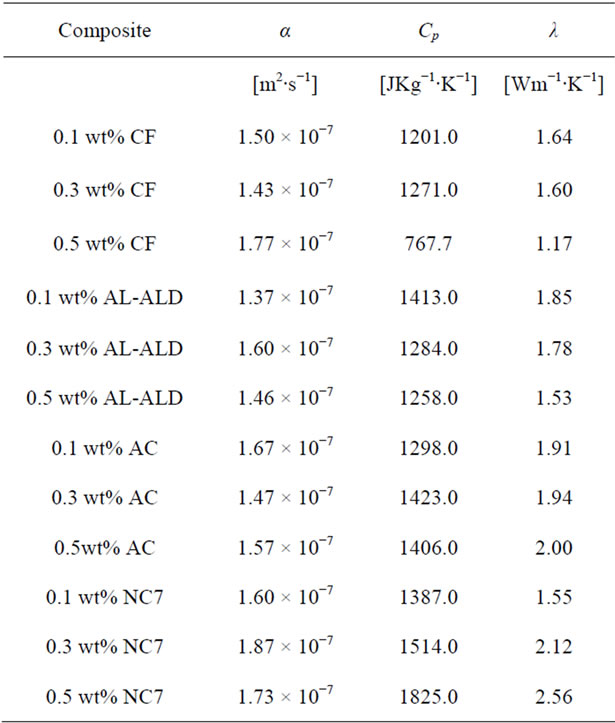
Table 3. Thermal conductivity data of epoxy nanocomposites.
no good dispersion could be achieved at higher loadings. Table 4 shows the thermal diffusivity data that were obtained at 5, 15 and 25 wt% filler loading. Figure 9 shows the plots of the thermal diffusivity data. The plotted thermal diffusivity data show that the acid treated MWCNTs and the ALD coated MWCNTs loaded nanocomposites show maximum thermal diffusivity of 1.90 × 10⁻³ cm2∙s−1 and 1.80 × 10⁻³ cm2∙s−1 respectively at 15 wt% loading. These values are slightly higher than those that were obtained at lower loadings in the 0 - 0.5 wt% range. It seems that continued addition of these MWCNTs does not significantly increase the thermal diffusivity of the epoxy nanocomposite. Graphite fibers show an interesting trend in which the thermal diffusivity of the epoxy/ graphite fiber nanocomposite continues to increase with increasing loading of graphite fibers and reaching 3.80 × 10⁻³ cm2∙s−1.
Figure 10 shows the plots of the specific heat capacities in the 18˚C - 30˚C temperature range for the nanocomposites that were loaded at 5, 15 and 25 wt%. Generally, the specific heat capacity is found to increase with increase in temperature. Figure 11 shows plots of the specific heat capacities at 25˚C. The plots show an increasing trend in the specific heat capacities of the nanocomposites for all of the nanocomposites. The graphite loaded nanocomposite shows the highest specific heat capacity of 4.20 Jg−1∙˚C−1 at 25 wt% loading.
From the thermal diffusivity data, the sample density
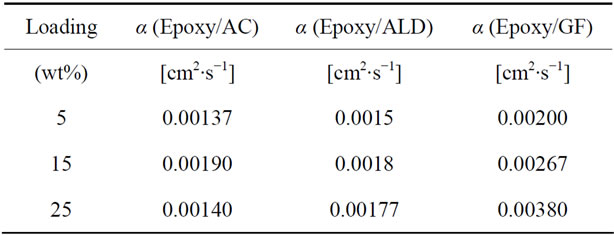
Table 4. Diffusivity data of epoxy nanocomposites at each loading.
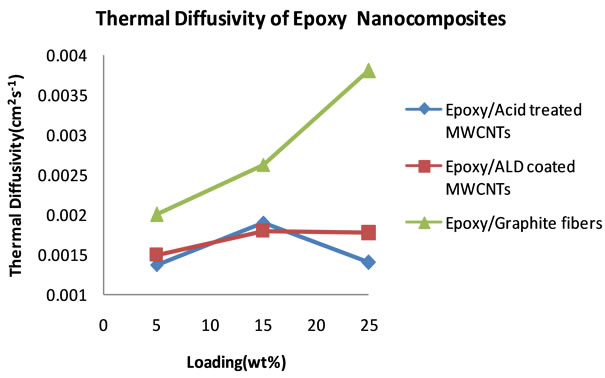
Figure 9. Plot of thermal diffusivity of epoxy nanocomposites as a function of percent loading of fillers (5 - 25 wt%).
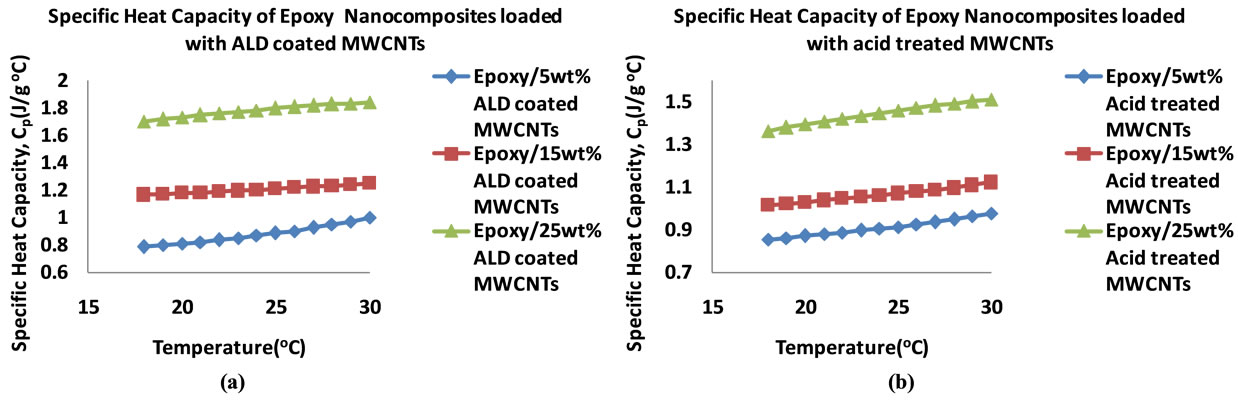
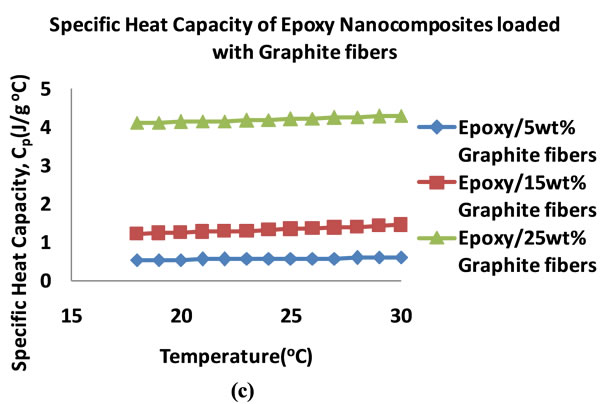
Figure 10. Plots of specific heat capacities of epoxy nanocomposites in the 18˚C - 30˚C temperature range (5 - 25 wt%) (a) ALD coated MWCNTs (b) Acid treated MWCNTs (c) Graphite fibers.
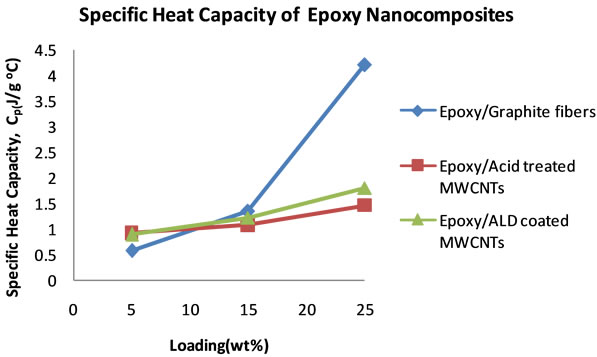
Figure 11. Plots of specific heat capacities of epoxy Nanocomposites at 25˚C as the filler loading increases.
and specific heat capacity, the thermal conductivities of the nanocomposites were calculated. Table 5 summarizes the thermal conductivity results. Figure 12 shows plots of the thermal conductivity data that are tabulated in Table 5.
The plots reveal a superior performance by the graphite fiber filled nanocomposite, with thermal conductivity that increases systematically with percent loading to 16.25 Wm−1∙K−1. Behind this nanocomposite is the nanocomposite filled with ALD alumina coated MWCNTs,
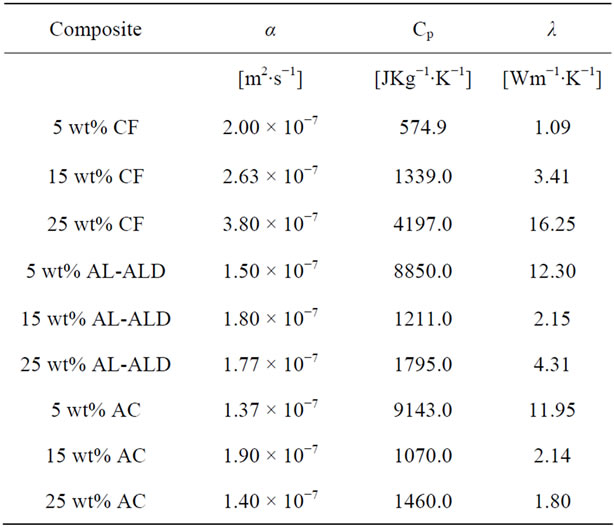
Table 5. Thermal conductivity data of epoxy nanocomposites.
reaching a thermal conductivity of 12.30 Wm−1∙K−1.
This high thermal conductivity value for alumina coated carbon nanotubes shows that the coating has the effect of increasing thermal conductivity. The plot of the nanocomposite that was filled with uncoated carbon
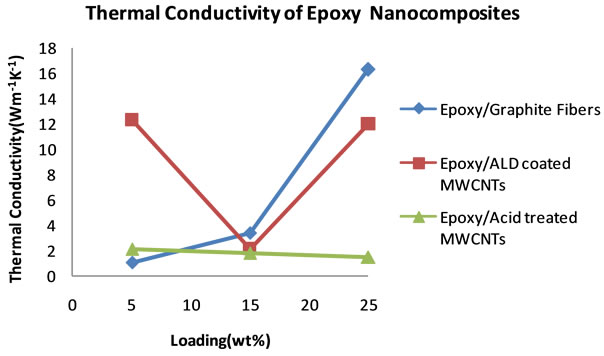
Figure 12. Plots of thermal conductivities of epoxy nanocomposites from 5 to 25 wt% loading.
nanotubes shows much lower thermal conductivity compared to graphite fibers and alumina coated filled nanocomposites.
Table 6 is a summary of the thermal diffusivity of boron nitride filled nanocomposites. Figure 13 shows the thermal diffusivity plots of boron nitride loaded epoxy nanocomposites. The three types of boron nitride have different properties due to different treatments. One set of boron nitride is uncoated (BN uncoated) and the other two samples have been coated with alumina, one for 10 cycles (BN10) and the other for 25 cycles (BN25).
It can be seen that in general, the thermal diffusivity values are several times higher than those that were obtained in nanocomposites loaded with MWCNTs and graphite fibers. When we look at the thermal diffusivity data that corresponds to the nanocomposites filled with all the three samples of Boron Nitride, we notice that at a loading of 0.1 wt% the uncoated BN filled nanocomposites performed better, followed by the 25 cycle ALD alumina coated BN filled nanocomposite and lastly the 10 cycle ALD alumina coated BN filled nanocomposite with thermal diffusivity measurements of 0.9878 cm2∙s−1, 0.9099 cm2∙s−1 and 0.8643 cm2∙s−1 respectively.
At a loading of 0.3 wt% the 10 cycle ALD alumina coated BN filled nanocomposite reaches a maximum thermal diffusivity of 1.0624 cm2∙s−1 higher than the other two and then drops. At 0.5 wt% loading the 25 cycle ALD alumina coated BN filled nanocomposite reaches the highest thermal diffusivity of 1.1121 cm2∙s−1. These thermal diffusivity values seem to highlight the superiority of Boron Nitride fillers in nanocomposites meant for thermal dissipation.
Figure 14 shows the specific heat capacities of the BN filled nanocomposites in the temperature range 18˚C - 25˚C. It can be seen that the heat capacities increase with temperature. Figure 15 shows the plots of the specific heat capacities at 25˚C for each BN nanocomposite. It can be seen that as the percentage loading increases, the specific heat capacity of the nanocomposite with BN coated
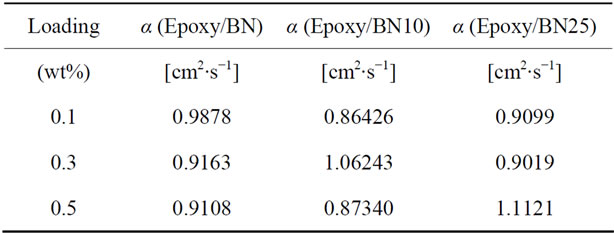
Table 6. Diffusivity data of epoxy/Boron Nitride nanocomposites at each loading.
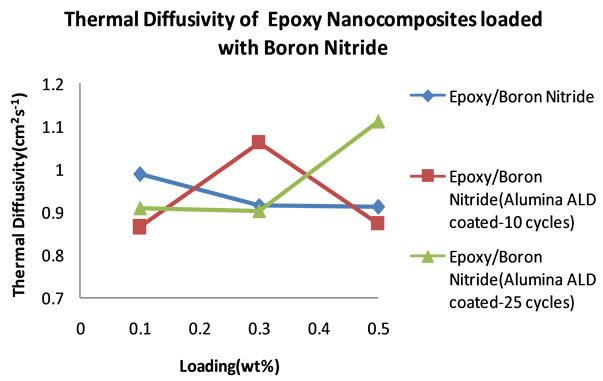
Figure 13. Plots of thermal diffusivity of BN filled epoxy nanocomposites.
with alumina 10 cycles increases more followed by the nanocomposite with BN(uncoated) filled nanocomposite. These two nanocomposites show an increase in specific heat capacity at 0.1 wt% before it decreases. In the case of the nanocomposite loaded with BN coated with alumina 25 cycles, the specific heat capacity decreases with loading to 0.3 wt% before it rises sharply to 1.419 Jg−1∙˚C−1 at 0.5 wt%. Table 7 shows the thermal conductivity of the BN filled nanocomposites at each loading. Figure 16 shows the plots of the thermal conductivity data tabulated in Table 7.
The thermal diffusivity, density and specific heat capacity were used to calculate the thermal conductivity of the nanocomposites. The plots indicate significantly high thermal conductivities for all BN nanocomposites as the loading increases irrespective of the number of cycles the BN was ALD coated with alumina. However, the nanocomposites loaded with BN that had been ALD coated with alumina for 25 cycles showed the highest thermal conductivity of 1489.01 Wm−1∙K−1 at a loading of 0.5 wt%. This high thermal conductivity value suggests that ALD coating of BN with alumina increases their thermal conductivity which ultimately increases the thermal conductivity of the nanocomposites.
There are two main reasons for coating BN particles with an ultrathin film of alumina (Al2O3). Firstly, the film results in a particle with minimized reduced thermal conductivity. Secondly, there is significant reduction in
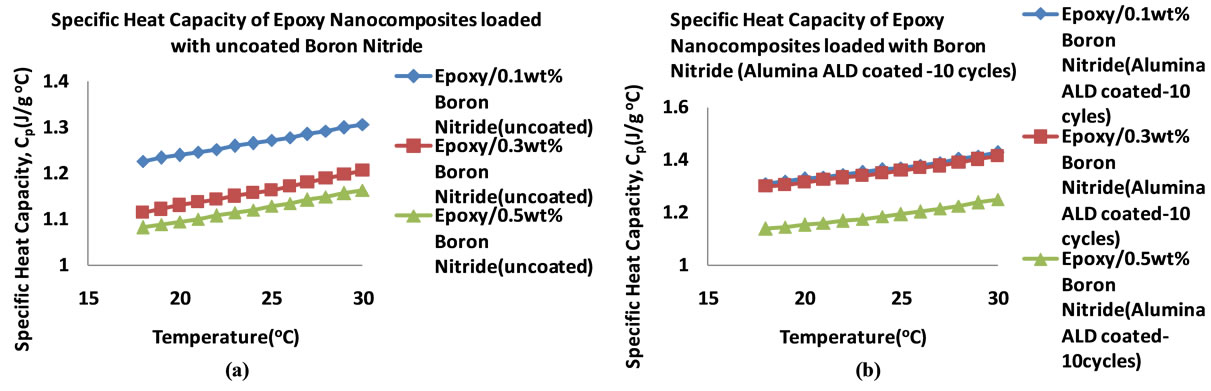
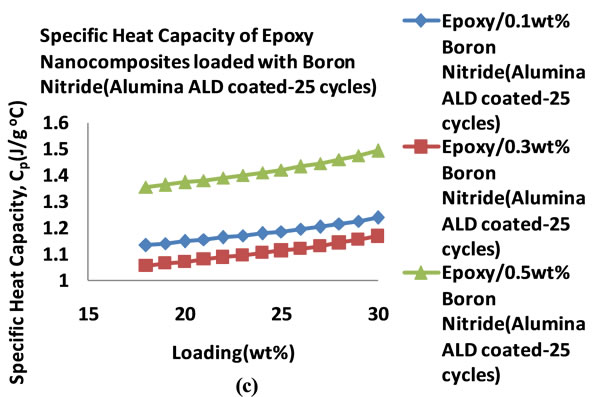
Figure 14. Plots of specific heat capacities of BN filled epoxy nanocomposites in the 18˚C - 30˚C temperature range (0.1 - 0.5 wt%) (a) BN (Uncoated) (b) BN (ALD coated 10 cycles) (c) BN (ALD coated 25 cycles).
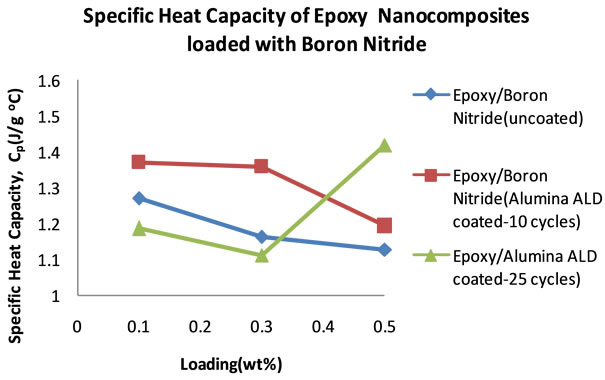
Figure 15. Plots of specific heat capacities of BN epoxy nanocomposites at 25˚C as the filler loading increases
the viscosity of the resin in which they are incorporated before curing. This coating therefore increases the surface wettability of the BN particles with the polymer matrix in use and in our case the epoxy resin. As a result, higher loadings can be achieved. ALD (Atomic Layer Deposition) is a coating method which results in films that are conformal, pinhole-free, non-granular and which can be controlled to the level of an atom. ALD splits the involved binary reaction into two self-limiting half-reactions that occur on the surface of the substrate. The ALD
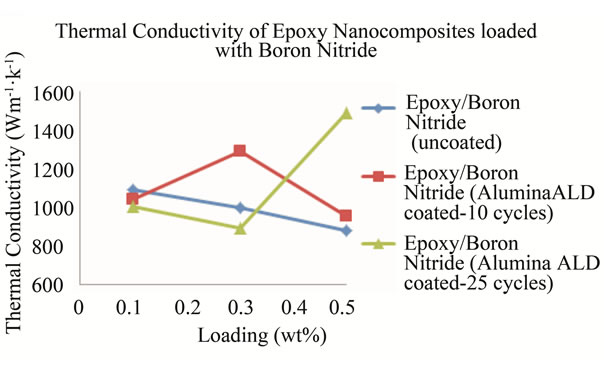
Figure 16. Plots of thermal conductivities of BN loaded epoxy nanocomposites from 0.1 to 0.5 wt% loading.
deposition of Al2O3 in the presence of trimethylaluminum (TMA) and water can be represented by Equation (8).
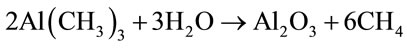 (8)
(8)
 (A)
(A)
 (B)
(B)
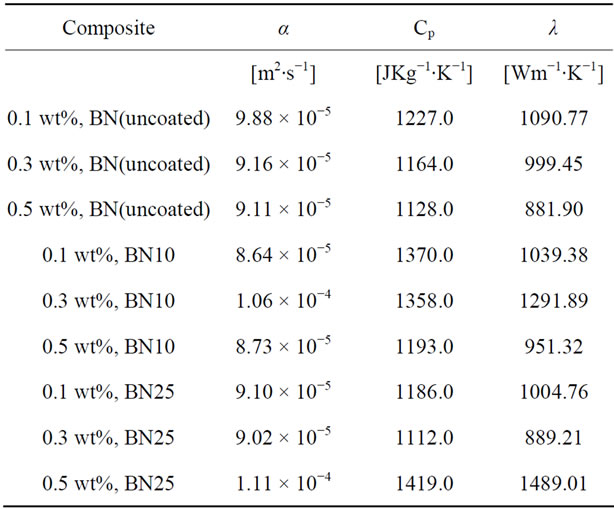
Table 7. Thermal conductivity data of epoxy nanocomposites.
The starred species in equations A and B are surface species representing film growth. Because of the limited number of surface reactive sites, the reaction continues until all the sites have been reacted and no further reaction takes place. This is why the reactions are considered self-limiting or self-terminating. It has been reported that a limit of approximately one monolayer or 1 × 10¹⁵ species/cm2 can be deposited under appropriate conditions. The growth of the Al2O3 film is characterized by the recurrence of the reactions (A) and (B) resulting in an ABAB sequence. For every AB reaction cycle, approximately 1 Å of Al2O3 film is deposited at 177˚C [25-28].
4. Conclusions
Nanocomposites were successfully fabricated by blending epoxy with MWCNTs, graphite fibers, and BN. The thermal diffusivities of the nanocomposites were successfully measured by using the Laser Flash method. The nanocomposites loaded with CVD which produced MWCNTs were found to have better thermal diffusivity and thermal conductivity than the other MWCNTs. However, the graphite filled with nanocomposites showed better thermal diffusivity and thermal conductivity than all the nanocomposites loaded with the different kinds of MWCNTs. The thermal diffusivities and thermal conductivities of BN filled with nanocomposites were several times higher than those that were obtained for graphite and MWCNTs filled with nanocomposites. The much better thermal conductivity results that were obtained with BN could be attributed to the ALD Al2O3 coating. This coating increases the surface wettability of the BN particles with the epoxy resin.
There is significant reduction in the viscosity of the resin in which they are incorporated before curing due to the wetting of the BN by the resin. A positive consequence of this increased wettability is the possibility of achieving higher loadings. The adhesion between coated particles and the resin is higher than that of uncoated BN.
REFERENCES
- K. M. Razeeb and E. Dalton, “Nanowire-Polymer Nanocomposites as Thermal Interface Material,” In: B. Reddy, Ed., Advances in Nanocomposites-Synthesis, Characterization and Industrial Applications, InTech, Winchester, 2011, pp. 685-706.
- W. L. Song, P. Wang, L. Cao, A. Anderson, M. J. Meziani, A. J. Farr and Y.-P. Sun, “Polymer/Boron Nitride Nanocomposite Materials for Superior Thermal Transport Performance,” Angewandte Chemie International Edition, Vol. 51, No. 26, 2012, pp. 6498-6501. doi:10.1002/anie.201201689
- T. Tanaka, M. Kozako and K. Okamoto, “Toward High Thermal Conductivity Nano Micro Epoxy Composites with Sufficient Endurance Voltage,” Journal of International Council on Electrical Engineering, Vol. 2, No. 1, 2012, pp. 90-98. doi:10.5370/JICEE.2012.2.1.090
- S. S. Samal, “Role of Temperature and Carbon Nanotube Reinforcement on Epoxy Based Nanocomposites,” Materials Characterization, Vol. 8, No. 1, 2009, pp. 25-36.
- H. H. So, J. W. Cho and N. G. Sahoo, “Effect of Carbon Nanotubes on Mechanical and Electrical Properties of Polyimide/Carbon Nanotubes Nanocomposites,” European Polymer Journal, Vol. 43, No. 9, 2007, pp. 3750-3756. doi:10.1016/j.eurpolymj.2007.06.025
- T. Rohr and M. V. Eesbeek, “Polymer Materials in the Space Environment,” Proceeding of the 8th Polymers for Advanced Technologies International Symposium, 13-16 September 2005, Budapest, pp. 8-10.
- W. Gacitua, A. Ballerini and J. Zhang, “Polymer Nanocomposites: Synthetic and Natural Fillers a Review,” Maderas. Ciencia y Tecnología, Vol. 7, No. 3, 2005, pp. 159-178.
- J.-H. Du, J. Bai and H.-M. Cheng, “The Present Status and Key Problems of Carbon Nanotube Based Polymer Composites,” eXPRESS Polymer Letters, Vol. 1, No. 5, 2007, pp. 253-273.
- J. Liu, T. Liu and S. Kumar, “Effect of Solvent Solubility Parameter on SWNT Dispersion in PMMA,” Polymer, Vol. 46, No. 10, 2005, pp. 3419-3424. doi:10.1016/j.polymer.2005.02.086
- W. E. Jones, J. Chiguma, E. Johnson, A. Pachamuthu and D. Santos, “Electrically and Thermally Conducting Nanocomposites for Electronic Applications,” Materials, Vol. 3, No. 2, 2010, pp. 1478-1496. doi:10.3390/ma3021478
- Y. Wang, J. Wu and F. Wei, “A Treatment Method to give Separated Multi-Walled Carbon Nanotubes with High Purity, High Crystallization and a Large Aspect Ratio,” Carbon, Vol. 41, No. 15, 2003, pp. 2939-2948. doi:10.1016/S0008-6223(03)00390-7
- H. Chen, H. Muthuraman and P. Stokes, “Dispersion of Carbon Nanotubes and Polymer Nanocomposite Fabrication Using Trifluoroacetic Acid as a Co-Solvent,” Nanotechnology, Vol. 18, No. 41, 2007, p. 415606. doi:10.1088/0957-4484/18/41/415606
- M. S. Strano, “Polymer-Wrapped Nanotubes,” Nature Materials, Vol. 5, No. 6, 2006, pp. 433-435.
- I. Alig, T. Skipa, D. Lellinger, M. Bierdel and H. Meyer, “Dynamic Percolation of Carbon Nanotube Agglomerates in a Polymer Matrix: Comparison of Different Model Approaches,” Physica Status Solidi (B), Vol. 245, No. 10, 2008, pp. 2264-2267. doi:10.1002/pssb.200879622
- H. Fukushima, L. T. Drzal, B. P. Rook and M. J. Rich, “Thermal Conductivity of Exfoliated Graphite Nanocomposites,” Journal of Thermal Analysis, Vol. 85, No. 1, 2006, pp. 235-238. doi:10.1007/s10973-005-7344-x
- W. Nunes, P. Mummery and A. Wallwork, “Thermal Diffusivity of Polymers by the Laser Flash Technique,” Polymer Testing, Vol. 24, No. 5, 2005, pp. 628-634. doi:10.1016/j.polymertesting.2005.03.007
- M. Merzlyakov and C. Schick, “Thermal Conductivity from Dynamic Response of DSC,” Thermochimica Acta, Vol. 377, No. 1-2, 2001, pp. 183-191. doi:10.1016/S0040-6031(01)00553-6
- C. Blanco, S. P. Appleyard and B. Rand, “Study of Carbon Fibres and Carbon-Carbon Composites by Scanning Thermal Microscopy,” Journal of Microscopy, Vol. 205, Pt. 1, 2002, pp. 21-32. doi:10.1046/j.0022-2720.2001.00974.x
- F. Ochanda and W. E. Jones, “Fabrication and Thermal Analysis of Submicron Silver Tubes Prepared from Electrospun Fiber Templates,” Langmuir, Vol. 23, No. 2, 2007, pp. 795-801. doi:10.1021/la061385n
- P. S. Gaal, M. Thermitus and D. E. Stroe, “Thermal Conductivity Measurements Using the Flash Method,” Journal of Thermal Analysis and Calorimetry, Vol. 78, No. 1, 2004, pp. 185-189. doi:10.1023/B:JTAN.0000042166.64587.33
- C. Chiu, J. G. Maveety and Q. A. Tran, “Characterization of Solder Interfaces Using Laser Flash Metrology,” Microelectronics Reliability, Vol. 42, No. 1, 2002, pp. 93-100. doi:10.1016/S0026-2714(01)00129-9
- R. L. Danley, “New Heat Flux DSC Measurement Technique,” Thermochimica Acta, Vol. 395, No. 1-2, 2003, pp. 201-208.
- V. Buryachenko, A. Roy, K. Lafdi, K. Anderson and S. Chellapilla, “Multi-Scale Mechanics of Nanocomposites Including Interface: Experimental and Numerical Investigation,” Composites Science and Technology, Vol. 65, No. 15-16, 2005, pp. 2435-2465. doi:10.1016/j.compscitech.2005.08.005
- J. N. Coleman, U. Khan, W. J. Blau and Y. K. Gun, “Small but Strong: A Review of the Mechanical Properties of Carbon Nanotube-Polymer Composites,” Carbon, Vol. 44, No. 9, 2006, pp. 1624-1652. doi:10.1016/j.carbon.2006.02.038
- A. C. Dillon, A. W. Ott, J. D. Way and S. M. George, “Surface Chemistry of Al2O3, Deposition Using Al(CH3)3 and H2O in a Binary Reaction Sequence,” Surface Science, Vol. 322, No. 1-3, 1995, pp. 230-242. doi:10.1016/0039-6028(95)90033-0
- A. W. Ott, J. W. Klaus, J. M. Johnson and S. M. George, “Al2O3 Thin Film Growth on Si(100) Using Binary Reaction Sequence Chemistry,” Thin Solid Films, Vol. 292, No. 1-2, 1997, pp. 135-144. doi:10.1016/S0040-6090(96)08934-1
- A. W. Ott, K. C. McCarley, J. W. Klaus, J. D. Way and S. M. George, “Atomic Layer Controlled Deposition of Al2O3 Films Using Binary Reaction Sequence Chemistry,” Applied Surface Science, Vol. 107, 1996, pp. 128-136. doi:10.1016/S0169-4332(96)00503-X
- J. R. Wank, S. M. George and A. W. Weimer, “Nanocoating individual cohesive boron nitride particles in a Fluidized Bed by ALD,” Powder Technology, Vol. 142, No. 1, 2004, pp. 59-69. doi:10.1016/j.powtec.2004.03.010
NOTES
*Corresponding author.