Open Journal of Soil Science
Vol.05 No.03(2015), Article ID:54829,17 pages
10.4236/ojss.2015.53008
Switchgrass Management Practice Effects on Near-Surface Soil Properties in West-Central Arkansas
Alayna Jacobs1, Kristofor R. Brye1, Randy King2, Joel Douglas3, Lisa S. Wood1, Larry C. Purcell1, Michael Looper4
1Department of Crop, Soil, and Environmental Sciences, University of Arkansas, Fayetteville, USA
2USDA-NRCS Plant Materials Center, Booneville, USA
3USDA-NRCS Central National Technology Support Center, Fort Worth, USA
4Department of Animal Science, University of Arkansas, Fayetteville, USA
Email: kbrye@uark.edu
Copyright © 2015 by authors and Scientific Research Publishing Inc.
This work is licensed under the Creative Commons Attribution International License (CC BY).
http://creativecommons.org/licenses/by/4.0/


Received 17 February 2015; accepted 12 March 2015; published 19 March 2015
ABSTRACT
Agronomic management practices that maximize monoculture switchgrass (Panicum virgatum L.) yield are generally well understood; however, little is known about corresponding effects of differing switchgrass management practices on near-surface soil properties and processes. The objective of the study was to evaluate the effects of cultivar (“Alamo” and “Cave-in-Rock”), harvest frequency (1- and 2-cuts per year), fertilizer source (poultry litter and commercial fertilizer), and irrigation management (irrigated and non-irrigated) on near-surface soil properties and surface infiltration in a Leadvale silt loam (fine-silty, siliceous, semiactive, thermic, Typic Fragiudult) after four years (2008 through 2011) of consistent management in west-central Arkansas. Irrigating switchgrass increased (P < 0.01) soil bulk density in treatment combinations where poultry litter was applied (1.40 g∙cm−3) compared to non-irrigated treatment combinations (1.33 g∙cm−3). Root density was greater (P = 0.031) in irrigated (2.62 kg∙cm−3) than in non-irrigated (1.65 kg∙cm−3) treatments when averaged over all other treatment factors. The total infiltration rate under unsaturated conditions was greater (P = 0.01) in the 1-cut (33 mm∙min−1) than 2-cut (23 mm∙min−1) harvest treatment combinations when averaged over all other treatment factors, while the total infiltration rate under saturated conditions did not differ among treatment combinations (P > 0.05) and averaged 0.79 mm∙min−1. Results from this study indicate that management decisions to maximize switchgrass biomass production affect soil properties over relatively short periods of time, and further research is needed to develop local best management practices to maximize yield while maintaining or improving soil quality.
Keywords:
Soil Bulk Density, Infiltration, Extractable Soil Nutrients

1. Introduction
The United States (US) is the largest consumer of petroleum in the world at an estimated 18.6 million barrels per day [1] . Even though the US is also the third largest producer of petroleum, domestic production cannot keep pace with demand, as 40% of petroleum products consumed in the US are net imports from other countries [1] . Burning fossil fuels also releases carbon dioxide (CO2). Promoting the generation and development of domestic fuel supplies, while reducing CO2 emissions from fossil fuel combustion, has become a central issue in global policy.
Concerns related to the effects of global warming and possible shortages of finite fossil fuel sources have led to government-mandated regulations encouraging the development of alternative fuels. According to the Energy Policy Act of 2005 and the Renewable Fuel Standard Program of 2007, 36 billion gallons of renewable fuel must be blended into the nation’s transportation fuel supply by 2022 [2] . However, only 12% of electricity generated in the US is currently generated from renewable sources, such as wind, hydroelectric, and biomass [3] .
One potential solution is the conversion of plant biomass to fuel. Using plant biomass as a source of cellulosic biofuel as an alternative to fossil fuel is attractive because plants use sunlight for energy and capture existing CO2 from the atmosphere. Though bioenergy derived from lignocellulosic sources may not provide a complete alternative to the massive energy needs of the US, lignocellulosic bioenergy sources may alleviate a portion of the negative impacts of burning fossil fuels and contribute to an extended supply of fossil fuels for the future [4] .
Plant biomass can be utilized as a fuel in two major ways: by burning or mixing biomass with coal (i.e., co- firing) to generate electricity [5] or conversion of biomass to ethanol. Co-firing is desirable because it reduces the amount of coal burned while maintaining a high level of energy output. Mixing renewable fuels with a non- renewable fuel like coal may also extend the supply of finite resources further into the future. One advantage of using plant biomass rather than corn (Zea mays L.) grain to produce ethanol is the avoidance of sacrificing food for fuel production. Corn is an important food crop for human and livestock consumption. Corn makes up over 95% of the grain rations for cattle, and the US is the world’s largest producer of beef [6] . Use of a non-food cellulosic material for conversion to ethanol offers an attractive solution to the problem of competing with the livestock feed industry.
Corn is also an annual crop that must be replanted every year and requires large amounts of fertilizer. The extensive preparation required for conventional corn production is regarded as causing more total soil erosion than any other crop grown in the US [7] . Dedicated energy crops, or crops grown exclusively for conversion to renewable fuel sources, have emerged as potential sources of cellulose. These crops include short-rotation woody crops, such as willow (Salix spp.) and cottonwood (Populus spp.), annual crop residue from small-grain crops and biomass sorghum (Sorghum bicolor [L.] Moench), and perennial grass crops. Ideal energy crops from woody and herbaceous sources have low fertilizer requirements, are relatively cheap and easy to establish, have a perennial growth habit, are easily integrated with existing US farming practices, and are adaptable to sites unsuitable for food or cash crop production.
Switchgrass (Panicum virgatum L.) was recognized by the US Department of Energy in the 1990s as part of the Bioenergy Feedstock Development Program for its ability to produce large quantities of biomass on relatively poor sites. Annual yields of switchgrass in the US average 11.2 Mg∙ha−1, ranging from 4.5 Mg∙ha−1 in the northern plains to 23.0 Mg∙ha−1 in Alabama [8] . Switchgrass is native to all of the US, except in California and the Pacific Northwest, and is adapted to a wide range of soil textures and soil drainage classes [9] . Another desirable aspect of switchgrass production is that the agricultural community is already familiar with perennial grass production, harvesting strategies, and harvesting equipment [8] . In order for producers to commit to growing dedicated energy crops for renewable fuel markets, detailed information about storage, handling, pricing, timing, and transport must be available [10] . Since most of that information does not exist for the majority of US producers, having the option of growing switchgrass as both a source of livestock forage or renewable fuel feedstock may provide added stability for long-term value to producers.
The western portion of Arkansas is largely unsuitable for traditional row-crop production due to steep topography and thin soil compared to the delta region of the Lower Mississippi River basin of eastern Arkansas. However, the average biomass yield for switchgrass grown in Booneville, Arkansas under a single annual harvest regime was 13.4 Mg∙ha−1 over a four-year period, which was above the national average yield of 11.2 Mg∙ha−1 estimated by McLaughlin and Kszos [8] . When using the ALMANAC yield prediction computer model, McLaughlin et al. [11] recognized the southeast and south-central US regions as being more suitable than the upper mid-western region for providing dependable future feedstock supplies of switchgrass biomass.
In addition to the projected increase in yield, western Arkansas is widely known for its forage and hay production and for its role in the beef cattle industry. Agricultural operators in western Arkansas are familiar with grass harvest, distribution, and storage and typically own conventional farm equipment that can be used to harvest switchgrass. The cost of producing one dry ton of switchgrass in Arkansas was estimated to be $26.73 in the third year of production, with an expected useful life of 12 years before having to replant [10] . Furthermore, Arkansas is the only US state to be ranked in the top 10 of broiler chicken (Gallus gallusdomesticus), turkey (Meleagris gallopavo), and egg production [12] . As a by-product of poultry production, poultry litter has been widely considered the most valuable manure produced by livestock due to its plant nutrient and organic matter content [13] . Consequently, many producers use dry, surface-applied poultry litter to fertilize hay and forage production pastures.
Past research has identified agronomic procedures for maximizing switchgrass biomass production using varying systems, including cultivar choice, fertilizer application, irrigation, harvest frequency, and row spacing [14] - [17] . Thorough evaluations of the implications associated with switchgrass production systems are needed to seriously determine if switchgrass provides a truly renewable and clean source of domestic energy. Therefore, the objective of this study was to evaluate the effects of switchgrass cultivar (i.e., “Alamo” and “Cave-in-Rock”), water management (i.e., irrigation and no irrigation), fertilizer source (i.e., commercial or poultry litter fertilization), and harvest regime (i.e., once- or twice-harvested per year) after four years of consistent management on near-surface soil properties (i.e., bulk density, soil aggregation, soil pH and electrical conductivity, extractable soil nutrients, and root density) and surface infiltration in west-central Arkansas.
Since “Alamo” previously produced greater biomass yields in all treatment combinations [15] , it was hypothesized that “Alamo” treatment combinations would have lower soil bulk density, greater root density, and greater surface infiltration rate than “Cave-in-Rock” combinations. Treatment combinations fertilized with poultry litter rather than commercial fertilizer were expected to have lower soil bulk density and greater surface infiltration rates as the addition of the organic material associated with the poultry litter would increase porosity. Irrigation was expected to decrease near-surface, mobile soil nutrient levels due to increased water available for leaching. Harvesting twice per year was expected to result in a lower root density, greater bulk density, and lower surface infiltration rates than harvesting once per year. Lastly, it was expected that the greatest-yielding treatment combinations would contain the lowest soil nutrient contents since a greater proportion of plant nutrients would have been removed from the soil in aboveground biomass production.
2. Materials and Methods
2.1. Site Description
The US Department of Agriculture’s Natural Resource Conservation Service’s Plant Materials Center (PMC) was established in Booneville, AR in 1987 and serves the plant material needs of the Southern Ozarks, Arkansas River Valley, Boston, and Ouachita Mountains (Major Land Resource Areas [MLRAs] 116A, 118A, 117, and 119, respectively). The PMC is located along the Petit Jean River in Logan County, AR at an elevation of 146 m [18] and lies along the north edge of the Ouachita National Forest in the eastern portion of the Arkansas Valley and Ridges (MLRA 118A). The 30-yr mean annual precipitation throughout the region is 127 cm and precipitation is delivered more or less evenly throughout the winter (23%), summer (21%), spring (29%), and autumn (27%) seasons [19] . The 30-yr mean annual air temperature for the region is 15.6˚C, with a winter minimum of 10.5˚C and a summer maximum of 32.4˚C [19] .
The study site at the PMC (Figure 1) was located on a Leadvale silt loam (fine-silty, siliceous, semiactive, thermic Typic Fragiudult) [20] . A fragipan is located at a depth of between 30 and 60 cm from the surface such that the Leadvale soil is poorly drained in late winter and early spring due to the presence of a perched water table. The fragipan also causes plants to experience drought stress during the summer by limiting plant rooting

Figure 1. The field study was conducted at the United States Department of Agriculture’s Natural Resource Conservation Service’s Plant Materials Center (PMC) near Booneville, AR (*).
depth. The study site was a pasture dominated by tall fescue (Schedonorus arundinaceus [Schreb] Dumort., nom. Cons.) prior to being prepared for a yield study in 2006 [15] . No fertilizer was applied and the vegetation was kept mowed to a height of approximately 15 cm year-round. Based on soil sampling, soil nutrient levels were brought up to uniform, medium production values prior to planting according to recommended values for phosphorus (P) and potassium (K) for native warm-season grass establishment.
2.2. Initial Switchgrass Field and Treatment Establishment
“Alamo” and “Cave-in-Rock” switchgrass cultivars were planted in 12.2 by 12.2 m plots on 5 March 2007. Each plot contained one switchgrass cultivar and fertilizer source. Plots were seeded at a rate of 4.4 kg∙ha−1 pure live seed (457 seed∙m−2) and planted with a no-tillage native grass drill (Sukup 2050 series, Jonesboro, AR). After drilling, the seedbed was rolled with a water-filled roller to establish good seed-to-soil contact. Temporary sprinkler irrigation was applied to all plots for initial seed emergence and establishment. A permanent sprinkler irrigation system was installed in replicated irrigation treatments in summer 2007. Each 12.2 by 12.2 m plot was divided in half, with one subplot harvested once per year and the other subplot harvested twice per year. There were a total of 48 plots encompassing three replications of each cultivar-irrigation-fertilizer source-harvest frequency treatment combination.
Rain gauges were placed in the irrigated plots to calibrate the irrigation delivery system. Irrigated plots received 2.54 cm of irrigation water from a nearby surface pond per week during June through August from 2008 to 2011. The average annual precipitation at the study site was 131 cm [18] , which was slightly greater than the 30-yr average of 121 cm for the region [19] . Annual rainfall represented 127% in 2008, 124% in 2009, 70% in 2010, and 110% in 2011 of the 30-yr average rainfall [18] [19] . Average annual air temperature represented 90% in 2008, 89% in 2009, 93% in 2010, and 99% in 2011 of the 30-yr average [18] [19] .
The study site was burned each year in early March to remove residue stubble, stimulate switchgrass seed production for wildlife, remove surface residue for native pollinator nesting habitat, and to create corridors for other ground-nesting wildlife species [21] . Fertilizer treatments were applied when green foliage appeared in early April each year (i.e., 2008 to 2011). Poultry litter (PL) was applied at a rate of 4.5 Mg∙ha−1, while commercial fertilizer (CF) was applied to match nitrogen (N), P, and K levels in the applied PL. Litter batches were analyzed annually for nutrient concentrations prior to application.
Two harvest frequencies were imposed to test their effects on annual aboveground biomass production. A single harvest was made in November after the first killing frost for the 1-cut system. In the 2-cut system, harvests occurred twice per year. The first harvest occurred in June just prior to the boot stage when the seed head emerges and the second harvest occurred after a killing frost in November. Additional switchgrass harvesting details and results of the initial yield study were reported in Jacobs and King [15] .
2.3. Soil, Plant, and Infiltration Measurements
In July 2012, soil samples were collected in all plots from the 0- to 10- and 10- to 20-cm depth intervals for bulk density, extractable soil nutrients, and soil particle-size analyses. In the top 10 cm, bulk density samples were collected manually with a 5-cm outside diameter, stainless steel core chamber and a slide hammer. For the 10- to 20-cm depth, bulk density samples were collected with a 5-cm diameter, stainless steel mechanical hydraulic probe. Samples from both depths were dried in a forced-air dryer at 70˚C for 48 hours, and then weighed for bulk density determinations. Soil from the bulk density samples was sieved through a 2-mm mesh screen and used to measure particle-size distribution using a modified 12-hour hydrometer method [22] . Mehlich-3 extractable soil nutrients (i.e., P, K, Ca, Mg, S, Na, Fe, Mn, Zn, and Cu) were determined in a 1:2 soil-water extract [23] [24] . Soil pH and electrical conductivity (EC) potentiometrically in a 1:2 soil-water paste.
In August 2013, soil samples were collected from the 0- to 5- and 5- to 10-cm depths using a 4.8-cm diameter core chamber and slide hammer to measure aggregate stability (AS) (i.e., water-stable aggregates > 0.25-mm diameter) using a wet-sieving procedure [25] . Soil core samples were collected from areas between switchgrass crowns in the switchgrass rows. Two replications were collected from each plot, mixed together for one sample per depth interval, and allowed to air dry for 15 days. Approximately 400 g of air-dried soil were used for the wet-sieving procedure, where soil was plunged in tap water at 30 cycles per minute for 5 minutes. Soil retained on the mesh openings of each of five sieve sizes (i.e., 4, 2, 1, 0.5, and 0.25 mm) was rinsed into an aluminum container with tap water. Water was decanted from the container, and the remaining soil was weighed after being dried at 70˚C for 24 hours. The soil mass from each container was summed to calculate the total mass of water- stable aggregates from each plot.
One soil sample for root density was collected per plot in September 2013 from the 0- to 15-cm depth interval using a 7.3-cm diameter core chamber and slide hammer, and prepared according to the procedures followed by Brye and Riley [26] . Root samples were washed on a 2-mm mesh screen to collect the root material, dried at 55˚C for 24 hours, and weighed. Root density samples were collected from areas between switchgrass crowns in the switchgrass rows.
In November 2013, double-ring infiltrometers were used to measure surface infiltration rates two days after a soaking rainfall. Mature switchgrass was trimmed using hedge trimmers and residue carefully removed prior to placement of infiltrometers. One double-ring infiltrometer measurement was conducted in each cultivar-harvest frequency-fertilizer source treatment combination. In order to maximize potential infiltration differences among treatment combinations, infiltration measurements were only conducted in the non-irrigated treatment. Double- ring infiltrometers were placed between switchgrass crowns in the switchgrass rows after switchgrass was mowed to a height of 6 cm. The outer-ring diameter was 30 cm, the inner-ring diameter was 6 cm, and rings were 10 cm in height. The infiltrometer was inserted approximately 2 cm deep into the soil and the outer ring was filled with tap water to act as a buffer between dry soil outside the outer ring and saturated soil inside the inner ring. The inner ring was filled with tap water and the distance from the top of the soil to the water surface in the inner ring was measured at 0, 1, 2, 3, 4, 5, 8, 10, 12, 15, 18, and 20 minutes.
Double-ring infiltration measurements were paired with mini-disk tension infiltrometer (Decagon, Pullman, Washington) measurements, where infiltrometer tension was set at −2 cm for each measurement. Two mini-disk infiltrometer measurements were conducted in each plot, with one measurement collected from the center-ring area immediately following double-ring infiltrometer measurements and one measurement collected in a nearby location. The infiltrative surface of the mini-disk infiltrometer was 4.5 cm. The two mini-disk measurements were performed between switchgrass crowns in the switchgrass rows in each plot for a total of 48 measurements. The height of the water inside the 2.1-cm diameter mini-disk infiltrometer water reservoir was recorded at 0, 1, 2, 3, 4, 5, 8, 10, 12, 15, 18, and 20 minutes. The total surface infiltration rate was calculated for both sets of infiltration measurements by dividing the total amount of infiltrated water by 20 minutes.
2.4. Statistical Analyses
The effects of cultivar, harvest frequency, irrigation, fertilizer source, soil depth, and their interactions on soil bulk density, soil chemical properties, particle-size distributions, and AS were evaluated by analysis of variance (ANOVA) using PROC GLM in SAS (version 9.3, SAS Institute, Inc., Cary, NC). A separate ANOVA was conducted to evaluate the effects of cultivar, harvest frequency, irrigation, fertilizer source, and their interactions on root density using SAS. A separate ANOVA was also conducted to evaluate the effects of cultivar, harvest frequency, fertilizer source, and their interactions on total surface infiltration rate for both sets of infiltration data. All treatments were treated as fixed effects for all ANOVAs conducted. An analysis of covariance (ANCOVA) was conducted to evaluate the effects of cultivar, harvest frequency, and fertilizer source on the relationship between the natural logarithm of the infiltration rate and the natural logarithm of the mid-point of the measurement time interval. When appropriate, means were separated by least significant difference (LSD) at α = 0.05.
3. Results
3.1. Soil Properties
3.1.1. Particle-Size Distribution
Throughout the study site, sand, silt, and clay in the top 20 cm varied somewhat. Though sand, silt, and clay distributions remained within the range of a silt-loam texture in all treatment combinations, sand, silt, and clay contents in the top 20 cm differed slightly among various treatment combinations (P < 0.05), with the largest differences occurring between soil depths, which was expected. In both depth intervals, sand content was greatest in the irrigated-“Alamo” treatment combinations (Table 1). Sand content was lowest in the top 10 cm in the non-irrigated-“Cave-in-Rock” (26.1%) and in the 10 - 20 cm depth interval in the non-irrigated-“Alamo” (27.5%) treatment combinations, which did not differ (Table 1). Averaged over all other treatment factors, silt content was greater (P < 0.01) in the top 10 cm than in the 10- to 20-cm depth interval (50.4 and 48.2%, respectively). Silt content was greater (P = 0.04) in the PL (50%) than in the CF (48.6%) treatment combinations. Clay content was greater (P = 0.03) in the CF (21.7%) than in the PL treatment combinations (20.6%). Silt content was greater (P < 0.01) in “Cave-in-Rock” (50.2%) than in “Alamo” (48.4%) treatments. Despite the significant fertilizer source effect on silt and clay and significant cultivar effect on silt content, all silt and clay differences between treatments were less than 2%. Small differences of this magnitude are not likely to affect agronomic management or productivity.
Averaged over harvest frequency, fertilizer source, and irrigation, clay content also differed between cultivars within soil depths (P < 0.01). As expected, clay content increased with increasing depth from the top 10 cm (19.5%) to the 10- to 20-cm depth interval (22.9%) for both cultivars (Figure 2). Clay content was greatest and least for “Alamo” treatment combinations in the 10- to 20-cm (22%) and in the 0- to 10-cm (17%) depth intervals, respectively (Figure 2).
The observed differences in sand, silt, and clay contents between soil depths were expected based on the reported textural classes of the top two horizons of the Leadvale silt-loam official series description [20] . Clay

Table 1. Summary of the effects of soil depth, cultivar, and irrigation on sand and extractable soil manganese (Mn) contents and electrical conductivity (EC).
*For each soil property, means followed by different letters differ significantly at P < 0.05.
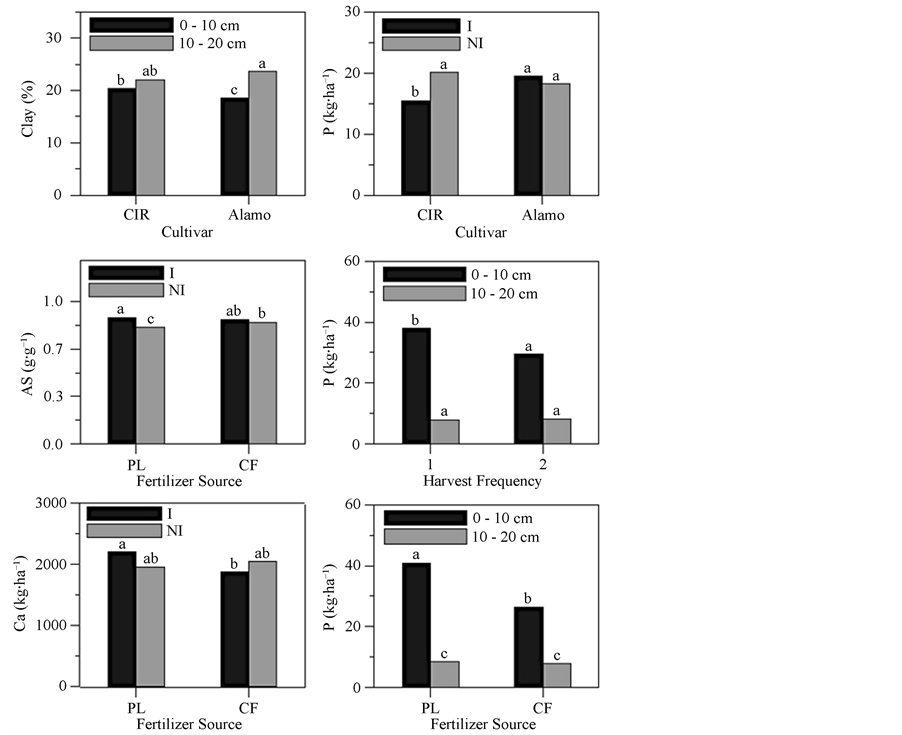
Figure 2. Soil clay content, aggregate stability (AS), and extractable soil phosphorus (P) and calcium (Ca) as affected by soil depth, irrigation [irrigated (I) and non-irrigated (NI)], cultivar [“Cave-in-Rock” (CIR) and “Alamo”], harvest frequency [one (1) harvest per year and two (2) harvests per year], and/or fertilizer source [poultry litter (PL) and commercial fertilizer (CF)]. Different letters atop bars within a soil property indicate a significant difference at P < 0.05.
accumulation with increasing depth was expected, as the surface Ap horizon grades to an argillic Bt horizon at approximately 20 cm [20] . Despite some relatively minor differences in particle-size distribution among various treatment combinations, differences were not large enough to change the soil taxonomic classification anywhere throughout the study site and would likely not influence practical agronomic management decisions related to switchgrass production.
3.1.2. Bulk Density
Bulk density was affected by several experimental treatment factors. As expected, averaged over all other treatment factors, soil bulk density was greater (P < 0.001) in the 10- to 20-cm depth (1.44 g∙cm−3) than in the top 10 cm (1.30 g∙cm−3). Averaged over soil depths and cultivars, soil bulk density was also greater (P = 0.004) in the irrigated-PL treatment combination with either harvest frequency (1.40 g∙cm−3) than the non-irrigated-1-cut treatment combination with either fertilizer source (1.33 g∙cm−3). Soil bulk density was unaffected (P > 0.05) by switchgrass cultivar.
3.1.3. Aggregate Stability
Similar to bulk density, aggregate stability was affected by several experimental treatment factors. Averaged over soil depth, cultivar, and harvest frequency, AS was greater (P = 0.03) under irrigated (0.93 g∙g−1) than non-irrigated (0.86 g∙g−1) treatments with PL, but did not differ between irrigation treatments with CF (0.86 g∙g−1; Figure 2). Averaged over irrigation, the greatest (P = 0.02) AS was measured in the “Alamo”-CF-2-cut treatment combination in the 10- to 20-cm depth (0.93 g∙g−1), while the lowest AS was measured in the “Cave- in-Rock”-PL-1-cut treatment combination in the top 10 cm depth (0.87 g∙g−1; Table 2).
3.1.4. Soil pH and Electrical Conductivity
Soil pH was unaffected by switchgrass cultivar, irrigation, harvest frequency, or soil depth (P > 0.05), but differed between fertilizer sources (P = 0.001). As expected, averaged over all other treatment factors, soil pH was greater in the PL (pH = 6.1) than in the CF (pH = 5.9) treatment. Though soil pH differed between fertilizer sources by only 0.02 units, nutrient availability and buffering capacity were likely different as well between fertilizer sources.
Similar to bulk density and aggregate stability, soil EC was affected by several experimental treatment factors. Averaged over fertilizer source and soil depth, soil EC was greatest (P = 0.016) in “Cave-in-Rock” (0.070 dS∙m−1) and least in “Alamo” (0.056 dS∙m−1) treatments without irrigation in the 2-cut harvest frequency. Averaged over harvest frequency and fertilizer source, soil EC was generally greater (P = 0.006) in the top 10 cm than in the 10- to 20-cm depth and was the lowest in the non-irrigated-“Alamo” and irrigated-“Cave-in-Rock” treatment combinations in the 10- to 20-cm depth interval, which did not differ (Table 1). Averaged over cultivar and irrigation, soil EC was also greatest (P = 0.020) in the 1-cut-PL treatment combination in the top 10 cm (0.081 dS∙m−1) compared to all other treatment combinations (Table 3). Soil EC did not differ among harvest- frequency-fertilizer-source treatment combinations in the 10- to 20-cm depth and averaged 0.058 dS∙m−1 (Table 3).
3.1.5. Extractable Soil Nutrients
Similar to bulk density, aggregate stability, and soil EC, numerous extractable soil nutrients were affected by multiple experimental treatment factors. Averaged over harvest frequency and fertilizer source, extractable soil Mn was greater (P = 0.026) in the irrigated-“Alamo” treatment combination in the 10- to 20-cm depth interval (230.2 kg∙ha−1) than in all other treatment combinations, which did not differ and averaged 176.6 kg∙ha−1
Table 2. Summary of the effects of soil depth, harvest frequency, cultivar, and fertilizer source on aggregate stability (AS).
†PL, poultry litter; CF, commercial fertilizer. *Means followed by different letters differ significantly at P < 0.05.
Table 3. Summary of the effects of harvest frequency, soil depth, and fertilizer source on extractable soil copper (Cu) content and electrical conductivity (EC).
†PL, poultry litter; CF, commercial fertilizer. *For each soil property, means followed by different letters differ significantly at P < 0.05.
(Table 1). Unexpectedly, averaged over all other factors, “Cave-in-Rock” treatments had greater (P = 0.033) extractable soil K (95 kg K ha−1) and lower (P = 0.019) extractable soil Na (43 kg Na ha−1) compared to “Alamo” treatments (79 kg K and 64 kg Na ha−1, respectively). Averaged over all other treatment factors, extractable soil Ca was greater (P = 0.031) in the 10- to 20-cm depth (2079 kg∙ha−1) than in the top 10 cm (1965 kg Ca ha−1). In contrast, extractable soil Fe was greater (P < 0.001) in the top 10 cm (216 kg Fe ha−1) than in the 10- to 20-cm depth (164 kg Fe ha−1).
Averaged over irrigation, cultivar, and harvest frequency, extractable soil P, K, Mg, S, Na, and Zn contents followed similar trends related to treatment combinations and were generally greater (P < 0.04) in the top 10 cm compared to the 10- to 20-cm depth. Extractable soil P (Figure 2), S, Zn (Figure 3), K, and Mg (Figure 4) contents were greatest in the PL treatment combinations in the top 10 cm and the lowest in the 10- to 20-cm depth regardless of fertilizer source, which did not differ. In contrast, extractable soil Na was generally greater in the 10- to 20-cm depth compared to the top 10 cm and was greatest in the 10- to 20-cm-depth-PL and lowest in the 0- to 10-cm CF treatment combination (Figure 3).
Averaged over irrigation, cultivar, and fertilizer source, extractable soil P, K, Mg, and Zn contents also differed between soil depths within harvest frequency. Extractable soil P (Figure 2), Zn (Figure 3), K, and Mg (Figure 4) contents followed similar trends related to treatment combinations and were generally greater (P < 0.02) in the top 10 cm compared to the 10- to 20-cm depth. Extractable soil P (Figure 2), Zn (Figure 3), K, and Mg (Figure 4) contents were greatest in the 1-cut treatment combination in the top 10 cm, which supported the

Figure 3. Extractable soil copper (Cu), zinc (Zn), sulfur (S), and sodium (Na) contents as affected by soil depth, irrigation [irrigated (I) and non-irrigated (NI)], harvest frequency [one (1) harvest per year and two (2) harvests per year], and/ or fertilizer source [poultry litter (PL) and commercial fertilizer (CF)]. Different letters atop bars within a soil property indicate a significant difference at P < 0.05.
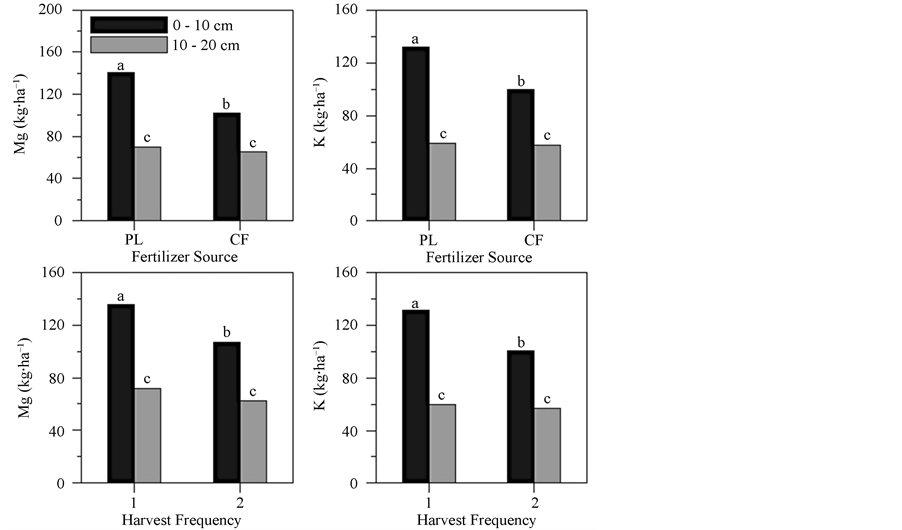
Figure 4. Extractable soil potassium (K) and magnesium (Mg) as affected by soil depth and fertilizer source [poultry litter (PL) and commercial fertilizer (CF)] or harvest frequency [one (1) harvest per year and two (2) harvests per year]. Different letters atop bars within a soil property indicate a significant difference at P < 0.05.
hypothesis that harvesting once after switchgrass senescence rather than twice per year allows greater retention of extractable soil nutrients. Extractable soil P (Figure 2), Zn (Figure 3), K, and Mg (Figure 4) contents were lower in the 10- to 20-cm, which did not differ between harvest frequencies, than in the 0- to 10-cm depth.
In addition, averaged over cultivar, harvest frequency, and soil depth, extractable soil Ca (Figure 2) and Cu (Figure 3) contents followed similar trends, as both were the lowest (P < 0.03) in the irrigated-CF and the greatest in the irrigated-PL treatment combination. Averaged over harvest frequency, fertilizer source, and soil depth, extractable soil P content was lower (P = 0.016) in the irrigated-“Cave-in-Rock” than in the “Alamo” of either irrigation treatment and in the non-irrigated-“Cave-in-Rock” treatment combination, which did not differ (Figure 2).
Averaged over cultivar, harvest frequency, and fertilizer source, extractable soil Zn content differed between irrigation treatments within soil depths. While the greatest (P = 0.025) extractable Zn content was in the irrigated-0- to 10-cm depth compared to all other treatment combinations, extractable Zn content was generally greater in the top 10 cm than in the 10- to 20-cm depth (Figure 3). Extractable soil Zn was lowest in the 10- to 20-cm depth of either irrigation treatment compared to all other treatment combinations (Figure 3). Averaged over soil depth, the greatest (P = 0.043) extractable Zn content was in the irrigated-“Alamo”-PL (2.3 kg∙ha−1) treatment, but did not differ from the “Cave-in-Rock”-PL treatment of either irrigation combination. The lowest extractable Zn content was in the irrigated-“Alamo”-CF (0.6 kg∙ha−1) treatment, but did not differ from all other CF treatments in combination with either irrigation or cultivar.
Averaged over irrigation and soil depth, extractable soil Cu (P = 0.009) was greatest in the “Alamo”-PL-1-cut and in the “Cave-in-Rock”-PL treatment combinations under both harvest frequencies (2.0 kg Cu ha−1) compared to all other treatment combinations. Averaged over cultivar and irrigation, extractable soil Cu content was greater (P = 0.038) in the 1-cut-PL treatment combination in the top 10 cm (2.9 kg Cu ha−1) than in all other treatment combinations, which were <2.0 kg Cu ha−1 (Table 4). Extractable soil Cu content was generally greater in the top 10 cm and in treatments that included PL. Averaged over harvest frequency and irrigation, extractable soil Cu content was greatest (P = 0.032) in the “Cave-in-Rock”-PL treatment combination in the top 10 cm (2.9 kg Cu ha−1) than all treatment combinations in the 10- to 20-cm depth, which were all <1.1 kg Cu ha−1 and did not differ.
Table 4. Summary of the effects of harvest frequency, cultivar, and fertilizer source on extractable soil copper (Cu) and iron (Fe) contents.
†PL, poultry litter; CF, commercial fertilizer. *For each soil property, means followed by different letters differ significantly at P < 0.05.
3.2. Root Density
In contrast to the initial hypothesis that irrigation would have minimal effect on belowground switchgrass growth in the climatic region of west-central Arkansas, averaged over all other treatment factors, switchgrass root density was greater (P = 0.031) in the irrigated (2.62 kg∙m−3) than in the non-irrigated (1.65 kg∙m−3) treatment.
It was also hypothesized that increasing the harvest frequency from 1 to 2 cuts per year would significantly decrease switchgrass root density. However, results did not support this initial hypothesis as root density was also unaffected (P > 0.05) by switchgrass cultivar and fertilizer source.
3.3. Infiltration Characteristics
3.3.1. Total Infiltration
Total water infiltration rates measured with the double-ring infiltrometer did not differ (P > 0.05) among any treatment combination. Total infiltration rates ranged from a low of 0.2 mm∙min−1 in the non-irrigated-“Alamo” treatment combination with either fertilizer source to a high of 2.4 mm∙min−1 in the non-irrigated-“Cave-in- Rock”-PL treatment combination and averaged 0.79 mm∙min−1 across all treatment combinations.
Unlike total infiltration rates measured with the double-ring infiltrometer, total infiltration rates measured with the mini-disk infiltrometer at a tension of −2 cm were greater (P = 0.034) in the 1-cut (33 mm∙min−1) than in the 2-cut (24 mm∙min−1) treatment. The total tension infiltration rate was unaffected (P > 0.05) by cultivar, irrigation, or fertilizer source.
3.3.2. Relationship between Infiltration Rate and Time
1) Double-ring infiltrometer
Though total infiltration measured with the double-ring infiltrometer did not differ among experimental treatments, averaged over fertilizer sources, the slope of the linear regression characterizing the natural logarithm of the infiltration rate against the natural logarithm of the mid-point time was greatest (P = 0.004) for the “Cave-in-Rock”-2-cut and “Alamo”-1-cut treatment combinations, which did not differ (Figure 5). The slope was smallest for the “Cave-in-Rock”-1-cut and “Alamo”-2-cut treatment combinations, which did not differ (Figure 5). In addition, averaged over cultivar, the slope of the linear regression characterizing the natural logarithm of the infiltration rate against the natural logarithm of the mid-point time was greater (P = 0.048) for the CF-1-cut than the PL-1-cut treatment combinations (Figure 5).
2) Mini-disk infiltrometer
Unlike the double-ring infiltrometer, the slope of the linear regression equations characterizing the natural logarithm of the infiltration rate against the natural logarithm of the mid-point time was positive and numerically greatest (P = 0.026) for the “Alamo”-CF-2-cut and numerically smallest and negative for the “Alamo”-PL-2-cut and “Cave-in-Rock”-CF-2-cut treatment combinations, which did not differ (Table 5). The y-intercept of the linear relationship was positive and numerically greatest (P = 0.049) in the “Cave-in-Rock”-PL-1-cut and positive and numerically smallest in the “Alamo”-CF-2-cut treatment combination (Table 5).
Table 5. Summary of parameters that characterize the relationship between the natural logarithm of the mini-disk (tension) infiltration rate and time.
*Means followed by different letters differ significantly at P < 0.05.

Figure 5. Natural logarithm (LN) of the double-ring infiltration rate per LN mid-point time as affected by cultivar [“Cave-in-Rock” (CIR) and “Alamo”] and harvest frequency [one (1) harvest per year and two (2) harvests per year] (top panel), or fertilizer source [Poultry Litter (PL) and Commercial Fertilizer (CF)] and harvest frequency (bottom panel). Solid regression line (top) includes CIR-2 and Alamo-1, for which slopes did not differ. Dashed regression line (top) includes CIR-1 and Alamo-2, for which slopes did not differ. Solid regression line (bottom) includes PL-1, CF-2, and PL-2, for which slopes did not differ. Dashed regression line (bottom) includes CF-1, PL-2, and CF-2, for which slopes did not differ.
4. Discussion
Overall, results of this study indicated treatments imposed on the switchgrass production system affected near- surface properties in the top 20 cm and surficial processes. However, treatment combinations that produced significant differences in the amount of aboveground biomass production noted previously by Jacobs and King [15] did not necessarily produce significant differences in the measured soil properties in this study.
4.1. Cultivar Effects
Switchgrass cultivar was not expected to affect most soil properties; however, AS and silt concentration, and Na, Fe, P, and K contents differed between cultivars when averaged over all other treatment factors. In addition, clay concentration differed by depth within cultivars when averaged over irrigation, harvest frequency, and fertilizer source. While the silt and clay differences were likely residual inherent differences from before the study was initiated, and assuming similar nutrient concentrations between cultivars, greater soil extractable P and K contents in “Cave-in-Rock” treatments may have resulted from lower nutrient removal rates according to lower biomass production compared to “Alamo” treatments [15] . Average biomass yields at this site over a four-year period (i.e., 2008 through 2011) were significantly greater from “Alamo” than from “Cave-in-Rock” treatments [15] ; thus, greater plant uptake and removal of macronutrients resulting in lower extractable soil P and K contents would be expected.
While extractable soil nutrient differences were relatively straightforward, AS depends on many factors related to soil, water, and plant relationships. Previous research in Arkansas has shown that aggregate stability in the top 10 cm is greater in undisturbed native prairie or prairie restorations than in cultivated, row-crop agroecosystems. Aggregate stability in row-crop production varied from 0.05 g∙g−1 in a non-irrigated, wheat (Triticum aestivum)-soybean (Glycine max), double-cropped system managed consistently for 10 years [27] to 0.11 g∙g−1 in irrigated and non-irrigated rice (Oryza sativa)-wheat double-cropped systems managed consistently for 6 years [28] . In contrast, Brye and Riley [26] reported total water-stable aggregate concentrations of 0.44 g∙g−1 in an undisturbed native prairie in northwest Arkansas. Interestingly, AS measured in this study, which averaged 0.89 g∙g−1 in the top 10 cm (Table 2), were two times greater than those measured in a native prairie ecosystem (0.44 g∙g−1) [26] . Differences may be attributed to the intensive nature of treatment combinations imposed in this study to maximize aboveground biomass production, such as irrigation and fertilizer applications. Greater AS observed in this study may also be attributed to complex interactions involving plant roots and soil aggregation and show the similarity of perennial, monoculture switchgrass production to native grasslands.
Differences in root density could influence AS, but results from this study showed that root density did not differ between cultivars. Soil organic matter (SOM) may also influence AS, but SOM was not measured in this study. The 0- to 15-cm depth interval where root density was measured in this study may not have captured enough of each cultivar’s unique rooting characteristics, which may explain why AS and not root density differed between cultivars when averaged over all other factors. Frank et al. [29] reported that 50% of switchgrass root mass occurred in the top 30 cm of soil. In addition, Jung et al. [30] reported that switchgrass root partitioning between fine and coarse roots is dynamic and may be altered with differing levels of soil fertility. Due to differing extractable soil nutrient contents between cultivars, the partitioning between fine and coarse roots may not have been accurately captured for all treatments by the 2-mm sieve size used for the root washing procedure.
4.2. Irrigation Effects
Similar to cultivar effects, it was hypothesized that irrigation treatments would have little influence on soil properties. However, irrigation treatments produced significant differences in root density. Though application of irrigation to the switchgrass crop did not significantly increase biomass yields [15] , irrigation increased root density compared to the non-irrigated treatment when averaged over all other treatment factors. It was clear that irrigation directly stimulated root growth and, as a result, indirectly altered additional soil properties measured in this study, such as AS.
Averaged over all other treatment factors, AS did not differ between irrigation treatments. However, increased AS been linked to greater root density, as roots encourage the formation and stabilization of soil aggregates [31] . The lack of a significant irrigation effect on AS in this study was in contrast to Singer et al. [32] , where the rewetting of dry soil during irrigation cycles decreased the concentration of soil macroaggregates compared to a non-irrigated site. The destruction of soil aggregates due to irrigation was attributed to an increase in air pressure inside dry soil macroaggregates during the rewetting process (i.e., slaking) [32] . Soil aggregates may not have experienced sufficient wetting and drying for slaking to occur in west-central Arkansas, given irrigation did not significantly increase switchgrass biomass yield [15] .
Whalen and Chung [33] compared soil aggregate stability with differing application rates of cattle manure on cropland in Canada. While Whalen and Chung [33] hypothesized that soil macroaggregate (>12.1 mm) stability would increase with increased manure application rate, results showed that the proportion of soil macroaggregates actually decreased with manure application compared to no manure application. The dispersive effects of monovalent cations and foreign soil present in cattle manure were cited as the explanation for their results [33] . Edaño [34] also determined that the application of manure fertilizer (i.e., cattle manure or PL) compared to CF did not encourage macroaggregate formation in switchgrass plots harvested in both 1- and 2-cut systems.
The dispersive effects of monovalent cations typically present in PL, such as Na, may have affected soil properties evaluated in this study. For example, irrigation of plots fertilized with PL may have caused greater dispersion by further mobilizing monovalent cations. In this study, extractable soil Na was greater in the 10- to 20-cm depth than in the top 10 cm. Results from this study also further support the conclusions of Whalen and Chung [33] and Edaño [34] as soil bulk density was greater in the irrigated-PL treatment combination with either harvest frequency (1.41 g∙cm−3) than in the non-irrigated-1-cut treatment combination with either fertilizer source (1.33 g∙cm−3).
4.3. Fertilizer Source Effects
The application of two different fertilizer sources over a four-year period [15] produced significant differences in extractable soil nutrient levels. Even though significant differences between fertilizer sources were present among extractable soil nutrient levels after the four-year study period, biomass yield was unaffected by fertilizer source [15] . In contrast, Edaño [34] reported that switchgrass biomass yield was greater with PL compared to CF application, switchgrass seeded with legumes, and an unfertilized control.
Poultry litter was applied at a rate of 4.5 Mg∙ha−1 and corresponding amounts of N, P, and K were applied as CF. Poultry litter contains more than just N, P, and K, and significant differences between the levels of extractable soil nutrients were apparent in this study. Only one soil nutrient tested (i.e., Mn) did not differ between fertilizer sources when averaged across all other treatment factors. Soil collected from treatment combinations fertilized with PL contained significantly greater contents of extractable soil P, K, Ca, Mg, S, Na, Fe, Zn, and Cu than CF treatment combinations. Edaño [34] observed similar increases in extractable soil P when switchgrass was fertilized with cattle manure and PL instead of CF.
In addition, both soil pH and EC were significantly greater in PL than in CF treatment combinations, which were expected. Results from this study regarding soil pH changes in “Alamo” switchgrass from fertilizer sources were similar to those reported by Edaño [34] in Oklahoma. Soil pH slightly increased when fertilized with cattle manure or PL and slightly decreased when fertilized with CF compared to an unfertilized control [34] . The differences in pH would not likely affect agronomic management decisions, especially given that soil pH values of 5.5 to 6.6 are considered optimum for native, warm-season grass establishment in Arkansas [21] .
4.4. Harvest Frequency Effects
The previous yield study by Jacobs and King [15] largely focused on the effects of harvest frequency on biomass yield due to the dual-purpose nature of switchgrass production as a potential livestock forage and as a potential renewable energy feedstock. Harvesting once per year in the fall after a frost (i.e., the 1-cut system) produces biomass low in livestock forage quality, but desirable quality for conversion to renewable fuels. Conversely, harvesting twice per year (i.e., the 2-cut system) increases switchgrass crop flexibility for landowners who may harvest the first cutting of switchgrass for hay or grazing when livestock forage quality is greatest [15] . Jacobs and King [15] noted that, averaged across all other treatment combinations, the 2-cut system produced significantly more biomass than the 1-cut system.
Despite the increased yield for switchgrass harvested in the 2-cut system, removing greater amounts of biomass also decreased near-surface extractable soil K and Mg levels. In addition, AS and mini-disk total infiltration rates were significantly lower in the 2-cut than in the 1-cut system. In a similar study, Edaño [34] noted switchgrass harvested in a 2-cut system had significantly lower extractable soil nitrate concentrations, total microbial biomass, and total mycorrhizal biomass in the top 10 cm than those in a 1-cut harvest system.
The lack of significant effects due to increased harvest frequency on root density are in contrast to harvest frequency effects on aboveground biomass yield. Jacobs and King [15] reported that mean biomass yield over the four-year study was significantly greater for the 2-cut (17.9 Mg∙ha−1) compared to the 1-cut (12.1 Mg∙ha−1) system when averaged over all other treatment factors. Data from above- and belowground plant production further demonstrate that increasing switchgrass yield by harvesting twice per year does not significantly decrease root density in the soil and climatic conditions of west-central Arkansas.
4.5. Infiltration Characteristics
In general, results indicated total infiltration rates were greater under tension when measured with the mini-disk infiltrometer compared to the double-ring infiltrometer because each method measured different mechanisms of infiltration. Infiltration was only measured in the inner ring for the double-ring infiltrometer while adjacent soil was nearly saturated throughout the 20-minute measurement period. Infiltration measured with the double-ring infiltrometer measured downward or vertical water infiltration (i.e., one-dimensional water infiltration). In contrast, soil around the mini-disk infiltrometer was unsaturated throughout the 20-minute measurement period; thus infiltration was likely both vertically downward and lateral (i.e., more three-dimensional water infiltration).
Due to the differences associated with measuring infiltration in unsaturated and nearly saturated conditions, only mini-disk infiltration rates were directly affected by harvest frequency. The mini-disk infiltration rate was greater in the 1-cut than in the 2-cut treatment, which supported the hypothesis that more intensive harvest frequencies decrease water infiltration through soil micropores. Increases in wheel traffic from tractors and other harvesting equipment in 2-cut systems may not consistently increase bulk density, as previous data showed, but may reduce soil micropore abundance and volume and consequently hydraulic conductivity. Removal of the switchgrass canopy cover during the growing season (i.e., at the June harvest in the 2-cut system) likely exposed more soil than in the 1-cut treatment and may have allowed soil micropores to become sealed or clogged by temporary crusting from precipitation or irrigation.
The slope of the linear regression relating the natural logarithm of the infiltration rate and the natural logarithm of time provided additional information about what could happen to surface water (i.e., precipitation or irrigation) in each treatment combination. Large (i.e., steep) slopes represented greater surface infiltration per unit time, while smaller (i.e., flatter) slopes represented slower surface infiltration per unit time. This relationship was readily apparent when comparing the slopes averaged over fertilizer source for double-ring infiltration, which differed by cultivar within harvest frequency (Figure 5). The treatment combinations with modest infiltration rates and a smaller slope characterizing the relationship between the natural logarithm of the infiltration rate and the natural logarithm of time included the “Cave-in-Rock”-2-cut and “Alamo”-1-cut combinations, which did not differ (Figure 5). Conversely, the slopes characterizing the relationship between the natural logarithm of the infiltration rate and the natural logarithm of time associated with the “Cave-in-Rock”-1-cut and “Alamo”-2-cut treatment combinations were larger and represented greater surface infiltration per unit time (Figure 5). A similar relationship was observed when the treatments were averaged over cultivar and differed by fertilizer source within harvest frequency, as the slope of the PL-1-cut treatment combination was smaller compared to the slope of the CF-1-cut treatment combination (Figure 5). One reason the slope was smaller for the PL treatment combination could be related to the presence of monovalent cations in the PL, particularly Na, which could have caused more surface soil dispersion than CF. The ecological implications for greater infiltration and storage of surface water in the soil profile over shorter periods are vast and may affect the amount of plant available water for crop growth, the amount of off-site nutrient loss, and the potential for erosion of topsoil.
The mean double-ring infiltration rate into a silt-loam soil, which was measured in this switchgrass production study after four years of continuous and consistent management, was less than that reported by Bonin et al. [35] for switchgrass harvested in a 1-cut system in Ohio (2.8 mm∙min−1). Decreased infiltration rates recorded in this study may be due to a variety of site differences among the two studies, including different switchgrass plant population densities resulting from differing initial seeding rates (i.e., 11.2 and 4.4 kg pure live seed∙ha−1 in Ohio and for this study, respectively), differences in soil surface texture (i.e., silty clay loam in Ohio and silt loam in this study), and/or differences in switchgrass stand age (i.e., seven years in Ohio and four years in this study) [35] . Another factor that may have contributed to decreased infiltration rates at this site compared to the Ohio site [35] could have been the hydrophobic properties of ash from burning as part of annual stand management activities. Switchgrass stubble was burned each March throughout the four-year treatment application period in this study, while the Ohio site was not burned at all during their study period [35] . Consequently, reducing the frequency of prescribed burns may increase infiltration rates.
Studies that evaluate soil aggregate stability may give ancillary information toward interpreting water infiltration rates because soil aggregate size influences soil pore space. In this study, though AS did not systematically differ between harvest frequencies, the total tension infiltration rate was greater in the 1-cut than in the 2-cut system, which supports the supposition of Edaño [34] that harvesting switchgrass in a 1-cut system has the potential to increase water infiltration rates. Results from this study indicate water infiltration rates do not consistently improve (i.e., increase) with greater AS. In addition, results show that treatment effects may be overlooked if only saturated water infiltration is evaluated.
4.6. Practical Applications
Producers and other private landowners engaged in feedstock production must make informed management decisions to maximize production while protecting soil and water resources. A first step in providing information to producers and landowners lies in pairing aboveground management strategies to maximize biomass yield, such as cultivar choice, irrigation management, harvest frequency, and choice of fertilizer, with belowground consequences.
Similar to the results of this study, Jacobs and King [15] also noted that each switchgrass cultivar responded differently to the 2-cut harvest frequency, even though mean annual production over the four-year period did not differ significantly between cultivars within harvest frequency averaged over fertilizer source. The “Cave-in- Rock”-2-cut treatment combination produced an average of 62% more biomass compared to the 1-cut system, while the “Alamo”-2-cut treatment combination only produced an average of 35% more biomass compared to the 1-cut system. The results regarding cultivar response to the 2-cut harvest frequency were similar to those reported by Fike et al. [36] , where maximum switchgrass biomass yield was achieved by harvesting lowland cultivars (e.g., “Alamo”) in a 1-cut harvest frequency and upland cultivars (e.g., “Cave-in-Rock”) in a 2-cut harvest frequency [36] . This study also supported the conclusion of Edaño [34] that lowland cultivars are better suited to dedicated energy crop production, while upland cultivars are better suited as dual-use livestock forage and energy crop production.
Biomass yield information coupled with soil hydraulic properties provide valuable information to landowners for making management decisions. For example, landowners may choose to harvest twice per year only if “Cave-in-Rock” is used, knowing that increased biomass yield could be balanced by the trade-off of decreased water infiltration rates. Similarly, landowners may only harvest “Alamo” once per year, as harvesting twice per year may only increase yields by 35%, while also decreasing infiltration rates. Landowners who are interested in converting highly erodible cropland to switchgrass production may choose to plant “Alamo” instead of “Cave- in-Rock” to decrease the potential for soil erosion due to more water-stable soil aggregation. Subtleties associated with these management strategies may become important if switchgrass is grown on the vast areas needed to support industrial facilities for renewable fuel production.
5. Conclusions
Results showed that four years of consistent agronomic management with various strategies to maximize switchgrass production in west-central Arkansas produced significant soil property differences, some of which were small and of limited practical use, while other differences were larger and had practical management implications. Results from this study also illuminated new opportunities for producers and landowners to customize switchgrass management systems to address specific natural resource goals. In general, “Alamo” produced greater biomass yields and greater AS, which resulted in greater depletion of extractable soil P and K contents over time compared with “Cave-in-Rock”. Irrigating switchgrass, though not currently cost-effective or recommended for marginal sites, significantly increased AS and switchgrass root densities when averaged over all other treatment factors. Harvesting switchgrass in a 2-cut system significantly decreased AS, extractable soil K and Mg contents, and total tension infiltration rates. Fertilizing switchgrass with PL rather than CF generally increased soil pH, EC, and extractable soil P, K, Ca and Mg contents, though both PL and CF appear to be viable options for landowners interested in switchgrass production.
Further investigations are needed to evaluate the effect of management strategies when no fertilizer is applied to assess soil property change if or when the bulk of fertilizers are diverted for growing food crops to feed a growing world population. More information is also needed about the fate of surface water and infiltration characteristics associated with switchgrass production strategies, as the importance of surface water and groundwater recharge only increase with time. Finally, this study demonstrated the need to enlarge the scope of discussion when assessing the feasibility and natural resource consequences of producing energy crops in the US.
Acknowledgements
The authors are grateful for the field and laboratory assistance provided by Bryan Jacobs, Eddie Pratt, Debbie Orick, Dale Goff, Michele Helton, Julie Osborne, and Taylor Adams.
References
- Energy Information Administration (EIA) (2013) How Dependent Are We on Foreign Oil? http://www.eia.gov/energy_in_brief/article/foreign_oil_dependence.cfm
- United States Environmental Protection Agency (USEPA) (2013) Renewable Fuel Standard. http://www.epa.gov/otaq/fuels/renewablefuels/
- Energy Information Administration (EIA) (2013) Monthly Energy Review. http://www.eia.gov/totalenergy/data/monthly/pdf/mer.pdf
- Parrish, D.J. and Fike, J.H. (2005) The Biology and Agronomy of Switchgrass for Biofuels. Critical Reviews in Plant Science, 24, 423-459. http://dx.doi.org/10.1080/07352680500316433
- Tillman, D.A. (2000) Biomass Cofiring: The Technology, the Experience, the Combustion Consequences. Biomass & Bioenergy, 19, 365-384. http://dx.doi.org/10.1016/S0961-9534(00)00049-0
- United States Department of Agriculture, Economic Research Service (USDA-ERS) (2012) Cattle and Beef Production Overview. http://www.ers.usda.gov/topics/animal-products/cattle-beef.aspx#.U-5by1bxVcw
- Pimentel, D., Harvey, C., Resosidarmo, P., Sinclair, K., Kurz, D., McNair, M., Crist, S., Sphritz, L., Fitton, L., Saffouri, R. and Blair, R. (1995) Environmental and Economic Costs of Soil Erosion and Conservation Benefits. Science, 276, 1117-1123. http://dx.doi.org/10.1126/science.267.5201.1117
- McLaughlin, S.B. and Kszos, L.A. (2005) Development of Switchgrass (Panicum virgatum) as a Bioenergy Feedstock in the United States. Biomass & Bioenergy, 28, 515-535. http://dx.doi.org/10.1016/j.biombioe.2004.05.006
- Stubbendick, J., Hatch, S.L. and Butterfield, C.H. (1998) North American Range Plants. 4th Edition, University of Nebraska Press, Lincoln.
- Popp, M.P. (2007) Assessment of Alternative Fuel Production from Switchgrass: An Example from Arkansas. American Journal of Agricultural Economics, 39, 373-380.
- McLaughlin, S.B., Kiniry, J.R., Taliaferro, C.M. and De La Torre Ugarte, D. (2006) Projecting Yield and Utilization Potential of Switchgrass as an Energy Crop. Advances in Agronomy, 90, 267-297. http://dx.doi.org/10.1016/S0065-2113(06)90007-8
- United States Department of Agriculture, National Agricultural Statistics Service (USDA-NASS) (2014) Rank of States: Production of Livestock, Arkansas, 2013. http://www.nass.usda.gov/Statistics_by_State/Arkansas/Publications/Statistical_Bulletin/Livestock_Data/arliverank.pdf
- Mitchell, C.C. and Donald, J.O. (1999) The Value and Use of Poultry Manures as Fertilizer. Alabama Cooperative Extension System, Circular ANR-244, Alabama A&M University, Auburn University, Auburn.
- Adler, P.R., Sanderson, M.A., Boateng, A.A., Weimer, P.J. and Jung, H.J.G. (2006) Biomass Yield and Biofuel Quality of Switchgrass Harvested in Fall and Spring. Agronomy Journal, 98, 1518-1525. http://dx.doi.org/10.2134/agronj2005.0351
- Jacobs, A.A. and King, J.R. (2012) Using Fertilization, Irrigation, and Harvest Strategies to Maximize “Alamo” and “Cave-in-Rock” Switchgrass Biomass Yield in the Southern Ozarks. http://www.plant-materials.nrcs.usda.gov/pubs/arpmctr11197.pdf
- Kering, M.K., Butler, T.J., Biermacher, J.T., Mosali, J. and Guretzky, J.A. (2012) Effect of Potassium and Nitrogen Fertilizer on Switchgrass Productivity and Nutrient Removal Rates under Two Harvest Systems on a Low Potassium Soil. BioEnergy Research, 6, 329-335. http://dx.doi.org/10.1007/s12155-012-9261-8
- Bransby, D. and Huang, P. (2014) Twenty-Year Biomass Yields of Eight Switchgrass Cultivars in Alabama. BioEnergy Research, 7, 1186-1190. http://dx.doi.org/10.1007/s12155-014-9448-2
- Burner, D.M. (2012) Weather Summary for the Dale Bumpers Small Farms Research Center 2005-2012. Unpublished Data, Booneville.
- National Oceanic and Atmospheric Administration (NOAA) (2010) Climatography of the United States, Annual and Seasonal Normals of Temperature and Precipitation 1981-2010: Booneville, Arkansas. United States Department of Commerce, National Climatic Data Center, Asheville.
- United States Department of Agriculture, Natural Resource Conservation Service (USDA-NRCS) (2003) Leadvale Soil Series Official Description. https://soilseries.sc.egov.usda.gov/OSD_Docs/L/LEADVALE.html
- United States Department of Agriculture, Natural Resource Conservation Service (USDA-NRCS) (2009) Establishing Native Warm Season Grass Mixtures Fact Sheet. http://efotg.sc.egov.usda.gov/references/public/AR/native_warm_season_grass.pdf
- Bouyoucos, G.J. (1927) The Hydrometer as a New Method for the Mechanical Analysis of Soils. Soil Science, 23, 343- 353. http://dx.doi.org/10.1097/00010694-192705000-00002
- Mehlich, A. (1984) Mehlich 3 Soil Test Extractant: A Modification of Mehlich 2 Extractant. Communications in Soil Science & Plant Analysis, 15, 1409-1419. http://dx.doi.org/10.1080/00103628409367568
- Tucker, M.R. (1992) Determination of Phosphorous by Mehlich 3 Extraction. In: Donohue, S.J., Ed., Reference Soil and Media Diagnostic Procedure for the Southern Region of the United States, Southern Cooperative Series Bulletin 374, Virginia Agricultural Experiment Station, Blacksburg, 9-12.
- Yoder, R.E. (1936) A Direct Method of Aggregate Analysis of Soils and a Study of the Physical Nature of Erosion Losses. Agronomy Journal, 28, 337-351. http://dx.doi.org/10.2134/agronj1936.00021962002800050001x
- Brye, K.R. and Riley, T.L. (2009) Soil and Plant Property Differences across a Chronosequence of Humid-Temperate Tallgrass Prairie Restorations. Soil Science, 174, 346-357. http://dx.doi.org/10.1097/SS.0b013e3181a93daa
- Smith, S.F., Brye, K.R., Chen, P., Gbur, E. and Korth, K. (2014) Residue and Water Management Effects on Aggregate Stability and Aggregate-Associated Carbon and Nitrogen in a Wheat-Soybean, Double-Crop System. Soil Science Society of America Journal, 78, 1378-1391. http://dx.doi.org/10.2136/sssaj2013.12.0534
- Anders, M.M., Brye, K.R., Olk, D.C. and Schmid, B.T. (2010) Rice Rotation and Tillage Effects on Soil Aggregation and Aggregate Carbon and Nitrogen Dynamics. Soil Science Society of America Journal, 76, 994-1004. http://dx.doi.org/10.2136/sssaj2010.0436
- Frank, A.B., Berdahl, D.J., Hanson, J.D., Liebig, M.A. and Johnson, H.A. (2004) Biomass and Carbon Partitioning in Switchgrass. Crop Science, 44, 1391-1396. http://dx.doi.org/10.2135/cropsci2004.1391
- Jung, J.Y., Lal, R., Jastrow, J.D. and Tyler, D.D. (2011) Nitrogenous Fertilizer Effects on Soil Structural Properties under Switchgrass. Agriculture, Ecosystems & Environment, 141, 215-220. http://dx.doi.org/10.1016/j.agee.2011.01.016
- Six, J., Bossuyt, H., Degryze, D. and Denef, K. (2004) A History of Research on the Link between (Micro)aggregates, Soil Biota, and Soil Organic Matter Dynamics. Soil & Tillage Research, 79, 7-31. http://dx.doi.org/10.1016/j.still.2004.03.008
- Singer, M.J., Southard, R.J., Warrington, D.N. and Janitzky, P. (1992) Stability of Synthetic Sand-Clay Aggregates after Wetting and Drying Cycles. Soil Science Society of America Journal, 56, 1843-1848. http://dx.doi.org/10.2136/sssaj1992.03615995005600060032x
- Whalen, J.K. and Chang, C. (2002) Macroaggregate Characteristics in Cultivated Soils after 25 Annual Manure Applications. Soil Science Society of America Journal, 66, 1637-1647. http://dx.doi.org/10.2136/sssaj2002.1637
- Edaño, M.L.S. (2009) Effects of Nutrient Sources, Harvest Frequency and Environmental Conditions in Switchgrass Production and Soil Properties. Ph.D. Dissertation, Oklahoma State University, Stillwater.
- Bonin, C., Lai, R., Schmitz, M. and Wullschleger, S. (2012) Soil Physical and Hydrological Properties under Three Biofuel Crops in Ohio. Acta Agriculturae Scandinavica, 62, 595-603.
- Fike, J.H., Parrish, D.J., Wolf, D.D., Balasko, J.A., Green, J.T., Rasnake, M. and Reynolds, J.H. (2006) Switchgrass Production for the Upper Southeastern USA: Influence of Cultivar and Cutting Frequency on Biomass Yields. Biomass & Bioenergy, 30, 207-213. http://dx.doi.org/10.1016/j.biombioe.2005.10.008