Open Journal of Soil Science
Vol.3 No.6(2013), Article ID:38021,10 pages DOI:10.4236/ojss.2013.36030
Land Use and Soil Texture Effects on Organic Carbon Change in Dryland Soils, Senegal
![]()
1Centre de Suivi Ecologique (CSE), Dakar-Fann, Sénégal; 2Faculty of Agronomy and Agricultural Sciences, University of Dschang, Dschang, Cameroon; 3Swiss Federal Institute of Technology EPFL, ENAC IIE ECOS, Lausanne, Switzerland; 4Institute of Geography, Copenhagen, Denmark.
Email: *etemgoua1[at]yahoo.com
Copyright © 2013 Assize Touré et al. This is an open access article distributed under the Creative Commons Attribution License, which permits unrestricted use, distribution, and reproduction in any medium, provided the original work is properly cited.
Received September 5th, 2013; revised October 5th, 2013; accepted October 12th, 2013
Keywords: δ13C; Dryland; Land Use; Soil Organic Carbon; Soil Texture
ABSTRACT
Soil organic carbon (SOC) losses due to poor soil management in dryland are now well documented. However, the influence of soil properties on organic carbon change is not well known. The groundnut plant (Arachis hypogaea L.), and the dominant crop system in the Senegal’s Soudanian zone, have been compared with semi-natural savanna. Leaves, stems and roots biomass were measured, and soil characteristics were analysed. The total leaves and stems biomass was 1.7 and 2.7 Mg ha−1 dry matter in groundnut fields and savanna respectively. Total SOC stocks were low (8 to 20 Mg C∙ha−1 within upper 0.2 m depth, 20 to 64 Mg C∙ha−1 within upper 1 m depth) and were significantly lower (P < 0.05) in sandy soils than in sandy clayey soils, and lower (approximately 27% - 37%) in groundnut fields than in savanna soils. δ13C values show that SOC quality is transformed from the savanna plants (C4/C3 mixed-pools) to C3-pools in groundnut cultivated zone, with the organic matter signature more preserved in the clayey soils. This study confirms that converting woodland to groundnut fields provokes texture transformation and SOC loss. The results call for the extreme necessity to regenerate the wooded zone or encourage practices that favour SOC restitution.
1. Introduction
The establishment of the Kyoto Protocol has resulted in a focus on biomass and soils for C sequestration. In order to make C credited meaningful, sustained C sequestration for decades or longer period is required.
Soils contain 1500 - 2000 Pg C, representing the third reservoir of C after ocean and fossil fuels [1]. Soil organic carbon (SOC) storage is chiefly controlled by primary production input and organic matter evolution. Changes in land use affect the amount of carbon stored in vegetation and soils and, hence, the flux of carbon between land and the atmosphere [1]. Increase of primary production will result in an increase of C storage, whereas increasing decomposition (i.e., reduce C turnover time) will have an opposite effect [2]. The organic matter input to arable soils is lower than to forest soils because a greater proportion of the produced biomass is harvested in the former.
Many factors (climate, land use, soil moisture, soil texture, clay content, mineral, erosion, leaching, fire, etc.) play a role in regulating the accumulation and loss of SOC storage [3,4]. The dynamic of soil carbon storage and release is complex and still not well understood [2]. Delta 13C (δ13C) values have been utilized to document vegetation change and to quantify soil organic matter turnover [5]. The majority of tropical fodder and grass of savanna or steppe are C4-plants with δ13C values in the range of −8% to −18%. Most notable are corn, sorghum, millet and sugar cane [6,7]. C3-plants are more characteristic of the tropical forests where the δ13C varies between −22% and −35% [7], including groundnut plants. Delta 13C values are not altered significantly during decomposition and soil organic matter formation, essentially into the fine-silt-sized fraction [6,8,9]. Consequently, δ13C values of SOC reflect the relative contribution of plant species to net primary production.
In the West Africa region, it has been established that intensive cropping regimes lead to a reduction in the vegetation productivity and an impoverishment of the soil (acidification, reduction in structural stability, etc.)
[10]. This degradation is often related to a reduction in organic carbon stocks [11]. Many studies recently outlined information regarding changes in SOC distribution and the total mass stored for a dryland cropping system in semiarid regions [10-14]. The specific importance for the Sahel is the high vulnerability to climate change in already impoverished rural societies. A carbon market is now operational but without substantial inclusion or participation of Sahelian projects or countries. Many activities are now promoted to determine developing countries’s biophysical and socio-economic potential for carbon sequestration in soils with the ultimate objective to promote sustainable agriculture, restore degraded environments, and enhance food security and livelihoods among people [12,13]. SOC quality studies are very scarce [13,14]. Up-to-date regional, integrated soil and woodland inventories are required for planning improved land-use management and restoration [13]. This study aims to determine SOC stocks in the semiarid central Senegal and to link SOC quality variations to the effects of soil texture (sandy versus sandy clayey) and land use (savanna versus groundnut cultivation).
2. Materials and Methods
2.1. General Aspects of the Study Area in Kaffrine
The Division of Kaffrine (total area around 1.1 × 10⁶ ha) is located in central Senegal (13˚49'N - 15˚19'W). The climate is dry tropical, and rainfall occurs between June and October, averaging 600 - 700 mm per annum (yr 1960-2000). The average annual temperature is 26˚C. The relief is flat and situated at 20 - 50 m above sea level. The geological substratum consists of sandy-clayey to clayey-sandy sandstone, with ferruginous cement, sometimes capped of duricrust [15]. The plateau, on which slash-and-burn agriculture is practised, is still covered with shrubby undergrowth, savanna and old fallows. This vegetation is semi-natural due to human exploitation for fire wood. Resprouting Combretaceae (mostly Combretum geitonophyllum Diels, C. glutinosum Perr. and Terminalia macroptera G. et Perr.) are the major component of the woody vegetation. Bush fields at the edge of the plateau are devoted to the cropping field. Groundnut (Arachis hypogaea L.) is the main crop. Tillage is advised for groundnut cultivation: soil quite ventilated to support the fixing of nitrogen, well-drained to avoid the rot of the seeds before the lifting and well structured to facilitate the development of the gynophores [16]. The farmers always practise at least one ploughing with draught animals to 10 - 15 cm depth. The tree cover on the groundnut fields of Kaffrine is less than 3%. After harvest, the entire groundnut plant, including roots, is removed from soil and stored for animals forage. Land use management consists of clearing savanna vegetation to establish groundnut fields, occasionally alternating with other crops (millet, rice, sorghum and cotton) and fallow. Most land is cropped, so the (semi-) natural savanna soils were very scarce.
The dominant soil type belongs to the order of ferric Luvisols with luvic Arenosols and gleyic Luvisols [17] and is sandy with a clay content of less than 20%. Iron accumulations are often observed in the form of well delimited spots or hardened concretions below the horizon of argillaceous accumulation, under 20 cm depth [18]. Chemical analysis of similar soils reveals clay mineral dominated by kaolinite [15], lesser CEC clay mineral.
2.2. Study Sites
Eleven villages of the division were selected based on soil characteristics (occurrence, area, type of soil) and distribution from previous studies within the division. In the selected villages, the soil surveyed was targeted at two types of land use: groundnut field and savanna. Study sites were selected according to age (years after land clearing) and soil texture. The soils were classified as ferric Luvisols [17]. The soil profile was homogeneous, with massive structure and without coarse elements. They are formed on sandy material of dunes or sandstone deposits. Two textural classes were selected, sandy soils (SAS) and sandy clayey soils (SCS). Furthermore, these two soil texture classes represented the range of soils in terms of land use and texture found within the study area (Table 1). 26 sites were surveyed, with 5 per cultivation duration and soil texture type and 6 sites in wooded savanna.
2.3. Leaves, Stems and Roots Biomass Estimation
The leaf biomass of ligneous plants was evaluated in each of the selected villages, in four circular plots along a 200 m transects, located far from human constructions. The size of each plot was selected depending on tree density and it varied between 1/16 and 1 ha. Ten small branches of each woody species among the most dominant in each plot were defoliated. The total fresh leaf biomass was weighted, and approximately 200 g of this leaf mass from each species were dried at 110˚C over 48 h. Stems samples were treated similarly. The analyses were carried out on 70 plant samples (Table 1).
The leaf biomass, in grams per individual tree, was estimated based on the formula:
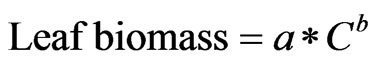 (1)
(1)
where a and b are constants depending on species (proposed by [19] and used by [20]; a is between 0.34 and 14, and b is between 1.18 and 2.71; C = girth of the considered trunk in centimetres at 1.3 metres height.
Leaves and stems biomass were measured in groundnut fields after harvest and plant uprooting.
Below-ground biomass was not quantified, but it is assumed to be 70% of total biomass, representing the average value of those reported by [20] for a similar Senegalese area. On this basis, the proportion of root biomass and the equivalent mass of carbon were calculated for each soil and land use type.
The rate of annual C refund was estimated according to [21], 1% and 20% of the total biomass for cultivated dryland and savanna fields respectively.
2.4. Soil Sampling and Analysis
Twenty-six soil profiles were dug on groundnut fields and areas representing semi-natural savanna (20 and 6 respectively). Eleven profiles were on SAS soil and fifteen on SCS soil (Table 1), with at least two soil profiles per selected village. Soil samples were collected at 0 - 10, 10 - 20, 20 - 50, 50 - 80 and 80 - 100 cm soil depths. Samples were air-dried and sieved through a 2-mm stainless steel sieve before they were analysed for organic C and N content, pH, phosphorous as well as particle-size distribution.
Soil organic carbon was analysed by conductimetric measurement of CO2 after combustion (apparatus Casumat 8-Adge Wöstoff) and nitrogen according to the Kjeldahl method (Technicon apparatus). Soil pH was measured in a 1:2.5 soil/water solution. Phosphorous was analysed by Bay II method. Non-perturbed soil samples per 10 cm layer, down to 1 m depth, were taken using a cylindrical metal sampler (100 cm3 in volume). Six replicates were done. The bulk densities were determined based on the mass of dry soil/specific volume of samples. C concentrations were converted to total content for each of the 5 selected depths as the product of concentration, depth of sample and bulk density, and expressed in units of kg C∙m−2. Total SOC stock in the upper one metre was obtained as the sum of the SOC stock of the 5 depth intervals, as used by Chen et al. [4].
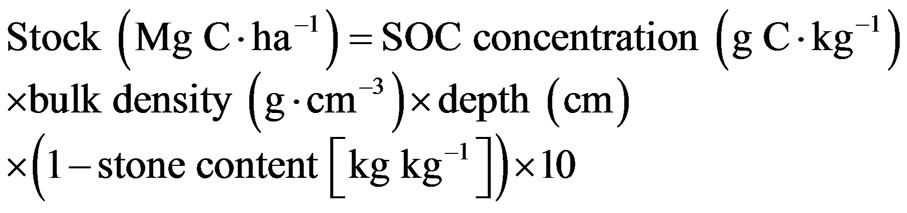 . (2)
. (2)
Soil organic-C stocks in the top 20 cm were calculated by summing SOC stocks in the 0 - 10 and 10 - 20 and those in the 100 cm by summing SOC stocks in the top 20 cm, 20 - 50, 50 - 80, and 80 - 100 cm depth intervals.
Soil samples for isotopic analysis were priory freezedried, and were crushed (<200 µm). Organic carbon content was measured by autoanalysor Carlo Erba NA 1500. The isotopic ratios were measured on CO2 obtained by oxidation at 850˚C in a quartz tube sealed in the presence of CuO. CO2 was analyzed on a mass spectrometer VG SIRA by collecting triple and double introduction. The natural abundances are expressed in units of d13C.
 (3)
(3)
The reference used is the International Pee Dee Belemnite (PDB) standard.
2.5. Statistics Analysis and Error Estimation
Statistical analyses were conducted using the SPSS software (version 10.0) for Windows. Non-parametric Pearson test and t-test at 5% level were performed to test differences between mean C content of each soil depth.
3. Results
3.1. Evaluation of the Leaves, Stems and Roots Biomass
The leaves, stems and roots biomass as well as the proportions of organic carbon per land use are summarized in Table 2. The total leaves, stems and roots biomass in Kaffrine is 4.7 Mg dry matter (dm) ha−1 for the seminatural savanna. Biomass was smaller under groundnut field (3.0 Mg dm∙ha−1).
The calculated rate of annual C refund was 0.42 Mg ha−1∙yr−1 in semi-natural savanna (Table 2) while the groundnut soil gained 0.01 Mg C∙ha−1∙yr−1.
3.2. Soil Characterization
The ferric Luvisols appear similar in terms of colour, pH and bulk density. The moist colour at near-surface layers varied from dull yellowish brown (10YR 4/3) to dark
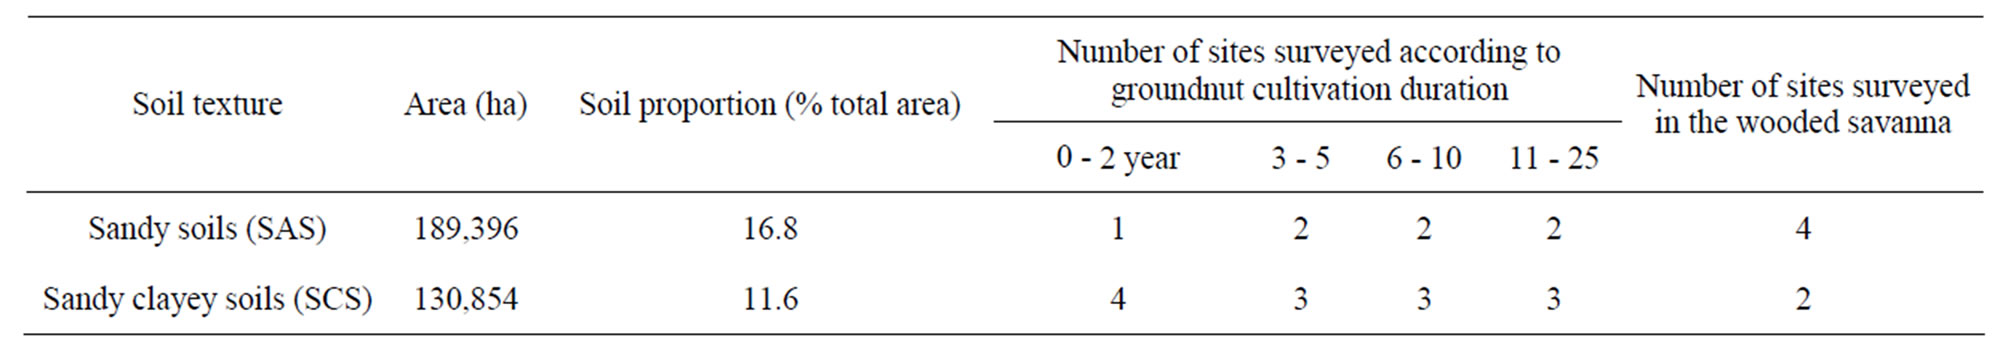
Table 1. Different sites surveyed in Kaffrine and surface area.
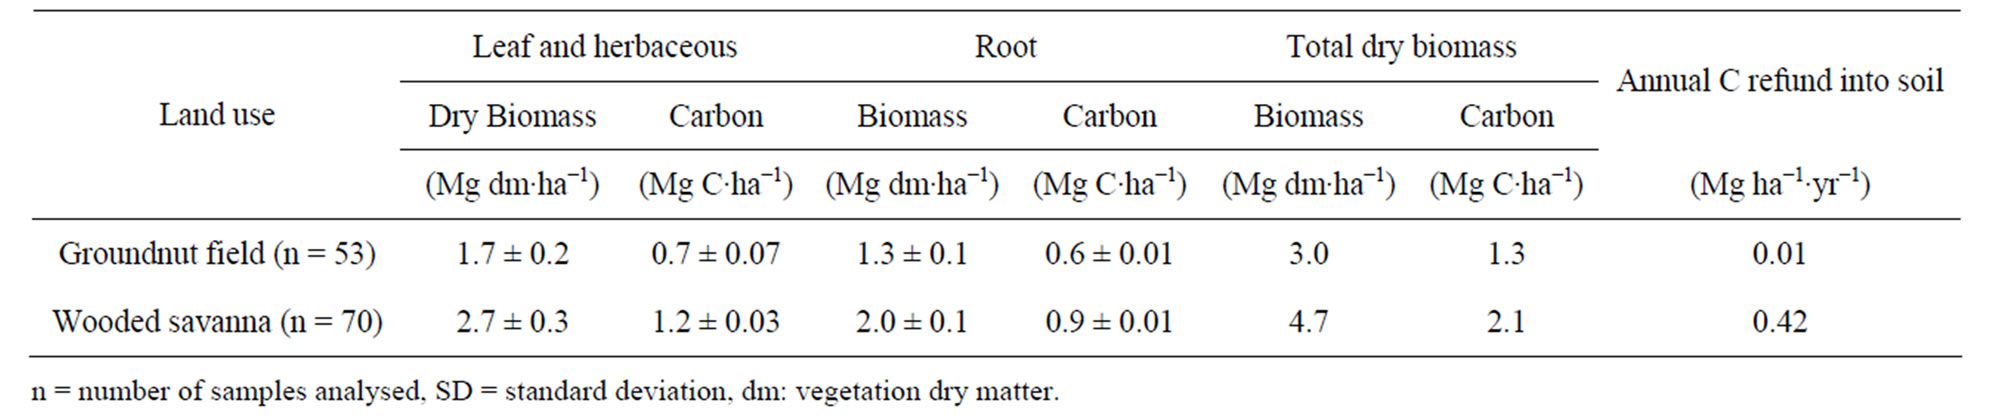
Table 2. Tree-leaves, stems and roots biomass in Kaffrine (mean ± SD).
brown (7.5YR 3/4), yellowish brown (10YR 5/8) to bright brown (7.5YR 5/8) at greater depths. The pH (water) values were 4.3 to 5.8 and increased with depth. Values of pH (KCl) were 0.1 to 0.2 pH units lower than pH (water). Bulk density ranged from 1.40 to 1.53 g∙cm−3.
Table 3 shows the particle-size distribution of the soils studied. The sandy soils (SAS) were slightly structured; near-surface concentrations of nitrogen and phosphorus were between 0.113 - 0.325 g∙kg−1 and 0.029 - 0.087 g∙kg−1, respectively. Those of sandy clayey soils (SCS) were between 0.162 - 0.429 g∙kg−1 and between 0.044 - 0.072 g∙kg−1 near the surface, respectively. At 20 - 100 cm depth, SCS soils had higher clay contents (18% - 35%) than SAS soils (11% - 15%). Statistical analyses of these results show that only the content of silt and silt + clay distinctly defined the two soil texture classes (<12 wt%-silt and <19-wt%-silt + clay for SAS). For the same ferric Luvisols, the sand proportion in 0 - 20 cm depth was evidently higher in groundnut fields than in seminatural savanna.
3.3. Soil Organic Carbon
Figure 1 shows the SOC distribution to 1 m depth, at the Kaffrine study site. The detailed distribution is shown in Tables 4 and 5. The semi-natural savanna soil contains 64 (±7 SD) Mg C∙ha−1 in sandy clayey soil, of which 20 Mg C∙ha−1 (31%) was located near the surface (0 - 20 cm), 31 (±3) and 11 Mg C∙ha−1 (35%) in 0 - 100 and 0 - 20 cm depths, respectively. The total C stock in 0 - 1 m depth in groundnut soil was about 40 (±5) and 20 (±2) Mg C∙ha−1 in the SCS and SAS, respectively. The SOC concentration and SOC stocks measured were higher under semi-natural savanna compared to the groundnut fields. T-test revealed that the differences between SOC means in Kaffrine are significant with land use parameter. This parameter shows significant (P < 0.05) mean-difference only in the <10 years cultivated soils (Figure 2(a)). For texture, the mean C content difference is statistically significant at the bottom of soil profiles (Figure 2(b)). The variation in C content is always smaller in SAS soils compared to SCS soils. For the same soil, the correlation coefficient (r) between organic carbon and particle-size were established as follows: carbon-clay (r = 0.62), carbon-silt and clay (r = 0.77).
SOC quality and origin were evaluated using the C/N ratio and δ13C values. The C/N ratio was smaller (1 - 3 units) in 0 - 20 cm depth for SAS than for SCS (Table 4). According to land use, the C/N ratio was not highly different, 0.1 - 0.4 units in 0 - 10 cm depth and 0.8 - 1.3 units in 10 - 20 cm depth. The tendency is reversed at greater depth and is more marked in cultivated soils (20 cm under culture and 50 cm under savanna). Figure 3 shows the δ13C of the soils studied. Within the top 20 cm depth, values of δ13C were between −20% and −25% in the cultivated sandy soil, and between −15% and −20% for all the other soils. Below 20 cm, values of δ13C approached between −17% and −18%. The isotopic ratio of the near-surface organic C was 6% smaller under groundnut fields than those of other soils, and close to the C3-plant δ13C values. Under semi-natural savanna, SOC is slightly impoverished in 13C at the bottom of the profile. At the upper levels, this organic matter shows a predominance of graminaceous C4-species, but some ligneous species were described on the site such as Guiera and Combretum.
4. Discussion
4.1. Carbon Stocks in Senegal’s Dryland Zone
Measured biomass represents the short-term source of soil carbon. Analysed total biomass ranged between 3 and 5 Mg dm∙ha−1. The mean C values were between 1.3 and 2.1 Mg C∙ha−1. Despite the fact that these contents do not include the carbon contained in wood that constitutes 8% to 9% of the total above-ground carbon in Delbi and Paniates forests near Kaffrine [20], 34% of total biomass in tropical Africa open forest and more for closed tropical forest [23], these contents are similar to those usually noted (2 and 4 Mg dm∙ha−1) in the degraded savanna of the West African semiarid region [11,24]. This vegetation contributes to 0.42 Mg C/ha/yr−1 of organic carbon refund into soil. These values are slightly high, considering the fact that in Eastern North American soils, after five years of afforestation, accumulation rates are between –0.85 and +0.58 Mg C∙ha−1∙yr−1 [25]. They can be

Figure 1. Soil organic C contents and vertical distribution in Sandy soils (SAS) and Sandy clayey soils (SCS), for the wooded savanna and groundnut field. Error bars represent ± one standard deviation.
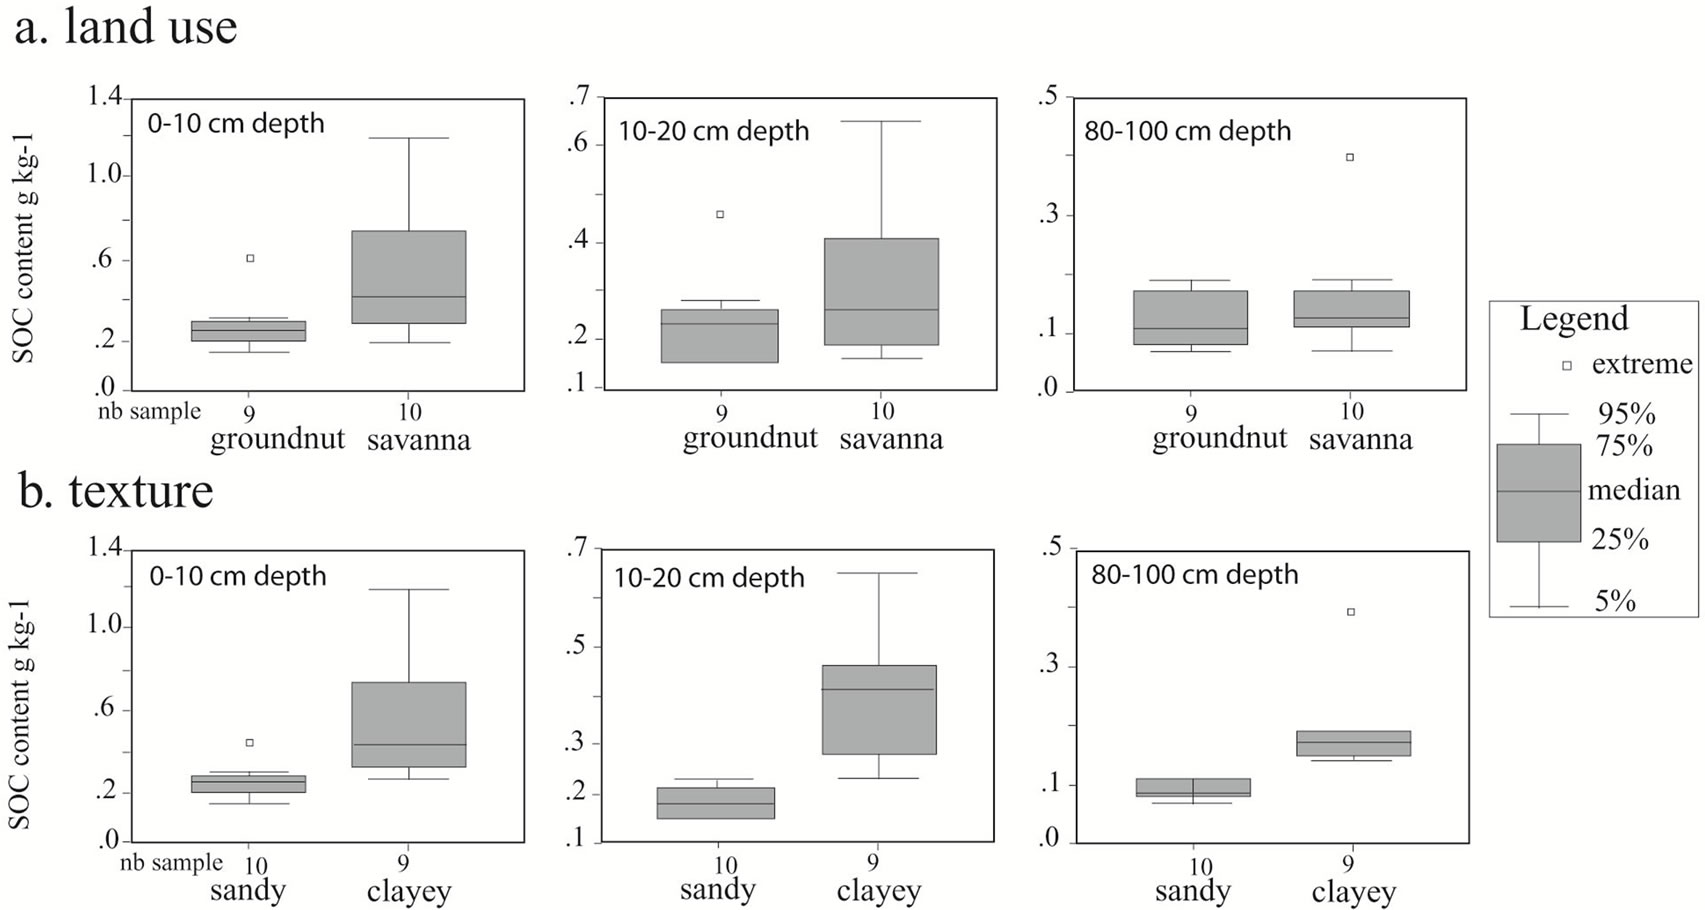
Figure 2. SOC content according to land use (a) and soil texture (b). From near-surface horizon (0 - 10 cm) to greater depth (80 - 100 cm), the SOC content is continuously more differentiated with texture so that intermediate horizons (not shown) presented intermediate situations. There is no significance with land use (savanna and up to 10 yr cultivation).
explained by abundant root-hairs in the West African region. The root biomass in Kaffrine was 2.0 Mg dm∙ha−1 which was lower than 5 - 10 Mg dm∙ha−1 and 2.5 - 5 Mg ha−1 reported by [11,24].
For a fire-protected and animal-free savanna in Senegal (500 mm mean annual precipitation), the herbaceous biomass was estimated to be 1.6 Mg dm∙ha−1 [26]. The low total biomass in Kaffrine is probably due to the degraded savanna after decades of human impact. With equal organic carbon input, these soils do not preserve the same organic carbon stocks with cultivation. Thus, the organic carbon input to semi-natural savanna soils is probably also affected by human activities. The average density of SOC published by Batjes [27] in the first 1 m of soil for West Africa was significant, about 42 - 45 Mg C∙ha−1. The level of SOC density obtained in Kaffrine is near the previous range (Table 5). Elberling et al. [14] found 3.2 and 2.7 kg C∙m−2 in the woodland savanna in Tiel and Dahra, far north of Kaffrine. In southern Senegal, Manlay [22] found 2.78 kg C∙m−2 in groundnut crops and 5.47 kg C∙m−2 in >10-years fallows. Our results are then correlated to those of sites situated far north or far
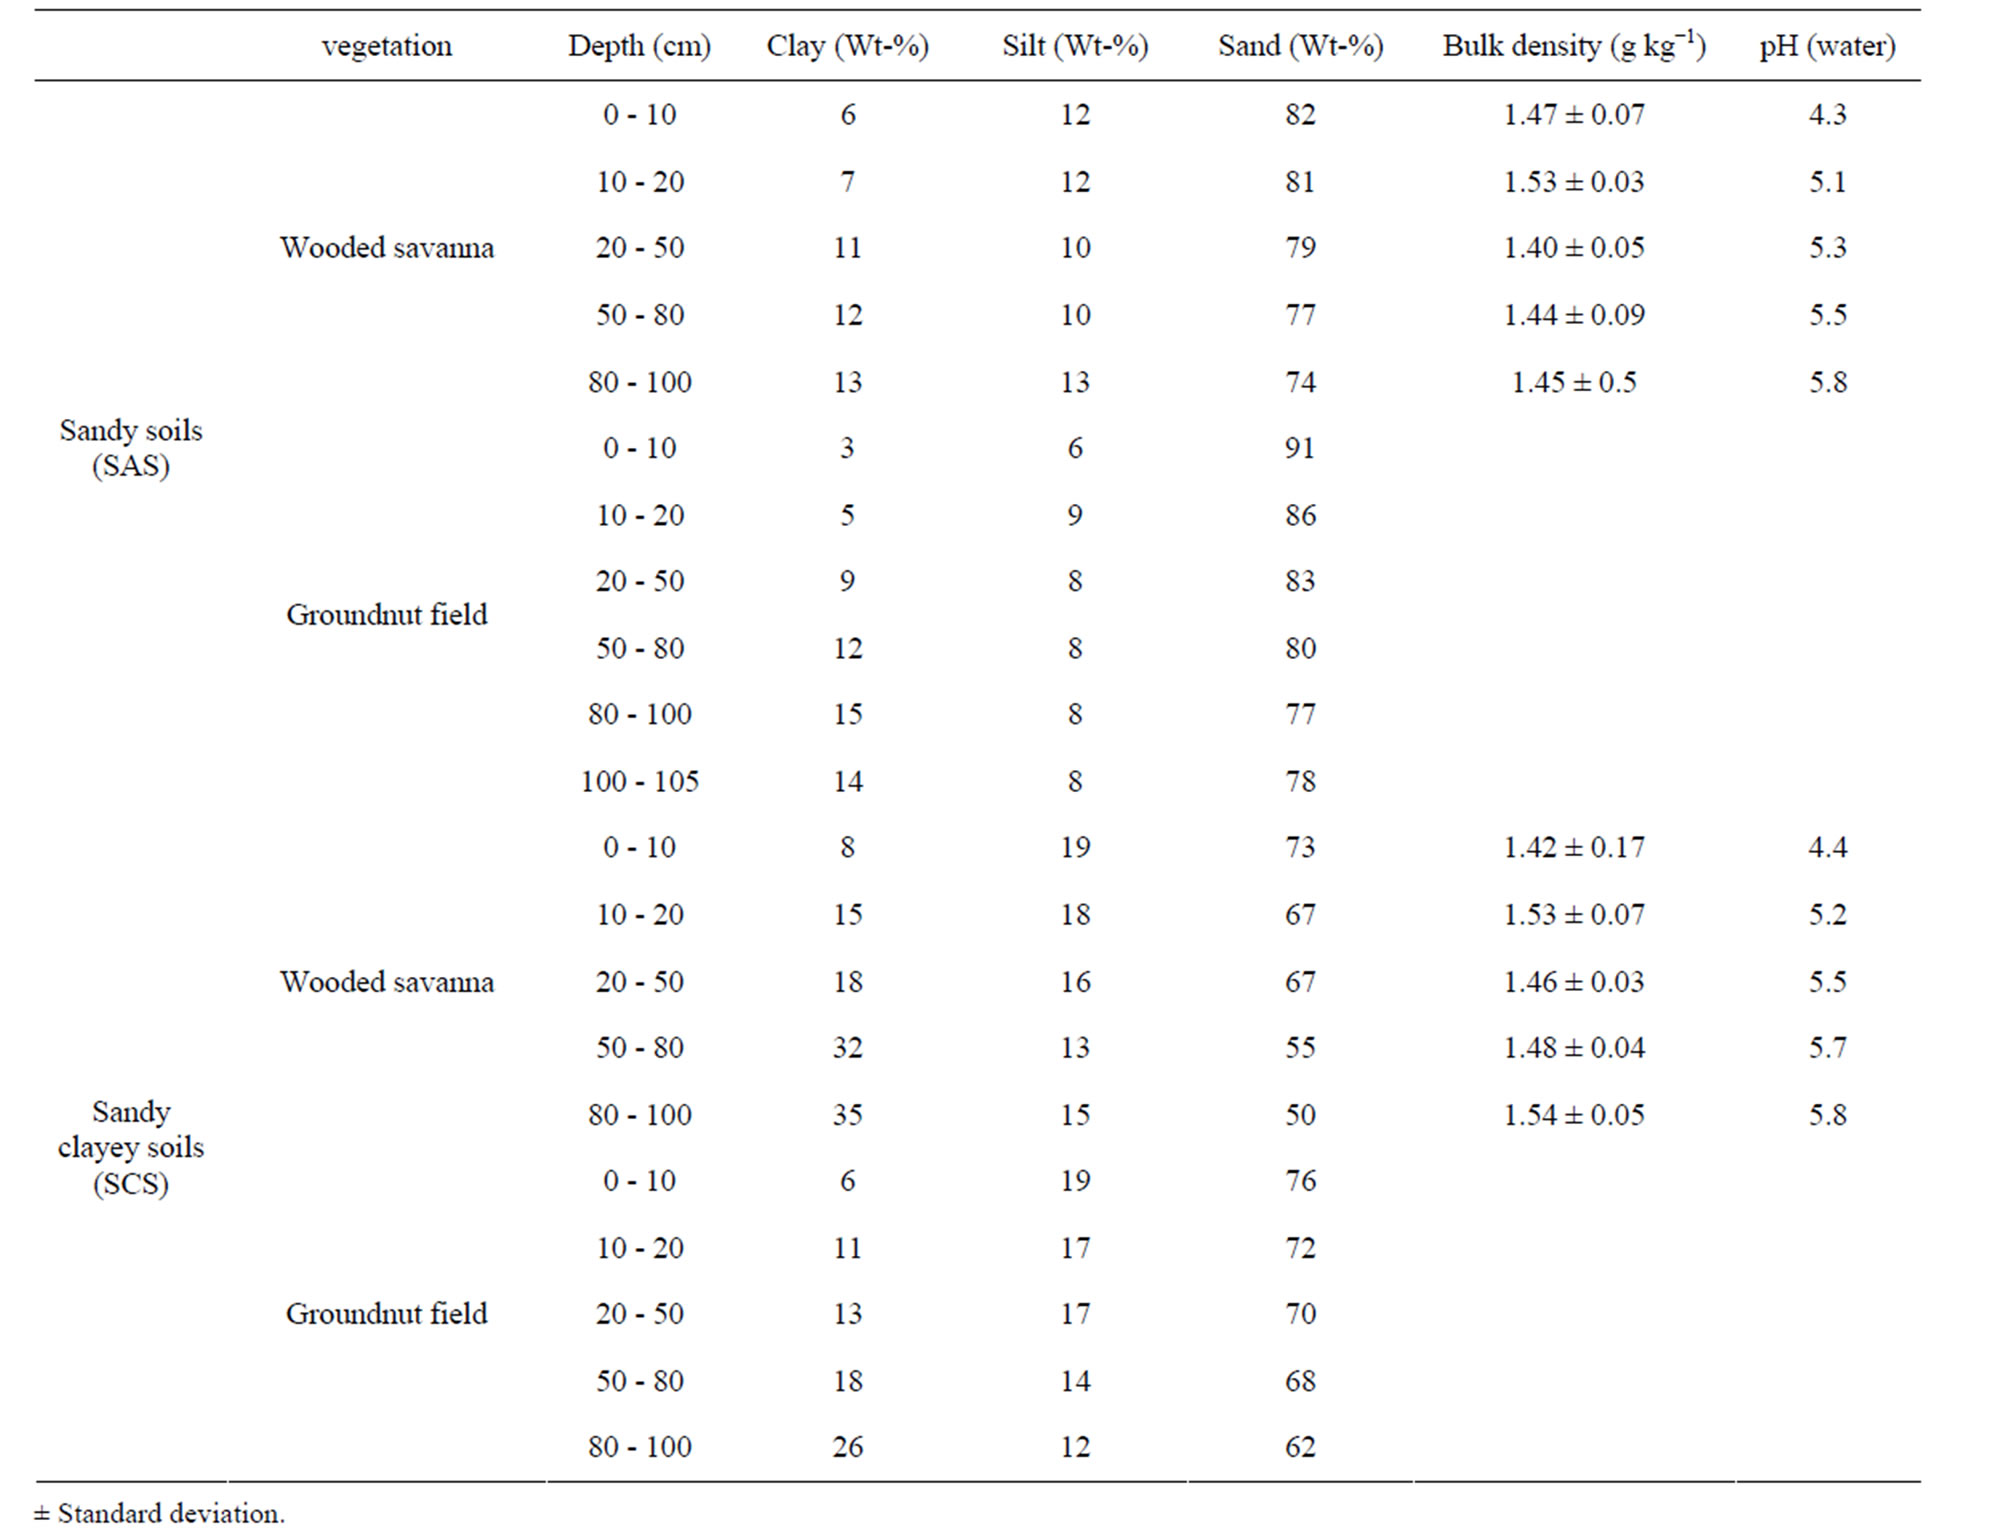
Table 3. Average particle-size analysis of soil in wooded savanna and groundnut field.
south of Kaffrine, related to a north-south climatic gradient across the region; indeed, C content decreases with decreasing precipitation towards the north [3,14]. Also, the average SOC density in West Africa is lower than the average found for the whole of Africa (64 - 67 Mg C∙ha−1) [27], mainly as a result of the less favourable agro-ecoogical conditions.
4.2. Land Use Effect on SOC Storage and Distribution
Crop cultivation led to a decrease in soil organic C content. This is noted for C input due to wood uprooting and for SOC. Compared to the semi-natural savanna, SOC storage in groundnut fields is approximately 27% - 35% less for the upper 20 cm depth. This reduction cannot be attributed to soil texture variation because the effect is noted on both SCS and SAS texture. Also, in West Africa, 50% to 70% of the soils are exploited with minimal carbon restitution [11]. Groundnut cropping is considered an extreme case in relation to soil C losses [28], particularly during the first years of cultivation [14]. This is related to the fact that groundnuts are harvested by pulling up the entire plants with roots to save as feed for livestock. The accompanying impoverishment of C would therefore be related to cultivation through increased decomposition of plant residue by soil mixing on the surface [6], decreasing of organic matter input, indicated in this study by biomass estimated.
4.3 Soil Texture Effect on SOC Storage and Distribution
For the Ferric Luvisols in the Kaffrine area, the two types of soil texture are basically not differentiated with the content of clay but with those of silt and silt + clay. Feller and Beare [3] obtained a correlation of carbon-clay to 0.86 in tropical ferruginous soil. These authors have shown from different sites in the tropics (West and Central Africa, Antilles, Brazil, south India) that clay (or clay
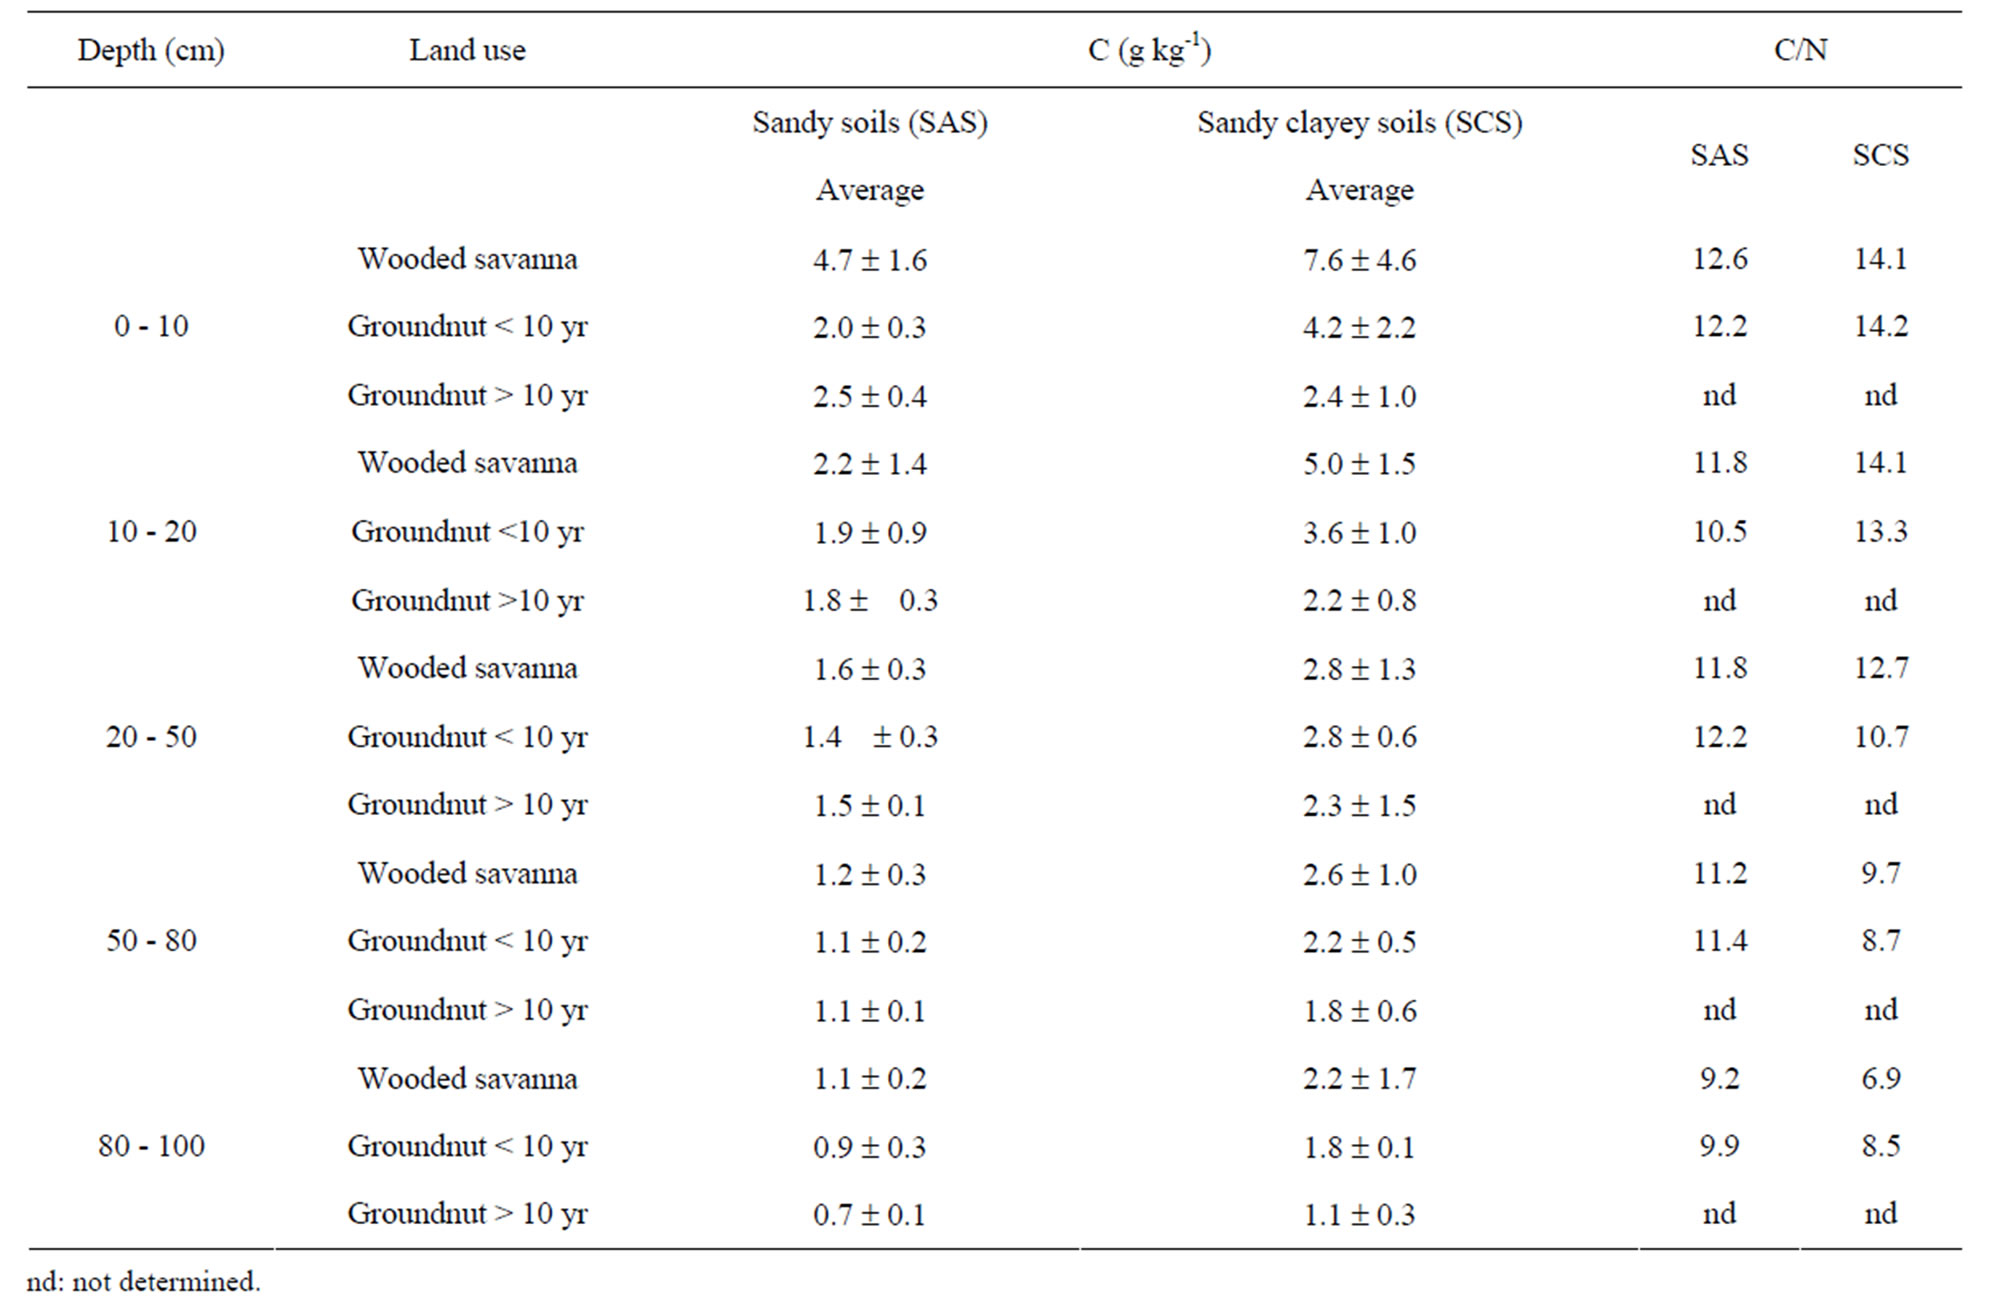
Table 4. Soil organic C content, C/N and vertical distribution in each soil and land use (mean ± SD).
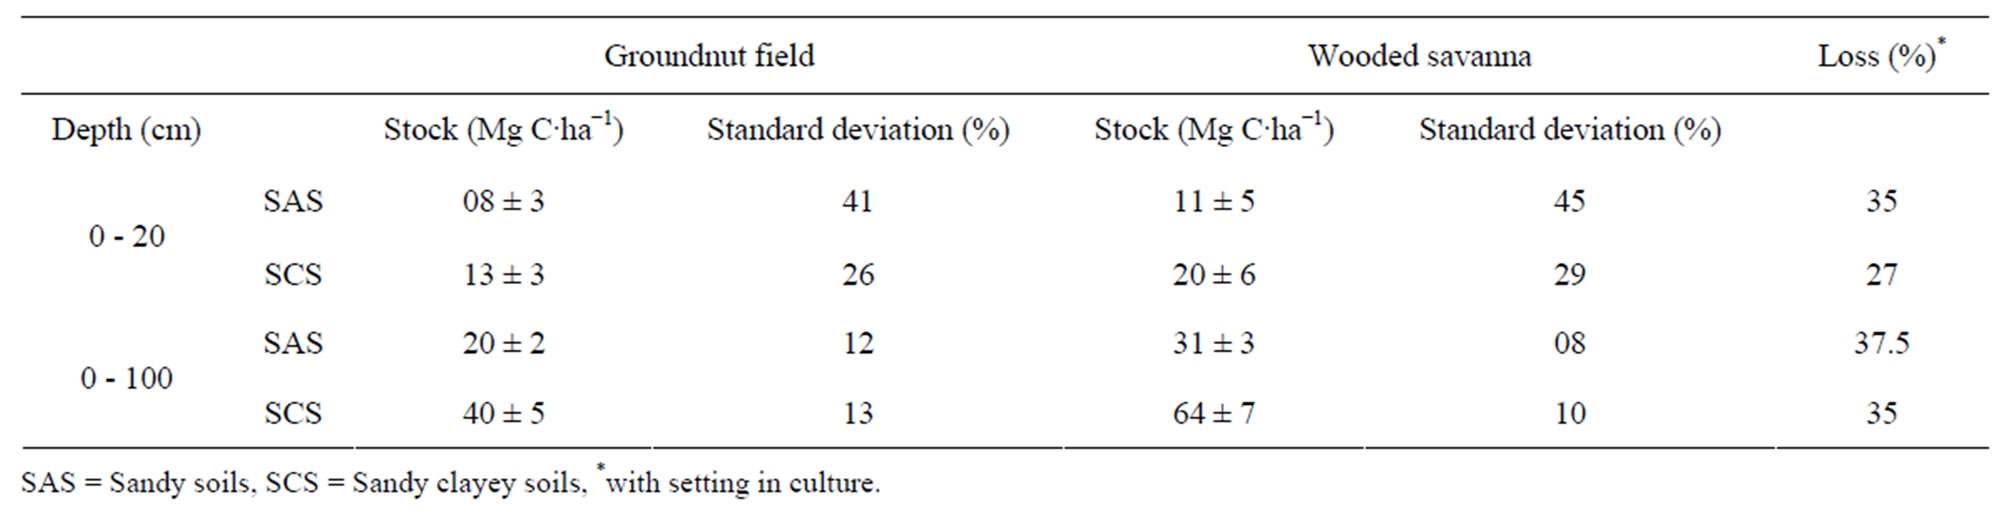
Table 5. Soil organic C stocks in 0 - 20 and 0 - 100 cm depth (mean ± SD).
+ silt) content is an important determinant of SOM levels in soils. The positive relationship (correlation coefficient) obtained in Kaffrine was 0.62 (and significant, P < 0.05). Significantly lower SOC stocks within the upper 20 cm were noted for soils with a low clay content compared to soils with higher clay content. Differentiation is more significant (P < 0.05) between the SOC content of SCS and that of SAS in semi-natural savanna and during the first 10 years of cultivation. The cultivation system used in the division of Kaffrine involves surface tillage. Feller and Beare [3] show that tillage provokes eluviation of fine particles, leading to a relative surface enrichment of sand.
On the other hand, under groundnut fields, SAS soils show more or less positive isotopic gradient from top to bottom. Groundnuts are cultivated in alternation with millet (C4-plant) but the cultivation of the latter is very occasional and seems not to reduce the progression of the SOC towards C3 of groundnut. The signature of the organic matter resulting from the savanna plants (C4/C3 mixed-pools) is preserved in the cultivated clayey soils, on the other hand kept developing to the signature of the C3-pools in the first 20 centimetres of the cultivated sandy soils. δ13C values of –19.8% and –18.0% are attributed to a strong contribution of C3-plants [29]. Significant depletion in δ13C occurring in near-surface SOC
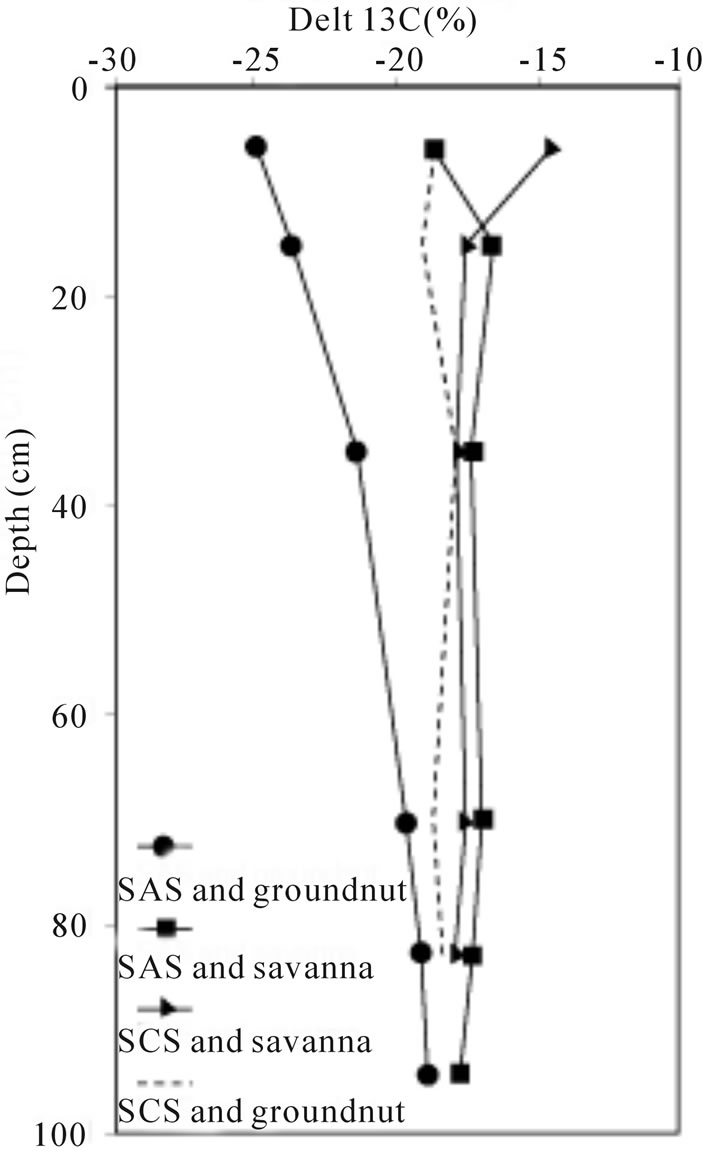
Figure 3. δ13C values of Sandy soils (SAS) and Sandy clayey soils (SCS) analysed in cultivated (up to 10 yr) and seminatural savanna soils.
with a shift towards greater C3 inputs has been reported in grazed mixed-grass prairies [29]. The question is whether the change is related to the organic quality or to the transformation by humification. The decomposition and humification of OM is done with only relatively weak isotopic fractionation (0% to +2% approximately, [5]). Six et al. [9] showed differences among soil fractions for a soil of up to 5.3% but the authors have also agreed a selective stabilization of residual plant-derived compounds in the fine-silt fraction. We can thus tie the disappearance of the delta 13C values of mixed-C4/C3 savanna plants to the fast incorporation of the organic matter in sandy soils (this remains recognizable below 20 cm of depth) and to its replacement by C3-groundnuts plants put in cultivation. Since the installation of the groundnut area “bassin arachidier” 40 years ago (year 1965), the near-surface δ13C value has increased by 6% towards the negative values of C3. That was not the case of the sandy clayey soils in which clay protects the organic matter. The fact that δ13C value converges with increasing depth indicates the actual soil volume responding to almost 40 years of cultivation. The role of clay fraction in SOC protection against decomposition has been outlined by many authors (e.g., [3,30]). For the groundnut field in Kaffrine, delta 13C (δ13C) values show that the signature of organic matter is more preserved in the clayey soils.
5. Conclusions
The results reveal that, in addition to management associated factors such as overgrazing and intensive farming, the impoverishment of carbon in West African soils may be attributed to soil cultivation and loss of fine texture by tillage. Average annual C refund is 0.1 - 0.2 Mg C∙ha−1, which is the usually proposed value for West Africa soils. The effect of land use is limited to the upper 20 cm depth while the texture effect is found all along the soil profile.
Texture influences the SOC stocks. In turn, cultivation influences the texture by deepening the particulate component; near-surface level becomes more particulate and advisable for organic matter mineralization. The SOC content was similar for all soils at 20 - 100 cm depth. Compared to the semi-natural savanna, SOC storage in groundnut fields is approximately 27% - 35% less for the upper 20 cm depth. However, it is very less in SAS compared to SCS. Also, SOC evolves from C4 toward groundnut C3 pool in the 0 - 20 cm depth of SAS.
For better C sequestration, practices should focus on the improvement of the fine textures stability and on the regeneration of the woody zones. However, in Senegal, extension of the woody zones or conversion into rangeland conflicts with the requirements for land for cultivation for ever-growing population. The most important factors to protect organic carbon are either natural conservative vegetation or the more clayey soils or both. Awareness of these variable soil parameters and farm residue restitution into the soil is important in order to enhance soil organic carbon sequestration, agricultural production without soil degradation and reduce emission of greenhouse gases.
6. Acknowledgements
The authors owe thanks to CSE staff for the assistance in the field: Dr. Magatte Bâ and M. Samba Ndao; to Isotope Laboratory of Biology Department, Augustana College, Soux Falls, South Dakota for 13C/12C analysis, and to Dr. Rokhaya Samba of “Direction des Mines et de la Géologie”-Senegal. Thanks to Dr TABI Fritz OBEN of FASADschang for his comments.
REFERENCES
- R. A. Houghton, “The Contemporary Carbon Cycle,” In: J. I. Drever, H. D. Holland and K. K. Turekian, Eds., Treatise on Geochemistry, Vol. 8. Biogeochemistry, Elsevier, Oxford, 2003, pp. 473-512.
- Y. Wang and Y. P. Hiesh, “Uncertainties and Novel Prospects in the Study of the Soil Carbon Dynamics,” Chemosphere, Vol. 49, No. 8, 2002, pp. 791-804. http://dx.doi.org/10.1016/S0045-6535(02)00381-8
- C. Feller and M. H. Beare, “Physical Control of Soil Organic Matter Dynamics in the Tropics,” Geoderma, Vol. 79, No. 1-4, 1997, pp. 69-116. http://dx.doi.org/10.1016/S0016-7061(97)00039-6
- H. Chen, S. Marhan, N. Billen and K. Stahr, “Soil Organic-Carbon and Total Nitrogen Stocks as Affected by Different Land Uses in Baden-Württemberg (Southwest Germany),” Journal of Plant Nutrition and Soil Science, Vol. 172, No. 1, 2009, pp. 32-42. http://dx.doi.org/10.1002/jpln.200700116
- T. W. Boutton, S. R. Archer, A. J. Midwood, S. F. Zitzer and R. Bol, “13C Values of Soil Organic Carbon and Their Use in Documenting Vegetation Change in a Subtropical Savannah Ecosystem,” Geoderma, Vol. 82, No. 1-3, 1998, pp. 5-41. http://dx.doi.org/10.1016/S0016-7061(97)00095-5
- J. Balesdent, E. Besnard, D. Arrouays and C. Chenu, “The Dynamics of Carbon in Particle-size Fractions of Soil in a Forest-cultivation Sequence,” Plant Soil, Vol. 201, No. 1, 1998, pp. 49-57. http://dx.doi.org/10.1023/A:1004337314970
- S. C. Clifford, I. M. Stronach, A. D. Mohamed, S. N. Azam-Ali and N. M. J. Crout, “The Effects of Elevated Atmospheric Carbon Dioxide and Water Stress on Light Interception, Dry Matter Production and Yield in Stands of Groundnut (Arachis hypogaea L.),” Journal of Experimental Botany, Vol. 44, No. 12, 1993, pp. 1763-1770. http://dx.doi.org/10.1093/jxb/44.12.1763
- J. D. Tenhunen, L. C. Tenhunen, H. Ziegler, W. Stichler and O. L. Lange, “Variation in Carbon Isotope Ratios of Euphorbia Species from Different Habitats of Teneriffe in Spring,” Flora, Vol. 173, No. 5-6, 1983, pp. 363-370.
- J. Six, R. Merckx, K. Kimpe, K. Paustian and E. T. Elliott, “A Re-Evaluation of the Enriched Labile Soil Organic Matter Fraction,” European Journal of Soil Science, Vol. 51, No. 2, 2000, pp. 283-293. http://dx.doi.org/10.1046/j.1365-2389.2000.00304.x
- P. A. Sanchez and T. J. Logan, “Myths and Science about the Chemistry and Fertility of Soils in the Tropics,” In: R. Lal and P. A. Sanchez, Eds., Myths and Science of Soils of the Tropics, Soil Science Society of America, Madison, 1992, pp. 35-46.
- H. Tiessen, C. Feller, E. V. S. B. Sampaio and P. Garin, “Carbon Sequestration and Turnover in Semiarid Savannahs and Dry Forest,” Climatic Change, Vol. 40, No. 1, 1998, pp. 105-117. http://dx.doi.org/10.1023/A:1005342932178
- L. L. Tieszen, G. G. Tappan and A. Touré, “Sequestration of Carbon in Soil Organic Matter in Senegal: An Overview,” Journal of Arid Environments, Vol. 59, No. 3, 2004, pp. 409-425. http://dx.doi.org/10.1016/j.jaridenv.2004.04.002
- S. A. Alam, M. Starr and B. J. F. Clark, “Tree Biomass and Soil Organic Carbon Densities across the Sudanese Woodland savannah: A Regional Carbon Sequestration Study,” Journal of Arid Environments, Vol. 89, 2013, pp. 67-76. http://dx.doi.org/10.1016/j.jaridenv.2012.10.002
- B. Elberling, A. Touré and K. Rasmussen, “Changes in Soil Organic Matter Quantity and Quality Following Groundnut-Millet Cropping at three Locations in Semi-Arid Senegal, West Africa,” Agriculture, Ecosystems & Environment, Vol. 96, No. 1-3, 2003, pp. 37-47. http://dx.doi.org/10.1016/S0167-8809(03)00010-0
- R. Fauck, “Contribution à l'Etude des Sols des Régions Tropicales-Les Sols Rouges sur Sables et sur Grès d'Afrique Occidentale,” Ph.D. Thesis, Sciences Naturelles, Université de Strasbourg. 1971, 377p.
- P. Cattan, P. Letourmy, B. Zagre, A. Minougou and E. Compaoré, “Rendement de l'Arachide et du Sorgho en Rotation sous Différents Itinéraires Techniques au Burkina Faso,” Cah. études recher. Franco./Agricultures, Vol. 10, No. 3, 2001, pp. 159-172.
- FAO, “World Reference Base for Soil Resources,” World Soil Resources Reports, Vol. 84, Food and Agriculture Organization, Rome, 1998, 98p.
- A. Toure, “Contribution à l’Etude de l’Evolution des Réservoirs de Carbone en Zone Nord-Soudanienne au Sénégal,” Ph.D. Thesis, no. 2585, EPF Lausanne, Switzerland, 2002
- M. I. Cissé, “The Browse Production of Some Trees of the Sahel: Relationships between Maximum Foliage Biomass and Various Physical Parameters,” In: Le Houérou, Ed., Browse in Africa, The Current State of Knowledge, International Symposium on Browse in Africa, Addis Ababa, 8-12 April 1980, pp. 205-210.
- A. Touré, K. Rasmussen, O. Diallo and A. Diouf, “Actual and Potential Carbon Stocks in the North-Sudanian Zone. Case Study: The Forest of Delbi and Paniates in Senegal,” Danish Journal of Geography, Vol. 103, No. 1, 2003, pp. 63-70.
- E. Roose, “L'Effet du Couvert Végétal,” In: Introduction à la Gestion Conservatoire de l'Eau, de la Biomasse et de la Fertilité des Sols (GCES), Service des Sols-Ressources, Aménagement et Conservation, Division de la Mise en Valeur des Terres et des Eaux,” Bulletin Pédologique FAO, Vol. 70, 1994, 420p.
- R. Manlay, “Organic Matter Dynamics in Mixed-Farming Systems of the West African Savannah: A Village Case Study from South Senegal,” Ph.D. Thesis, IRD Centre, Montpellier, 2000, 192p.
- S. Brown and A. E. Lugo, “Biomass of Tropical Forests: A New Estimate based on Forest Volumes,” Science, Vol. 223, No. 4642, 1984, pp. 1290-1293. http://dx.doi.org/10.1126/science.223.4642.1290
- J. César and Z. Coulibaly, “Conséquence de l’Accroissement Démographique sur la Qualité de la Jachère dans le Nord de la Côte d’Ivoire,” In: C. Floret and G. Serpantié, Eds., La Jachère en Afrique de l’Ouest, Atelier International, Montpellier, 2-5 December 1991.
- E. A. Paul, S. J. Morris, J. Six, K. Paustian and E. G. Gregorich, “Interpretation of Soil Carbon and Nitrogen Dynamics in Agricultural and Afforested Soils,” Soil Science Society of America Journal, Vol. 67, No. 5, 2003, pp. 1620-1628. http://dx.doi.org/10.2136/sssaj2003.1620
- F. Bernhart-Reverst, “Le Recyclage des Eléments Miné- raux par la Strate Herbacée dans un Peuplement Naturel à Acacia et dans une Plantation d’Eucalyptus au Sénégal,” Acta Oecologica Oecol. Gener, Vol. 7, 1986, pp. 353- 364.
- N. H. Batjes, “Options for Increasing Carbon Sequestration in West Africa Soils: an Exploration Study with Special Focus on Senegal,” Land Degradation & Development, Vol. 12, No. 2, 2001, pp. 131-142. http://dx.doi.org/10.1002/ldr.444
- R. Lal and J. M. Kimble, “Tropical Ecosystems and the Global C Cycle,” In: R. Lal, J. M. Kimble and B. A. Stewart, Eds., Global Climate Change and Tropical Ecosystems, Advances in Soil Sciences, CRC Press, New York, 2000, pp. 3-32.
- D. C. Henderson, B. H. Ellert and M. A. Naeth, “Utility of 13C for Ecosystem Carbon Turnover Estimation in Grazed Mixed Grass Prairie,” Geoderma, Vol. 119, No. 3-4, 2004, pp. 219-231. http://dx.doi.org/10.1016/j.geoderma.2003.08.001
- J. Hassink, L. A. Bouwman, K. B. Zwart, J. Bloem and L. Brussaard, “Relationships between Soil Texture, Physical Protection of Organic Matter, Soil Biota, and C and N Mineralization in Grassland Soil,” Geoderma, Vol. 57, No. 1-2, 1993, pp. 105-128. http://dx.doi.org/10.1016/0016-7061(93)90150-J
NOTES
*Corresponding author.