Open Journal of Soil Science
Vol.3 No.2(2013), Article ID:30926,10 pages DOI:10.4236/ojss.2013.32008
Grain Size Analysis of a Growing Sand Bar at Sonadia Island, Bangladesh
![]()
Institute of Marine Sciences and Fisheries, University of Chittagong, Chittagong, Bangladesh.
Email: *enamul_imsf@cu.ac.bd
Q
Copyright © 2013 Md. Enamul Hoque et al. This is an open access article distributed under the Creative Commons Attribution License, which permits unrestricted use, distribution, and reproduction in any medium, provided the original work is properly cited.
Received February 4th, 2013; revised March 7th, 2013, accepted March 21st, 2013
Keywords: Grain Size Analysis; Sonadia; Sand Bar; Sediment; Bay of Bengal
ABSTRACT
Sonadia is one of the most important islands of Bangladesh. South-eastern shore of the island, which is a growing sand bar, has to encounter continuous and rapid morphological changes. So study of the sediment characteristics of this Sand Bar is very important. In the present study, grain size analysis of this Sand Bar has been done on the basis of laboratory analysis. Sediment samples were collected from 9 (Nine) stations and texture analysis of sediment was completed following a standard procedure of sieve analysis of sand samples. The average value of median (MD), mean (M), standard deviation (s), skewness (SK) and kurtosis (K) of sediment of the Sand Bar of Sonadia Island was 1.93, 1.87, 0.44, 0.11 and 1.88 respectively. Highest median, mean, standard deviation, skewness and kurtosis of Sand Bar of Sonadia Island was 2.98 (Station 2, Lower Shore), 2.68 (Station 1, Lower Shore), 0.83 (Station 1, Middle Shore and Station 2, Lower Shore), 0.65 (Station 2, Lower Shore) and 3.59 (Station 1, Lower Shore) respectively. Lowest median, mean, standard deviation, skewness and kurtosis of Sand Bar of Sonadia Island was 1.42 (Station 9, Middle Shore), 1.45 (Station 9, Middle Shore), 0.30 (Station 5, Lower Shore and Station 8, Lower Shore), 0.04 (Station 5, Upper Shore) and 0.94 (Station 6, Upper Shore) respectively.
1. Introduction
Bangladesh is considered as the largest deltaic plain of the world of three mighty rivers, namely the Ganges, the Brahmaputra and the Meghna commonly known together as GBM. Along with GBM, the major river systems in Bangladesh are mainly originated from the Himalayas which are situated in the north to the Bengal delta. This is mainly due to denudation of the Himalayas resulted in the formation of the world’s largest delta which is still active at a rate of about 70 cm per one thousand years [1,2]. Besides, GBM carries a total of about 2.4 billion tons of sediments per year [3] into the Bay of Bengal. These sediments interact with dynamic process in the Bay of Bengal leading to coastal geomorphological changes [4]. The constant recycling of sediments and the annual additions from monsoon floods produce complex pattern of erosion and accretion. A huge amount of sediments are also thought to be carried by under currents into the deeper Bay of Bengal and the Indian Ocean. The bottom topography of the Bay of Bengal plays a dominant role in the dynamic processes in the North Bay and Bangladesh coast which results in frequent geomorphological changes in the adjacent coast and islands [5,6].
Moheshkhali is a near-shore island of Bangladesh. It is located on the north-western side of Cox’s Bazar [7]. Sonadia Island (Shown in Figure 1) is not an actual island as it is not separately isolated from the main land; rather it is an extended part of Moheshkhali Island. Some khals (canals) and ditches separate it from Moheshkhali Island. Though Moheshkhali Island is little far from the active delta formation region, it still receives a lot of sediment and undergoes coastal process which helps reshape the morphology of the island’s coast, especially the south and south-eastern part including Sonadia Island. Changes are apparent in the south-eastern coastline of Sonadia Island, which thus gets the characteristics of a sandbar. In Sonadia Island Sandy beach and Shoals units may seen. Shoals, particularly on the west and south-east, are the submarine areas which remain under shallow
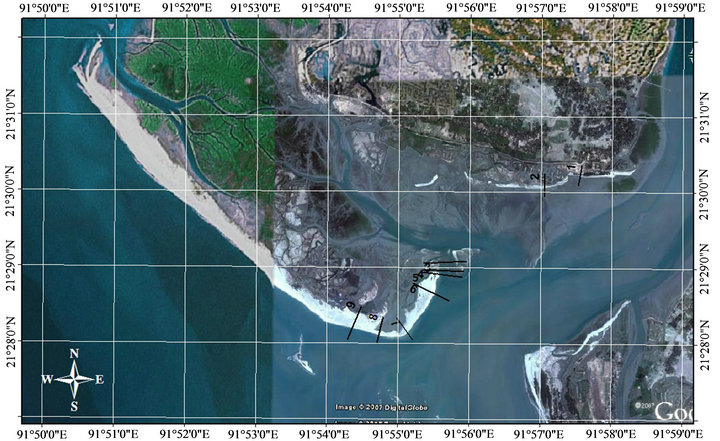
Figure 1. Map showing study area and the transect locations for sampling (Source: The QuickBird browse image, the Goggle Earth application interface, 2006).
water and surface at extreme low tides. Sediment of these shoals are mainly coarse, textured, pH value is 7 and organic content is very low [8]. So study of the Sand Bar is very crucial one.
The study was done with a view to analyze the grain size of the Sand Bar of Sonadia Island.
2. Materials and Methods
2.1. Sediment Sample Collection
Before going to the field, 9 (Nine) sample stations were selected (Shown in Figure 1) and their respective GPS were stored in the portable GPS (Garmin eTrex, 12 Channel). The stations were selected randomly at an interval between 1 to 5 km except Stations 1 and 2. Stations 1 and 2 are not situated in the Sand Bar rather in the South-eastern part of the main Moheskhali Island which are close but separated from the Sand Bar by a canal. Then three samples from upper, middle and lower shore of each station were collected as single point sampling. As the sediment was loose and unconsolidated, samples from the upper 15 cm were collected using a plastic scoop and taken in a polythene bag.
2.2. Laboratory Analysis
Grain size analysis of sediment was completed in the laboratory following a standard procedure for sieve analysis of sand samples [9]. Before grain size analysis previously prepared sediment sample were kept in a woven dryer for 24 hours at 105˚C temperature and then cooled in room temperature. 100 gm of processed sediment were taken and standard procedure for sieve analysis of sand by Cheel (2005) was followed for determining the size distribution of particles in unconsolidated sediment by passing them through stacks of nested sieves with square openings of known as diameter. The name of the used sieve shaker Eijkelkamp made in German.
2.3. Grain Size Analysis
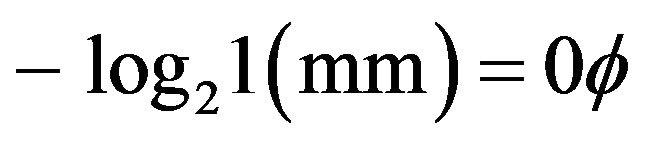
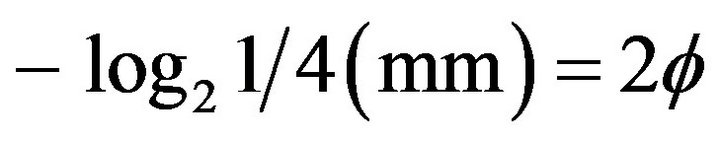
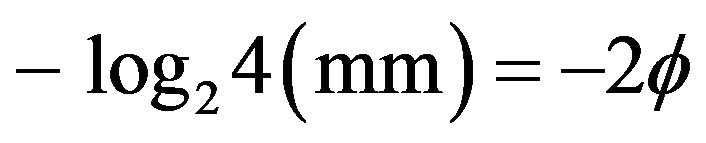
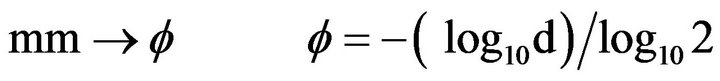
For determining grain size distribution the Udden-Wentworth Grade Scale was used in this study. Krumbein (1934) [10] introduced a logarithmic transformation of the scale which converts the boundaries between grades to whole numbers was also used later. This scale is known as the Phi Scale, its values being denoted by the Greek letter phi (f), where:

where d (mm) is just the grain size expressed in millimeters. For example:
f was later redefined:

where d is the size in millimeters and d0 is a standard size of 1 mm; division by 1 mm does not alter the value of f but makes it dimensionless. With a hand calculator the conversion from f to mm and from mm to f is as follows:

Note that it is traditional among sedimentologists to plot grain size on a phi scale with decreasing grain size to the right as shown in Figure 2.
2.4. Statistical Parameters of Grain Size Distribution
In the present study cumulative frequency curves (also, smooth curves) were drawn manually from cumulative weight of sediment and phi (f) units using graph papers. Phi units (f5, f16, f25, f50, f75, f84 and f95) were determined manually from smooth curves. Then the Median (Md), Mean (M), Standard Deviation (s), Skewness (SK), Kurtosis (K) of each sediment sample were calculated by Graphic Method [11] using the following formulae:

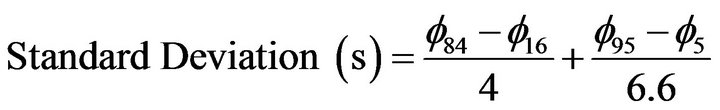
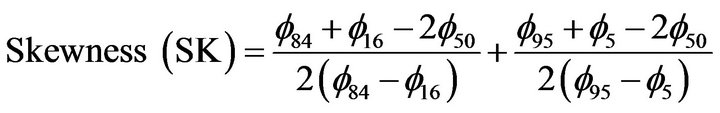
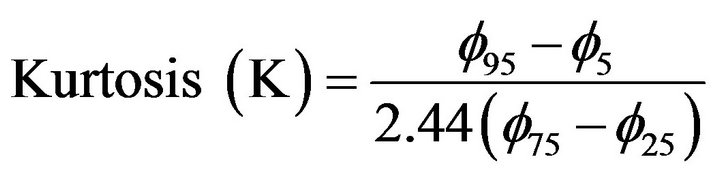

Figure 2. Conventional phi scale showing grain size increasing to the left and decreasing to the right.
3. Results and Discussion
3.1. Grain Size Distribution
The percentage of sediment weight at upper shore of Station 1 were 0.05, 0.11, 19.07, 70.27, 7.94 and 2.56% and at middle shore of Station 1, those values were 0.00, 8.52, 29.87, 28.10, 29.15 and 4.36%, while at lower shore of Station 1, they were 0.00, 2.86, 16.44, 6.57, 49.87 and 24.26% at 1 mm, 0.05 mm, 0.25 mm, 0.125 mm, 0.09 mm and 0.063 mm dia size of sieve respectively. There percentages of sediment in other stations were shown in Table 1.
The cumulative value of weight of sediment at different phi units from upper, middle and lower shore of the nine stations was given in Table 2. From cumulative value of weight of sediment cumulative curve were drawn (Figures 3-5) from which values of phi (f) units at f5, f16, f25, f50, f75, f84 and f95 from every upper, middle and lower zone of the 9 stations was calculated and given in Table 3, while the values of Median (Md), Mean (M), Standard Deviation (s), Skewness (SK) and Kurtosis (K) of sediment samples from every upper, middle and lower shore of the 9 stations were calculated by Graphic Method [11] and given in Table 4. Phi unit f5, f16, f25, f50, f75, f84 and f95 indicate 5th, 16th, 25th, 50th, 75th, 84th and 95th percentile of grain size distribution respectively in phi units [12].
3.2. Statistical Parameters of Grain Size Distribution
3.2.1. The Median
The Median (Md) is the midpoint of the sediment distribution. Median (Md) 2.25, 2.68 and 2.74 was found at upper, middle and lower shore respectively at Station 1. While at Station 2 the values of Median (Md) are 1.76, 1.88 and 2.98 was found at upper, middle and lower shore respectively. The values of Median (Md) at upper, middle and lower shore of 9 stations are shown at Table 4. The average value of Median of Station 1 and Station 2 is 2.38 while the average value of Median of rest of the stations is 1.81.
From the values of Median, it is clear that 50% of the sediment is finer and fineness of sediment increases towards lower region of the shore at Station 1 and Station 2. In other word, coarse sediment is available at the upper portion of the shore. While in the active Sand Bar region (Station 3 to Station 9) 50% of the sediment is coarser where middle shore possesses coarser sediment than upper and lower shore, while upper shore possesses finest sediment than the other two shores. Here, fineness of sediment increases towards upper region. This is obvious as the Sand Bar region undergoes continuous geo-morphological changes due to active action of wave and tide
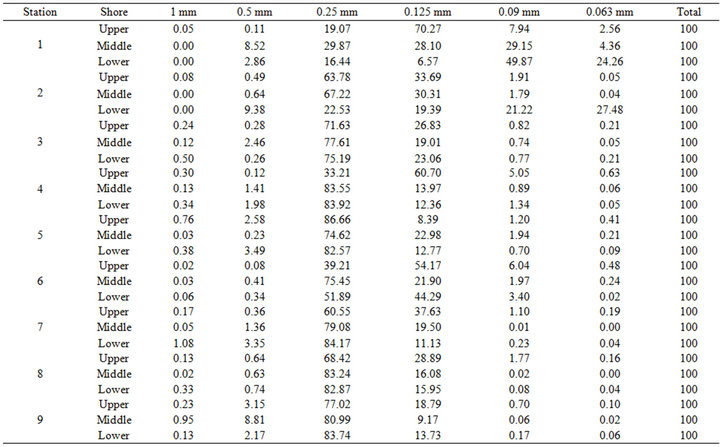
Table 1. Weight (in gram) of sediment at different sieve size from every upper, middle and lower shore of the nine stations.

Table 2. Cumulative value of weight of sediment at different phi (f) units from every upper, middle and lower shore of the nine stations.
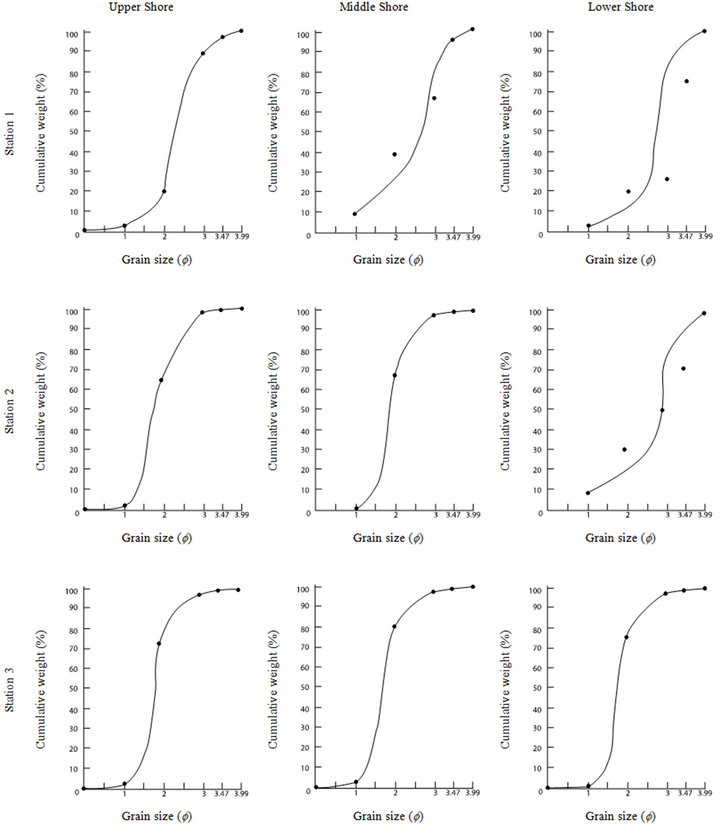
Figure 3. Cumulative frequency curve of sediment weight of Upper, Middle and Lower Shore at Station 1, Station 2 and Station 3.
and the region is surrounded by water with heavy suspended load of sediment [13].
3.2.2. The Mean (M)
The Mean (M) is the arithmetic average size of the distribution and for perfectly symmetrical normal distributions the mean is equal to the median. The Mean (M) value 2.23, 2.15 and 2.65 was found at upper, middle and lower shore respectively at Station 1. In Table 4 the values of Mean (M) of the sediment distribution the Sand

Figure 4. Cumulative frequency curve of sediment weight of Upper, Middle and Lower Shore at Station 4, Station 5 and Station 6.
Bar of Sonadia Island are given.
The average of Mean (M) or the arithmetic average size of the distributions of Stations 1 and 2 is 2.19, while the average of Mean (M) of Station 3 to Station 9 is 1.77 indicate that they are not very equal to the Median (Md) thus the sediment distribution is not perfectly symmetrical normal.
3.2.3. The Standard Deviation (s)
The Standard Deviation (s) of the distribution reflects the variation in grain sizes that make up the sediment. Standard deviation 0.56, 0.83 and 0.50 was found at upper, middle and lower shore at Station 1. The values of Standard Deviation (s) at upper, middle and lower shore of 9 stations are shown at Table 4. The average value of
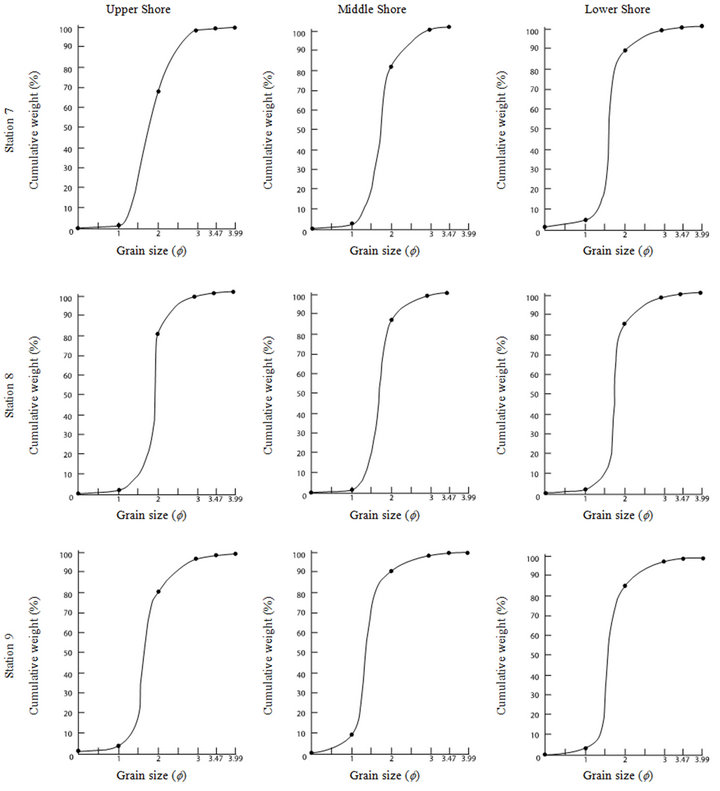
Figure 5. Cumulative frequency curve of sediment weight of Upper, Middle and Lower Shore at Station 7, Station 8 and Station 9.
Standard Deviation (s) of Station 1 and Station 2 is 0.60 while the average value of Standard Deviation (s) of Station 3 to Station 9 is 0.39.
From the average value of Standard Deviation (s) at Stations 1 and 2, it indicates that sediment is moderately well sorted throughout the region. More precisely, in the upper and lower shore sediments are almost well sorted while in middle shore sediment is moderately sorted. But in case of Sand Bar region sediments are very well sorted with an average of Standard Deviation (s) of 0.39 values.
3.2.4. The Skewness (SK)
The Skewness (SK) is a measure of the symmetry of the grain size distribution. The values of skewness found at
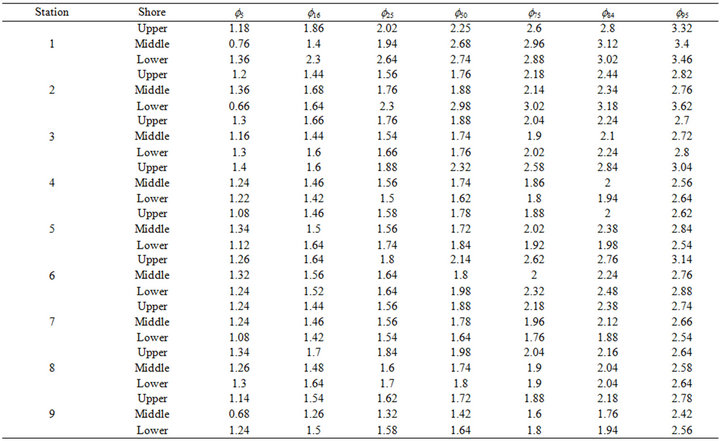
Table 3. Values of phi(f) units at f5, f16, f25, f50, f75, f84 and f95 from every upper, middle and lower shore of the nine stations.

Table 4. Median (Md), Mean (M), Standard Deviation (s), Skewness (SK) and Kurtosis (K) of sediment samples from every upper, middle and lower shore of the nine stations.
Station 1 was 0.09, −0.47 and −0.27 in the upper, middle and lower shore respectively. The values of Skewness (SK) in other sampling location are given in Table 4. The founded average value of Skewness (SK) of Stations 1 and 2 is −0.11 and of Station 3 to Station 9 is 0.17.
From the average value of Skewness (SK) found at Stations 1 and 2 we can say that sediment distribution in the Stations 1 and 2 is nearly symmetrical. More precisely sediment distribution in the upper shore has a larger proportion of fine grains, while middle and lower shore are enriched in coarse grains. On the other hand, sediment distribution in upper shore is near symmetrical, while sediment distribution in middle and lower shore are strongly coarse skewed and coarse skewed respectively. In a contrast the average value of Skewness (SK) in Station 3 to Station 9 is 0.17 indicates that sediment in the Sand Bar region has a fine skewed distribution with larger proportion with coarse grain sediment.
3.2.5. The Kurtosis (K)
The Kurtosis (K) is a measure of peakedness of the distribution. The values of kurtosis (K) found at Station 1 was 1.51, 1.06 and 3.59 in upper, middle and lower shore respectively. Table 4 shows other values of the Kurtosis (K) found in the study. The average value of the Kurtosis (K) of Stations 1 and 2 is 1.74 while the average of rest of the stations is 1.94.
The average value of Kurtosis (K) found at Station 3 to Station 9 was 1.94 which indicates that sediment in the Sand Bar region have sharp-peakedness or leptokurtic distribution. Similar peakedness i.e. sharp or leptokurtic distribution of sediment was also seen at Stations 1 and 2.
4. Conclusion
Grain size distribution of sediment is a fundamental property of sediment. It influences other fundamental properties of sediment. Historically it was hoped that ancient depositional environments could be determined on the basis of grain size and grain size distributions of sediments. Sand Bar is a region of active geo-morphological changes especially by erosion and deposition. Sand Bar in the coastal area is an important feature to study. We have records of these changes covering about two hundred years, but they are mostly scanty, and not continuous. Records of study on coastal geomorphological changes in Bangladesh are not adequate. Study on the physical forcing which results in such geomorphological changes is meager. The hydraulics of tidal area is also very complicated. There is a need of studying the littoral drift along the coast together with the hydrodynamics of tides, waves, winds and currents in the Bay of Bengal and its various channels. The upland sediment movement and flow of the sediment inland during high tide need in-depth study to understand the phenomenon in its fuller details. There is also a need for regular field measurements and monitoring of all these pertinent parameters. The solution of erosion and deposition problems is not only complicated but also time-dependent. It is the high time that we concentrate our efforts on the coastal area of Bangladesh. Any isolated measure without evaluation of the picture in its totality may endanger the whole ecosystem of the Bay, and any development effort may fail for lack of comprehensive information. The balancing of the erosion and deposition pattern of the major islands of the Bangladesh deserves immediate field oriented action research programs.
5. Acknowledgements
The authors express valuable thanks to the Department of Soil Science, University of Chittagong, Bangladesh for providing laboratory facilities. Thanks are also due to Mr. Md. Shoffikul Islam, Assistant Professor, Department of Soil Science, University of Chittagong, Bangladesh for his cooperation during the laboratory analyses. We also want to acknowledge the local people for their support during the sampling period.
REFERENCES
- J. R. Curray and D. G. Moore, “Growth of the Bengal Deep-Sea Fan and Denudation in the Himalayas,” In: J. H. M. Whitaker, Ed., Submarine Canyon and Deep Sea Fans, Hutchinson and Ross, Inc., Stroudsburg, 1971, pp. 236- 245.
- A. K. Biswash, “Environmental Implication of Water Development for Developing Countries,” Water Supply and Management, Vol. 2, 1978, pp. 283-297.
- J. M. Coleman, “The Sediment Field of Major Rivers of the World,” Water Resources Research, Vol. 4, No. 4, 1968, pp. 26-59.
- A. Ali, “Storm Surges in the Bay of Bengal and Some Related Problems,” PhD Dissertation, University of Read- ing, Reading, 1989.
- M. H. Siddiqui, “Land Accretion and Erosion in the Coastal Area,” Proceedings of the National Workshop on Bangladesh Coastal Area Resource Development and Management, Dhaka, 3-4 October 1988.
- D. K. Barua, “The Coastline of Bangladesh—An Overview of Process and Forms,” Proceedings of 7th Symposium on Coastal and Ocean Management, ASCE, Long Beach, CA, 8-12 July 1991, pp. 2285-2301.
- M. S. Islam and A. Hoque, “Application of Remote Sensing Technique to Study the Landuse Changes of Moheshkhali Island in Bangladesh,” Journal of Remote Sensing and Environment, Vol. 3, 1999, pp. 69-85.
- M. A. Rob and A. Hoque, “Studies on Geomorphological Environment of the Moheshkhali Island of Bangladesh,” Oriental Geographer, Vol. 43, No. 1, 1999, pp. 1-12.
- R. J. Cheel, “Introduction to Clastic Sedimentology,” Department of Earth Sciences, Brock University, St. Catharines, Ontario, Canada, 2005.
- W. C. Krumbein, “Size Frequency Distribution of Sediments,” Journal of Sedimentary Petrology, Vol. 4, No. 2, 1934, pp. 65-77. doi:10.1306/D4268EB9-2B26-11D7-8648000102C1865D
- R. L. Folk, and W. C. Ward, “Brazos River Bar: A Study of the Significance of Grain Size Parameters,” Journal of Sedimentary Petrology, Vol. 27, No. 1, 1957, pp. 3-26. doi:10.1306/74D70646-2B21-11D7-8648000102C1865D
- USACERC (U.S. Army Coastal Engineering Research Centre), “Shore Protection Manual,” VII, 1975, pp. 5-1 - 5-59.
- D. K. Datta and V. Subramanian, “Texture and Mineralogy of Sediments from the Ganges-Brahmaputra-Meghna River System in the Bengal Basin, Bangladesh and Their Environmental Implications,” Environmental Geology, Vol. 30, No. 3, 1997, pp. 181-188. doi:10.1007/s002540050145
NOTES
*Corresponding author.