Open Journal of Modern Hydrology
Vol.3 No.1(2013), Article ID:26894,7 pages DOI:10.4236/ojmh.2013.31001
A Novel Approach for the Joint Use of Rainfall Monthly and Daily Ground Station Data with TRMM Data to Generate IDF Estimates in a Poorly Gauged Arid Region
![]()
1Faculty of Engineering, Fayoum University, Fayoum, Egypt; 2Fayoum University, Fayoum, Egypt.
Email: aawadallah@darcairo.com
Received October 10th, 2012; revised November 15th, 2012; accepted November 25th, 2012
Keywords: Rainfall Frequency Analysis; Intensity Duration Frequency; TRMM; Angola
ABSTRACT
In poorly gauged regions, rainfall data are often short or even absent, hindering the possibility of estimating IntensityDuration-Frequency (IDF) relations with operationally acceptable accuracy. In this research, a novel idea is presented for the use of three separate rainfall datasets: maximum annual daily data, monthly data and Tropical Rainfall Measuring Mission (TRMM) satellite data to develop robust IDF in Namibe, south of Angola. TRMM data is used to derive relations between maximum monthly and maximum daily rainfall and between sub-daily and daily rainfall depths. Frequency analysis is undertaken on the mixed daily record using several distributions and the best fitting is selected based on discriminant plots of the distribution tails and the moment ratio diagram as well as Bayesian criteria. The IDF curves are derived based on the estimates of daily rainfall at various return periods, with the derived sub-daily rainfall duration ratios. Robust IDFs are thus developed for a scarce data region in Africa.
1. Introduction
Frequency analysis is a statistical procedure based on studying past events, which are representative of the characteristics of a given process (hydrological or other), in order to estimate the probability of occurrence of rare events. This estimation is based on the definition and fitting of a frequency model, which is an equation describing the statistical behavior of the process. These models describe the probability of occurrence of an event of a given value. The validity of the results of a frequency analysis depends on the choice of the frequency model and particularly its type. Various pathways can facilitate this choice, but unfortunately there is no universal method that ensures the correctness of the results. In fact, the estimation of the probability of occurrence of extreme rainfall is an extrapolation based on limited data. Large variations associated with small sample sizes cause the estimates to be unrealistic. In practice, however, data may be limited or in some cases may not be available for a site.
This paper presents the approach and results aiming at developing Intensity-Duration-Frequency (IDF) curves, for a region where ground rainfall stations data are scarce. To complement the old daily dataset, available from 1937 to 1952, monthly rainfall values, available for the recent period from 1998 to 2010, along with Tropical Rainfall Measuring Mission (TRMM) corrected satellite data, available from 1998 to 2011, were used. The Tropical Rainfall Measuring Mission (TRMM) is a joint mission between NASA and the Japan Aerospace Exploration Agency (JAXA) designed to measure rainfall for weather and climate research. TRMM is a research satellite designed to improve the understanding of the rainfall distribution and variability within the tropical and subtropical region (40˚S-40˚N). Several studies have compared the TRMM data with ground station data, throughhout the world and particularly in Africa [1-6]. Very few studies used the TRMM data in the process of developing IDF relations [7,8]. The main aim of this study is continue in this line of investigating the joint use of TRMM data with ground station data to produce IDFs.
The first step of this current research methodology is to disaggregate the monthly data to derive the daily annual maxima data using the characteristics of TRMM data. The second step is to assess if the daily data derived from monthly data is significantly different from the ground station daily data with respect to the mean and variance of both datasets.
Once we establish the possibility of the joint use of the daily data derived from monthly data and the available maximum daily rainfall, the frequency analysis is undertaken on the merged record of maximum daily rainfall, using several distributions. The best fitting is selected based on discriminant plots of the distribution tails, the moment ratio diagram, as well as Bayesian criteria.
The IDF curves are then derived based on the estimates of the daily rainfall at various return periods, with the sub-daily rainfall duration ratios derived using a mixture between the published storm distributions and the TRMM sub-daily rainfall duration ratios. IDFs are thus developed for a poorly rainfall gauged region. The approach is applied to Namibe city (Angola, Africa) which is located in the South of Angola (15˚12'S and 12˚09'E) with an altitude of 3 m.
2. Rainfall Data Available from Ground Stations (Daily and Monthly) and TRMM
In the procedure of developing the Intensity Duration Frequency (IDF) curves for Namibe, Angola, data for ground rain gauging stations were collected. Unfortuately, recent ground stations daily records were not available. Old data were retrieved from “Elementos Meteorológicos e Climatológicos” of the “Serviços de Marinha, Repartição Técnica de Estatística Geral”. The reports available cover the period from 1937 to 1952. They were retrieved from the National Oceanic and Atmospheric Agency in the USA, which keeps in its data rescue website scanned copies of these reports [9]. Table 1 shows the maximum daily rainfall depths recorded in millimeters. Furthermore, monthly data are available for the period from 1998 to 2010. However, no daily data were available for the same period.
Tropical Rainfall Measuring Mission (TRMM) data were used. TRMM data give rainfall depths every 3 hours and are downloadable from the below mentioned website [10]:
http://gdata1.sci.gsfc.nasa.gov/daac-bin/G3/gui.cgi?instance_id=TRMM_3B42_Daily Analyzing the ratio between monthly data and maximum annual data of TRMM, it was found that the maximum rainfall amount that fell in one day is nearly equal to 0.6 the respective monthly data (which is an envelope line for the scatterplot, as shown by Figure 1). This ratio will be used to derive the maximum annual data from the monthly available data for storms greater than 20 mm/ day. For smaller storms, it was decided to consider that the monthly maximum is equal to the daily annual maximum as a conservative option. It is worth mentioning that the correlation coefficient between the monthly data of ground stations and those of TRMM is only 0.4, which is not enough to use the TRMM data as they are. In this research, we assume that the TRMM data is consistent in itself and we derive the envelope ratio between monthly and maximum daily TRMM data and apply this ratio on the ground station rainfall data. This approach can only be valid in an arid region with limited rainy days per
Table 1. Available rainfall data for Namibe city.
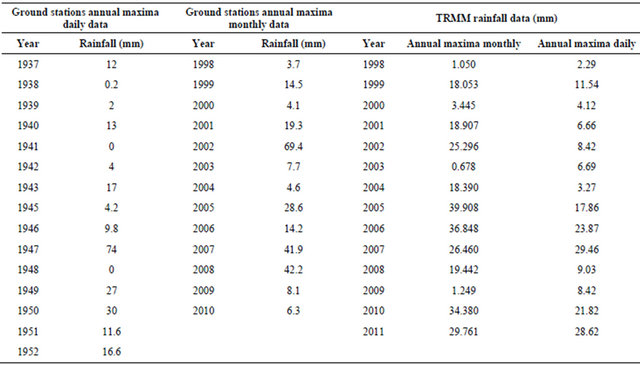
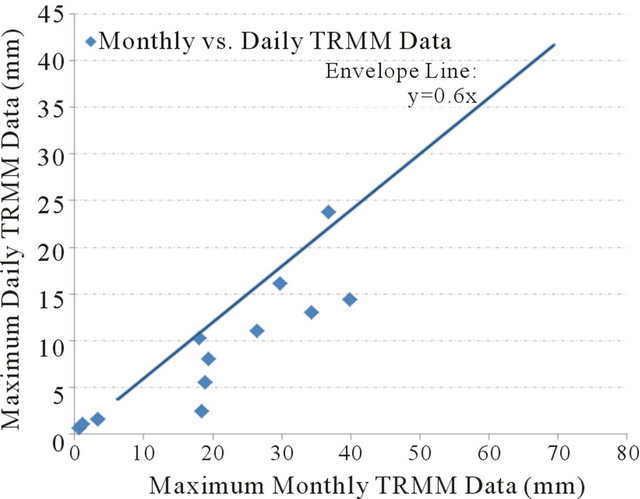
Figure 1. Monthly vs. daily TRMM rainfall data.
month; which is the main limit of applicability of the presented methodology.
3. Homogeneity Check
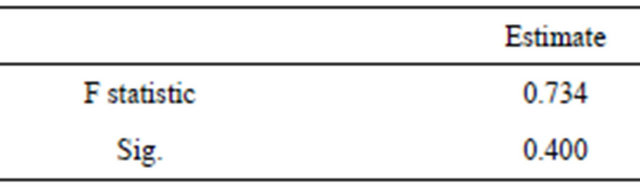
The frequency analysis of rainfall data records is affected by the number of records for each station. Therefore, carrying the analysis for all the records available shall give higher confidence to the results. However, the daily rainfall derived from monthly data should be tested first if they can be combined to the ground daily old data in one set. Several tests are available to test the homogeneity of the means and variances of 2 datasets. In this paper we follow the same approach presented in Awadallah et al. [7] using the Mann-Whitney U [11], Wilcoxon W [12], the Moses extreme reactions [13], the KolmogorovSmirnov Z, and the Wald-Wolfowitz runs tests [14] to check the homogeneity of the 2 means and the Levene’s test [15] to check the homogeneity of the 2 variances. For details about these tests, the reader is referred to [16]. Tables 2-6 present the tests results. All tests confirm that there is no statistical evidence—to a 5% level of significance—that there is a difference in the means of the two samples (Tables 2-5). The application of Levene test (Table 6) shows also that the variance of the ground daily old data is not significantly different (at 5% level of significance) from the variance of the recent daily data derived from the monthly data.
4. Frequency Analysis of the Maximum Annual Daily Rainfall
Distributions used in frequency analysis can be grouped in three categories [17] that contain the most common distributions that are widely used in hydrology to represent maximum annual series (Figure 2 after [18]):
- Class C (regularly varying distributions): Fréchet (EV2), Halphen IB (HIB), Log-Pearson (LP3), Inverse Gamma (IG).
- Class D (sub-exponential distributions): Halphen type A (HA), Halphen type B (B), Gumbel (EV1), Pearson
Table 2. Mann-Whitney U and Wilcoxon W statistics.
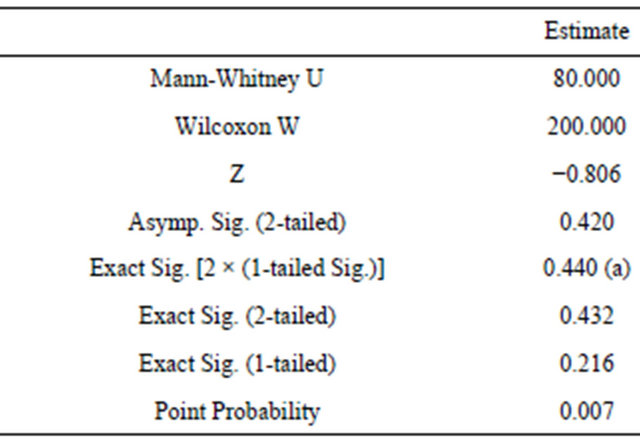
a: Not corrected for ties.
Table 3. Moses test statistics.
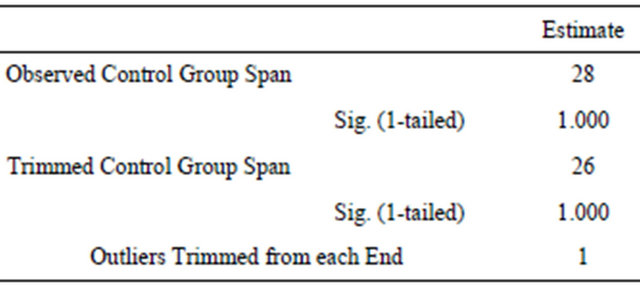
Table 4. Kolmogorov-Smirnov test statistics.
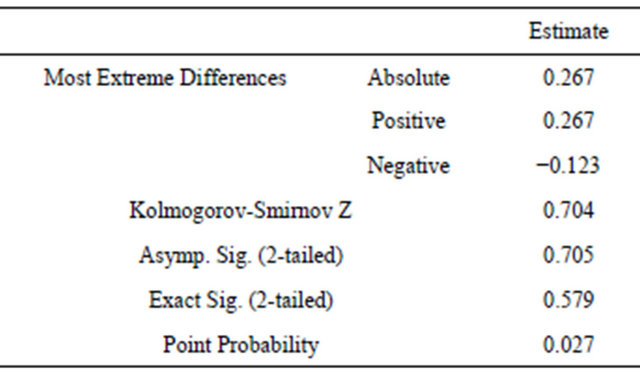
Table 5. Wald-Wolfowitz test statistics.
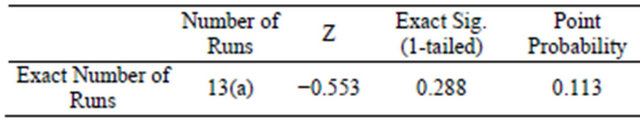
a: No inter-group ties encountered.
Table 6. Independent samples Levene test.
type III (PIII), Gamma (G).
- Class E (Exponential distribution) [17].
Other distributions not mentioned in the above classification include the three-parameter Lognormal distribution and the Generalized Pareto distribution.
To choose between distributions, the visual fitting comparison, although necessary, is highly subjective and misleading. To overcome this subjectivity, several methods are available for the choice between distributions. One can use the moment ratio diagrams whether the ordinary or the linear moments. Another methodology is the one proposed by El-Adlouni et al. [18]. A third approach is the use of Akaike and Bayesian Information Criteria. The results of the three approaches are described hereafter.
Based on the ordinary moment ratios diagram (Figure 3), the Generalized Pareto distribution, the Pearson type III distribution and consequently the Gamma distribution (which is identical to the Pearson type III as far as the moment diagram is concerned) are three candidate distributions for fitting the Namibe data.
On the other hand, the approach proposed by El-Adlouni et al. [18] allows for the identification of the most adequate class of distributions to fit a given sample through two discriminant plots. Applying this approach on Namibe data, it was found that the data belong to class D, in which Gumbel (EV1), Pearson type III (PIII),
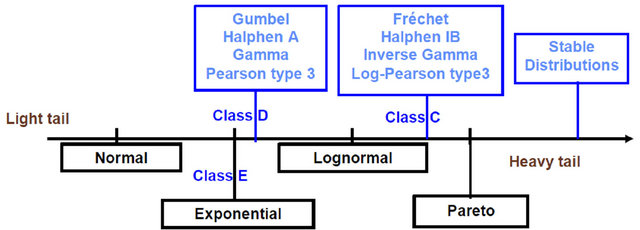
Figure 2. Distributions ordered with respect to their right tails (after El-Adlouni et al. [18]).
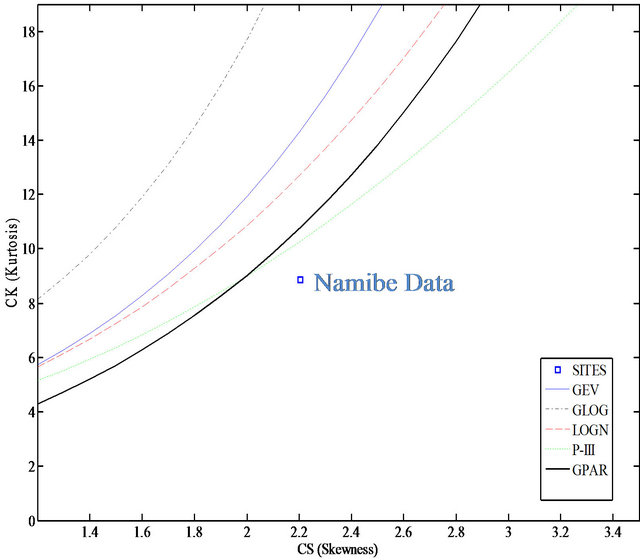
Figure 3. Moment ratio diagram.
and Gamma (G) distributions belong. It should be noted that 3-parameter lognormal and the Generalized Pareto should also be tested as they do not belong to any of the classes (refer to Figure 2). The fitting of the Namibe data to Gumbel, Pearson type III, Gamma, three-parameter lognormal and Generalized Pareto distributions are shown in Figures 4-8. Zero data (2 values out of 28) were neglected to be on the safe side and to allow for log transformations.
To choose between tested distributions, the Akaike Information Criterion (AIC) ([19] and [20]) and Bayesian Information Criterion (BIC) [21] can be used. Both criteria are based on the deviation between the fitted distribution and the empirical probability with a penalization that is function of the number of parameters of the distribu-
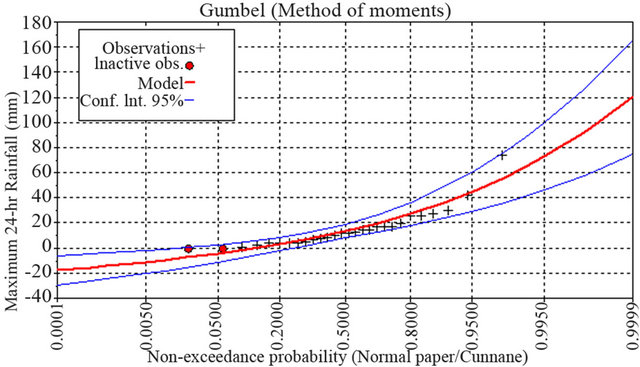
Figure 4. Fitting of the Gumbel distribution.
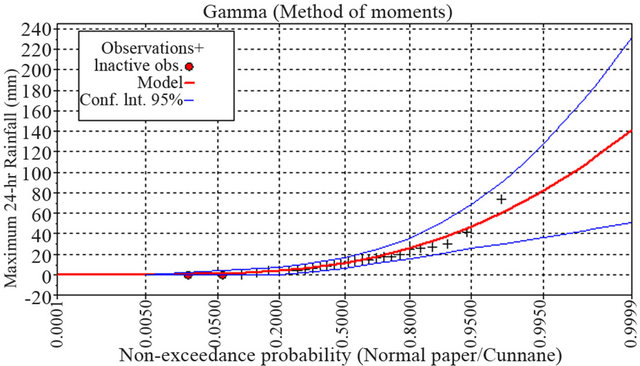
Figure 5. Fitting of the Gamma distribution.
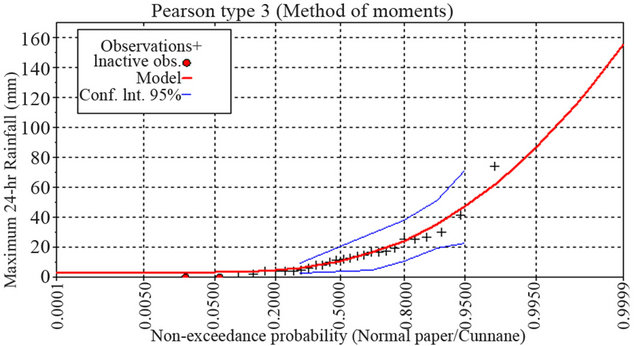
Figure 6. Fitting of the Pearson type III distribution.
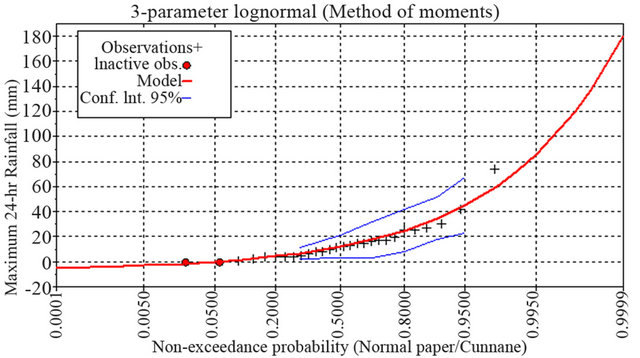
Figure 7. Fitting of the 3-parameter lognormal distribution.
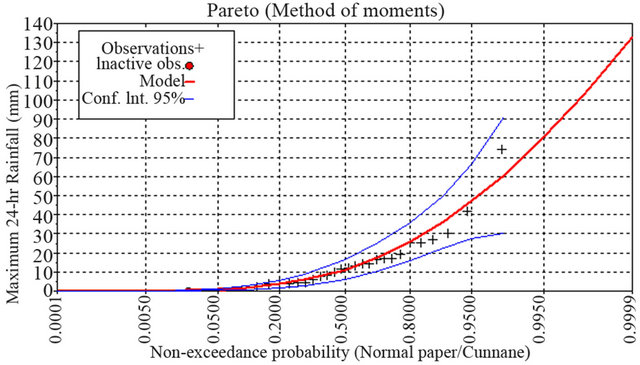
Figure 8. Fitting of the Pareto distribution.
tion and the sample size. The distribution having the smallest BIC and AIC is the one that best fits the data. Calculating the BIC and AIC for all tested distributions, it was found that the Gamma distribution is the one having the smallest BIC and AIC (Table 7). In any case, the difference between the top 3 candidates (Gamma, Pareto and three-parameter lognormal) is minor even for high return periods such as the 100-year (Table 7). The frequency analysis results of the Gamma distribution fitting to the daily Namibe rainfall are shown in Table 8.
5. Intensity Duration Frequency Curves Development
A theoretical ratio of 1.13 to 1.14 is adopted to transform the daily rainfall values and 24-hr values [22]. In the absence of short duration records or any similar information, sub-daily rainfall duration ratios could be assumed between rainfall intensities of 24-hr and those of the 12-, 6-, 3-, 2-, 1-Hr, 30-, 15-, and 5-min ratios (refer to Table 9). An example of such ratios were first proposed from durations of 2-hr to 5-min by Bell [23] based on studies in the USA, and extended to the 24-hr rainfall depth by the Soil Conservation Service of the USA through their SCS type II dimensionless rainfall curve [24]. Using The TRMM data from 3 hours to one day, we found that the ratios between X-hr storms and one day storms are 0.7, 0.84, 0.92, for 3-hr, 6-hr, and 12-hr, respectively. These ratios are nearly equal to the ratios of Bell with the SCS type II extension shown in Table 9. The Bell ratios were modified to conform to the TRMM derived ratios as shown in the same Table 9. It is well known that ratios for durations from 2 hours to 5 minutes are fairly constant in different climates because of the similarity of convective storms patterns ([23,25] and references there in).
Based on multiplying the rainfall depths of Table 8 by 1.13 and then by the ratios of Table 9, the intensity-duration rainfall values are calculated. IDF curves for return periods of 100-, 50-, 25-, 10-, 5- and 2-year are shown for Namibe, Angola (Figure 9 and Table 10).
6. Conclusions
This research presents an approach based on the joint use of the available ground data (both daily and monthly data) with TRMM satellite data to generate Intensity Duration
Table 7. Bayesian criteria for tested distributions.
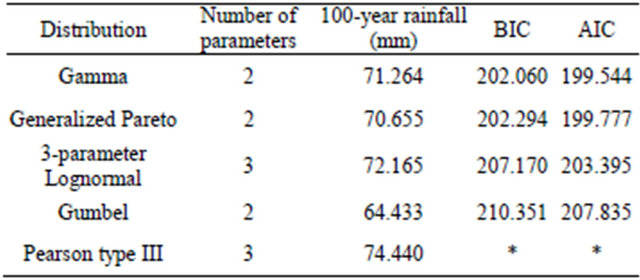
*: Log likelihood function is not available for this distribution.
Table 8. Frequency analysis results for the Gamma distribution.
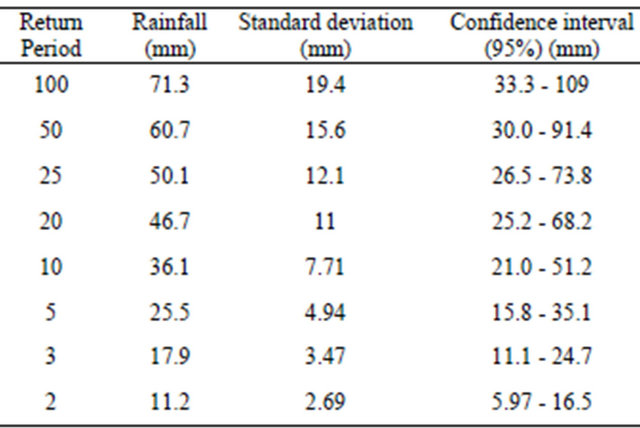
Table 9. Ratios between 24-hr duration intensity and other storm duration intensities.
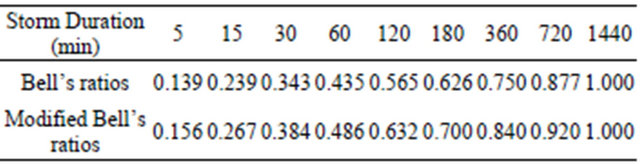
Table 10. Intensity-duration-frequency values for Namibe.
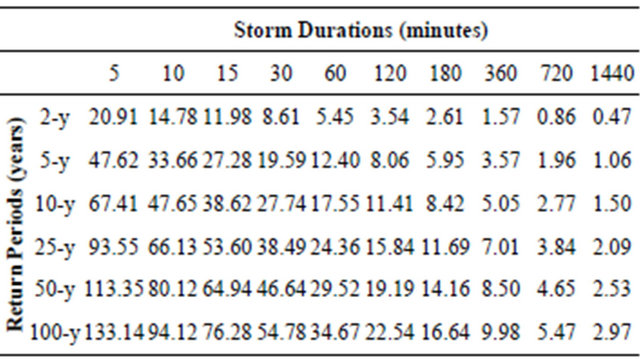
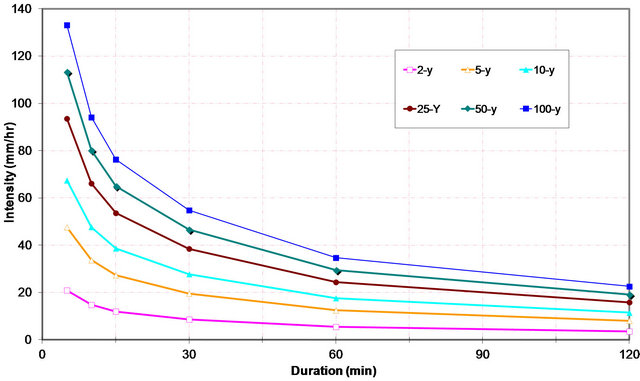
Figure 9. Intensity-duration-frequency curves for Namibe.
Frequency (IDF) estimates, for a poorly gauged region, where a long and reliable rainfall daily maximum record is not available. First, daily rainfall data are derived from monthly ground station data using TRMM characteristics for the same period. Then, homogeneity of the means and variances are checked for the data. Frequency analysis is carried out and the best distribution is selected based on several criteria, including moment ratio diagram, discriminant plots of the distribution tails and Bayesian criteria. TRMM data from 3 hours to one day are used with the Bell/SCS type II short duration ratios to derive location corrected sub-daily rainfall duration ratios. Daily rainfall depths at various return periods and short duration rainfall ratios are combined to obtain IDF curves for the location of interest.
REFERENCES
- A. T. Haile, T. Rientjes, E. Habib and V. Jetten, “Rain Event Properties and Dimensionless Rain Event Hyetographs at the Source of the Blue Nile River,” Journal of Hydrology and Earth System Sciences, Vol. 15, 2011, pp. 1023-1034. doi:10.5194/hess-15-1023-2011
- A. T. Haile, T. H. M. Rientjes, A. Gieske and M. Gebremichael, “Rainfall Variability over Mountainous and Adjacent Lake Areas: The Case of Lake Tana Basin at the Source of the Blue Nile River,” Journal of Applied Meteorology and Climatology, Vol. 48, 2009, pp. 1696-1717. doi:10.1175/2009JAMC2092.1
- D. A. Hughes, “Comparison of Satellite Rainfall Data with Observations from Gauging Station Networks,” Journal of Hydrology, Vol. 327, No. 3-4, 2006, pp. 399-410. doi:10.1016/j.jhydrol.2005.11.041
- S. Nicholson, “On the Question of the “Recovery” of the Rains in the West African Sahel,” Journal of Arid Environments, Vol. 63, No. 3, 2005, pp. 615-641. doi:10.1016/j.jaridenv.2005.03.004
- L. Li, Y. Hong, J. Wang, R. F. Adler, F. S. Policelli, S. Habib, D. Irwn, T. Korme and L. Okello, “Evaluation of the Real-Time TRMM-Based Multi-Satellite Precipitation Analysis for an Operational Flood Prediction System in Nzoia Basin, Lake Victoria, Africa,” Natural Hazards, Vol. 50, No. 1, 2009, pp. 109-123. doi:10.1007/s11069-008-9324-5
- K. Adjei, L. Ren, E. Appiah-Adjei, K. Kankam-Yeboah and A. Agyapong, “Validation of TRMM Data in the Black Volta Basin of Ghana,” Journal of Hydrologic Engineering, Vol. 17, No. 5, 2012, pp. 647-654. doi:10.1061/(ASCE)HE.1943-5584.0000487
- A. G. Awadallah, M. El Gamal, M. El Mostafa and H. El Badry, “Developing Intensity-Duration-Frequency Curves in Scarce Data Region: An Approach Using Regional Analysis and Satellite Data,” Engineering, Vol. 3, No. 3, 2011, pp. 215-226. doi:10.4236/eng.2011.33025
- T. A. Endreny and N. Imbeah, “Generating Robust Rainfall Intensity-Duration-Frequency Estimates with ShortRecord Satellite Data,” Journal of Hydrology, Vol. 371, No. 1-4, 2009, pp. 182-191. doi:10.1016/j.jhydrol.2009.03.027
- National Oceanic and Atmospheric Agency (NOAA), “Angola Climatological Data,” 2012. http://docs.lib.noaa.gov/rescue/data_rescue_angola.html
- G. J. Huffman, R. F. Adler, D. T. Bolvin, G. Gu, E. J. Nelkin, K. P. Bowman, Y. Hong, E. F. Stocker and D. B. Wolff, “The TRMM Multi-Satellite Precipitation Analysis: Quasi-Global, Multi-Year, Combined Sensor Precipitation Estimates at Fine Scale,” Journal of Hydrometeorology, Vol. 8, 2007, pp. 38-55. doi:10.1175/JHM560.1
- H. B. Mann and D. R. Whitney, “On a Test of whether One of Two Random Variables Is Stochastically Larger than the Other,” Annals of Mathematical Statistics, Vol. 18, No. 1, 1947, pp. 50-60. doi:10.1214/aoms/1177730491
- F. Wilcoxon, “Individual Comparisons by Ranking Methods,” Biometrics, Vol. 1, No. 6, 1945, pp. 80-83. doi:10.2307/3001968
- L. E. Moses, “A Two-Sample Test,” Psychometrika, Vol. 17, No. 3, 1952, pp. 239-247. doi:10.1007/BF02288755
- M. A. Stephens, “EDF Statistics for Goodness of Fit and Some Comparisons,” Journal of the American Statistical Association, Vol. 69, No. 347, 1974, pp. 730-737. doi:10.1080/01621459.1974.10480196
- H. Levene, “Robust Tests for Equality of Variances,” In: I. Olkin, et al., Eds., Contributions to Probability and Statistics: Essays in Honor of Harold Hotelling, Stanford University Press, Palo Alto, 1960, pp. 278-292.
- W. J. Conover, “Practical Nonparametric Statistics,” 3rd Edition, John Wiley, Hoboken, 1980.
- INRS, “Guide for the Use of the Decision Support System (DSS) for HYFRAN plus Software,” Institute National de Recherche Scientifique, Eau, Terre et Environnement, Québec, 2008.
- S. El Adlouni, B. Bobée and T. B. M. J. Ouarda, “On the Tails of Extreme Event Distributions in Hydrology,” Journal of Hydrology, Vol. 355, No. 1-4, 2008, pp. 16-33. doi:10.1016/j.jhydrol.2008.02.011
- H. Akaike, “Information Theory and Extension of the Maximum Likelihood Principle,” In: B. N. Petrov and F. Csaki, Eds., 2nd International Symposium on Information Theory, Akadémiai Kiado, Budapest, 1973, pp. 267-281.
- H. Akaike, “Markovian Representation of Stochastic Processes and Its Application to the Analysis of Autoregressive Moving Average Processes,” Annals of the Institute of Statistical Mathematics, Vol. 26, 1974, pp. 363- 387. doi:10.1007/BF02479833
- G. Schwarz, “Estimating the Dimension of a Model,” The Annals of Statistics, Vol. 6, No. 2, 1978, pp. 461-464. doi:10.1214/aos/1176344136
- D. M. Hershfield, “Rainfall Frequency Atlas of the United States for Durations from 30 Minutes to 24 Hours and Return Periods from 1 to 100 Years,” Weather Bureau Technical Paper, No. 40, 1961, p. 115.
- F. C. Bell, “Generalized Rainfall-Duration-Frequency Relationship,” Journal of Hydraulic Division, Vol. 95, No. 1, 1969, pp. 311-327.
- Soil Conservation Service, “Urban Hydrology for Small Watersheds, Technical Release 55,” United States Department of Agriculture, Washington DC, 1986.
- A. G. Awadallah and N. S. Younan, “Conservative Design Rainfall Distribution for Application in Arid Regions with Sparse Data,” Journal of Arid Environments, Vol. 79, 2012, pp. 66-75. doi:10.1016/j.jaridenv.2011.11.032