Theoretical Economics Letters
Vol. 2 No. 3 (2012) , Article ID: 21520 , 6 pages DOI:10.4236/tel.2012.23043
Product Market Competition and Economic Growth: The Role of Increasing Returns to Production Specialization
1Institute of Economics, Academia Sinica, Taipei, Chinese Taipei
2Department of Economics, Fu-Jen Catholic University, New Taipei City, Chinese Taipei
3Department of Industrial Economics, Tamkang University, New Taipei City, Chinese Taipei
Email: jjchang@econ.sinica.edu.tw, hwhung@mail.tku.edu.tw
Received June 2, 2012; revised July 4, 2012; accepted August 3, 2012
Keywords: Monopoly Power; Increasing Returns to Specialization; Economic Growth
ABSTRACT
In a simple one-sector endogenous growth model of imperfect competition, we show that the competitiveness-growth relationship can be mixed, crucially depending on the degree of the increasing returns to specialization. This ambiguity not only reconciles the theoretical prediction with the recent empirical evidence, but also provides a plausible explanation for the diversity in the competitiveness-growth relationship across countries.
1. Introduction
Is more intense product market competition (PMC) good or bad for growth? This question is important, since its answer will govern the development of antitrust and other competition policies. The conventional Schumpeterian paradigm indicates that monopoly power is viewed as the reward accruing to the successful firms from their innovative activities; the larger this reward, the stronger the incentive to innovate. Since tougher competition erodes the monopolistic rents that can be appropriated by successful innovators, more intense PMC is harmful to technological progress and hence economic growth ([1- 3]). However, this theoretical prediction is not supported by empirical studies. References, [4-8] have pointed to a positive correlation between PMC and productivity growth at the firmand industry-level, thereby leading to a positive link between PMC and aggregate economic growth.1 [9,10] use recent data on the patenting activity of a panel of UK and US firms and refer to an inverted-U relationship between PMC and innovation (growth).
To reconcile the theory with the empirical evidence, the Schumpeterian paradigm has been recently re-formulated and several extensions of the R&D model of endogenous growth have been proposed in the theoretical literature. [11,12] introduce agency issues into the basic Schumpeterian growth model and show that tougher competition can force managers to speed up the adoption of new technologies, which is beneficial to economic growth. Study of [14] shows that there exists an inverted-U relationship between PMC and growth in a model à la Romer with human capital.2 By allowing products to be both horizontally and vertically differentiated, [15] also obtains a positive relationship between PMC and growth. Unlike these studies, the present study departs from the Schumpeterian paradigm and attempts to shed light on the role of the returns to specialization in the determination of the PMC-growth relationship in a simple onesector AK model of imperfect competition with endogenous entry. In line with [16,17], in our model endogenous growth is based on the returns to specialization, rather than on firms’ R&D. We show that increasing returns to production specialization (IRPS) can serve as an alternative that provides a plausibly theoretical explanation to the mixed competitiveness-growth relationship found in the empirical literature. It is important to emphasize that in a departure from the model setting in [17-19], we follow [20,21] to introduce a distinction between the returns to specialization and the markup. By doing so, we not only have a better measure of PMC, but can also further verify the role played by the returns to specialization in the PMC-growth relationship.
IRPS have been shown to have their practical importance. [23] (Chapter 5), [24,25] argue that if the same assortment of commodities can be manufactured in specialized firms, the so-called scale economies will lead to better work performance and improved organization of work. Studies conducted in the United States both during and after World War II have shown that, in several industries, productivity has tended to increase by 18 - 20 percent as accumulated output has doubled through the production of a particular commodity (horizontal specialization) (see [26] for the details). Specialization is also often used to explain higher productivity in US as compared to Canadian textile plants (see, for instance, [23]). Recent studies, such as [27-29], further point out that nowadays many products are becoming more modular over time and this development is often associated with a change in industry structure towards higher degrees of specialization. It has contributed to specific activities becoming more suitable and has attracted a large number of de novo entrants.
Our analysis suggests that the competitiveness-growth relationship can be either positive or negative depending on the degree of IRPS. The economic intuition underpinning this PMC-growth relationship is as follows. Firstly, by forcing price to converge to marginal cost, tougher competition decreases the distortion of market imperfections that yields a lower long-run level of capital in comparison with a perfectly competitive economy. In an AKtype (a [30]-type) endogenous growth model, this efficiency gain gives rise to a positive effect on economic growth. By contrast, competition may decrease the rate of economic growth in the presence of endogenous entry in the long run. Higher monopoly power, on the one hand, raises incumbents’ profits and, on the other hand, provides an incentive for new firms to enter the market. If the increase in the number of firms leads individual firms to specialize in a single product, increasing returns to specialization occur. As the positive effect of the externality is substantial, monopoly power give rises to a favorable, rather than harmful, effect in terms of boosting economic growth. The ambiguity of our result reconciles the theoretical prediction with the recent empirical evidence in a one-sector AK model, rather than the Schumpeterian endogenous growth model. Interestingly, we show that there exists an inverted-U-shaped relationship between PMC and growth. This implies that due to the distinct status quo level of PMC, competition is beneficial in countries where the degree of IRPS is relatively low, but remains detrimental elsewhere with relatively high IRPS. This provides a plausible explanation to the diversity in the competitiveness-growth relationship across countries.
The rest of the paper is organized as follows. Section 2 sets up the model of households, firms, and conditions for macroeconomics equilibrium. Section 3 is the result analysis. Section 4 provides some concluding remarks.
2. The Model
Consider an economy which consists of households and firms. Time t is continuous.
2.1. Households
The economy is populated by a unit measure of identical and infinitely-lived households. For the sake of analytical convenience, we assume that each household supplies inelastically one unit of labor services per unit of time, i.e., the fixed quantities of labor . Our main results are valid in the model with a labor-leisure choice. In equilibrium, the labor market clears and the household obtains the desired quantity of employment.
Given a constant time preference rate  and an initial capital stock
 , each household seeks to maximize the following lifetime utility by choosing consumption
  and capital
 , i.e.:
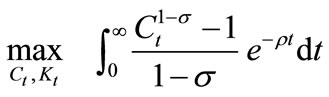 , with
  (1)
(1)
subject to its budget constraint: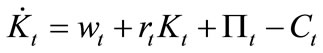 , where
  (
( ) is the wage (rental) rate and the
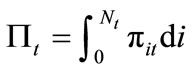 are the aggregate profits derived from intermediate firms (
 and
and  denote the number of intermediate goods produced and an individual firm’s profits, respectively). Solving the household’s problem yields the standard Keynes-Ramsey Rule:
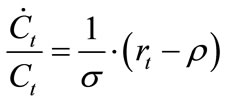 (2)
(2)
and the transversality condition , where
 is the shadow price associated with the budget constraint.
2.2. Firms
On the production side, there are two types of goods: a homogeneous final good and differentiated intermediate inputs indexed by i. The final good market is perfectly competitive, while the intermediate goods market is characterized by monopolistic competition. By following [20], the final good is produced simply using a continuum of intermediate inputs ,
,  and takes the following generalized form of production function:
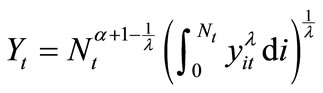 ;
; (3)
(3)
If all intermediate goods are hired in the same quantities, i.e., yit = yt  under a symmetric equilibrium, the final good output then becomes:
 . This implies that there are constant returns to the quantities employed of a variety of intermediate goods, but either increasing (if
 ) or decreasing (if
 ) returns to an expansion in such a variety, while holding the quantity employed of each intermediate good fixed. By letting
  (>0), (3) can easily recover the traditional specification
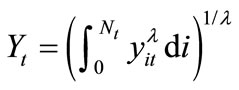 , such as in
[17-19]. Under a symmetric equilibrium, the traditional specification refers to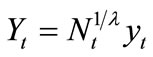 , indicating that monopoly power and IRPS (to an expansion in variety) are characterized by the same parameter
 . It is somewhat difficult to distinguish what arises due to market imperfections and what is due to increasing returns. However, as emphasized by [20,21], the specification of (3) allows us to clearly separate increasing returns from imperfect competition, so that both effects can be fully disentangled. Of importance, it provides us with a better measure of PMC. As we will see, this is particularly important when we are exploring the competitiveness-growth relationship.3
Assume that the final good is the numéraire and that  is the relative price of the intermediate good i. Thus, the profit maximization problem for the final good firm is given by:
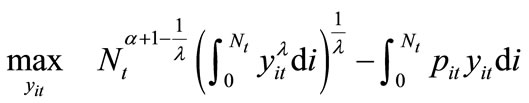
Accordingly, the corresponding first-order condition is as follows:
 (4)
(4)
Equation (4) is the demand function for the ith intermediate good which is characterized by a constant price elasticity . As is evident, a larger
  implies a higher price elasticity of demand for intermediate good i and, accordingly, indicates that the intermediate good sector is more competitive.
Intermediate good producers employ capital  and labor
  to produce their product and sell it to the final good producers at the profit-maximizing price. With an overhead cost
  (paid in units of intermediate good output), the production technology for intermediate good i can be expressed as:
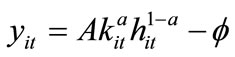 , with
  (5)
(5)
where the parameter a(1 – a) measures the capital (labor) share. Subject to (4) and (5), the intermediate good firm maximizes the profit function: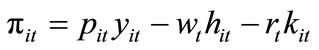 , by choosing
  and
and . Solving the optimization problem leads to the following first-order conditions:
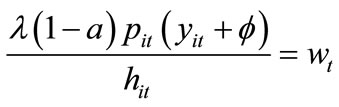 and
and 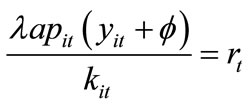 (6)
(6)
By substituting (6) into the profit function above, we have the intermediate good producer’s profit as:
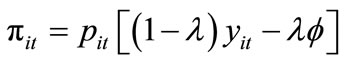 (7)
(7)
2.3. Macroeconomics Equilibrium
Under a symmetric equilibrium where , yit = yt,
  , and
, and 
 . Accordingly, substituting
  into (4) yields:
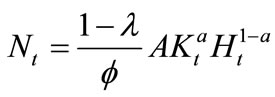
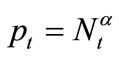 . Moreover, free entry guarantees zero profits for each intermediate good producer. Thus, from (7), the quantity of each intermediate good produced is:
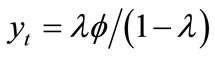 . With this resulting relationship, (5) gives the equilibrium number of firms:
 (8)
(8)
Given the fixed supply for labor , substituting (8) and
  into (3) yields the aggregate output of the final good:
 (9)
(9)
To ensure a balanced-growth-path (BGP) equilibrium, we need to impose the constraint . With (8) and (9), the aggregate consistency condition refers to
  and
and . Thus, given the symmetric equilibrium relationship
  and by substituting the intermediate good producers’ profits (7), the factors’ prices (6), and the intermediate good’s price
  into the household’s budget constraint, the economy-wide resource constraint is given by:
 (10)
(10)
3. The Relationship between PMC and Growth
We now are ready to investigate the relationship between the degree of imperfect competition (or PMC) and the growth rate of the BGP equilibrium. Under symmetric equilibrium, the Keynes-Ramsey rule (2) and the aggregate resource constraint (10) can be represented by
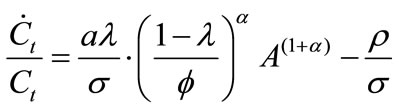
and
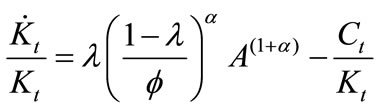
and, accordingly, the balanced-growth rate  is:
is:
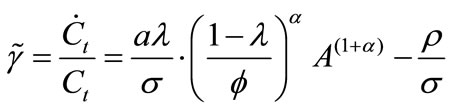 (11)
(11)
Based on (11), we then establish the following proposition:
Proposition 1. In the presence of IRPS ( ), there exists an inverted-U-shaped relationship between PMC (
 ) and growth (
 ).
).
Proof. By differentiating (11) with respect to , we immediately have:
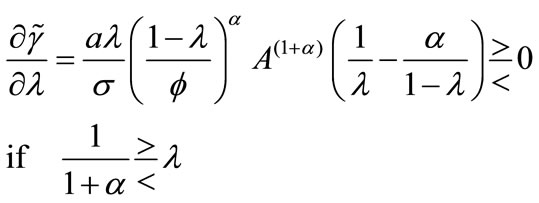 (12)
(12)
 .4■
.4■
Proposition 1 indicates that the growth-competitiveness relationship can be either positive or negative depending on the degree of IRPS  and the level of competitiveness
 . Intuitively, since stronger competition (a higher
 ) will promote production efficiency and increase each existing firm’s output (given
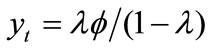 , we can derive
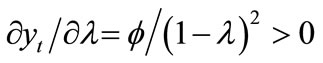 ). This will give rise to a positive effect on the balanced growth rate. By contrast, more intense PMC may decrease the balanced growth rate in the presence of endogenous entry. As shown in (7), higher monopoly power tends to raise profits in equilibrium, hence creating an incentive for new firms to enter the market. If the presence of endogenous entry leads to increasing returns to specialization (
 ), the increase in the number of firms will generate a positive external effect in terms of boosting economic growth. As is evident, the growth-enhancing effect stemming from increasing returns to specialization becomes larger if
  is higher. Under such a situation, stronger competition is more likely to harm the balanced-growth rate, leading to a negative competitiveness-growth relationship.
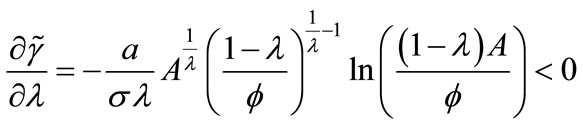
Note that if the returns to production specialization are either absent  or decreasing
 , monopoly power cannot generate a sufficiently positive external effect on growth. Consequently, there is an unambiguously positive competitiveness-growth relationship. In contrast, if we adopt the specification of [17,19] and set
  (with the degree of IRPS being
 ), (12) turns out to be
indicating that the latter entry effect dominates the former effect of production efficiency. As a result, there is a monotonically negative relationship between PMC and growth. Such a result is debatable, since it obviously comes from an inappropriate specification which cannot clearly separate increasing returns from imperfect competition.
Interestingly, there exists an inverted-U-shaped relationship between PMC ( ) and growth (
 ) with a maximum growth rate which is consistent with the recent evidence (see [9,10]). As shown in Figure 1, the growthmaximizing PMC requires that the condition of
  be satisfied. This implies that the status quo level of PMC and the degree of IRPS jointly govern the competitiveness-growth relationship. If we follow [32] and set the degree of IRPS
 , the maximum growth rate is located at around
 . Note that this value is in accordance with the empirically plausible range 1.32 - 1.49, estimated from US data by [33] and also within the range of various areas summarized from 8 studies by [34].5
[35] estimates that during 1981-2004 the weighted average PMC in the European area is λ = 0.73; notably, Italy shows higher markups (λ = 0.62). Specifically, PMC λ = 0.91 in Japan, λ = 0.89 in the UK, λ = 0.88 in the US during 1975-2002 (estimated by [36]), λ = 0.58 in Egypt in the 1990s (estimated by [37]), and λ = 0.62 in Thailand during 2001-2005 (estimated by [38]). In addition, the 2008 OECD indicators of Product Market Regulation reveal that, due to deregulation policy, OECD countries in general are more competitive than less developed non-OECD countries, such as China, Russia, India, and South Africa.6 With these observations, Figure 1 suggests that given a specific degree of IRPS more intense competition will be more likely to stimulate economic growth for the countries with less competition at the status quo (such as Italy or less developed countries), while it will be more likely to hamper growth for the countries with high competition (such as Japan and the European area). In other words, given a specific degree of IRPS there is more likely to be a positive competitiveness-growth relationship in the less developed countries.
4. Concluding Remarks
In this paper we set up a simple one-sector endogenous growth model of imperfect competition and use it to highlight the importance of IRPS in a competitivenessgrowth relationship. This ambiguity of our result allows us to reconcile the theoretical prediction with the recent empirical evidence in a one-sector AK model, rather than the Schumpeterian endogenous growth model. Of importance, it allows us to provide a simple, but interesting,
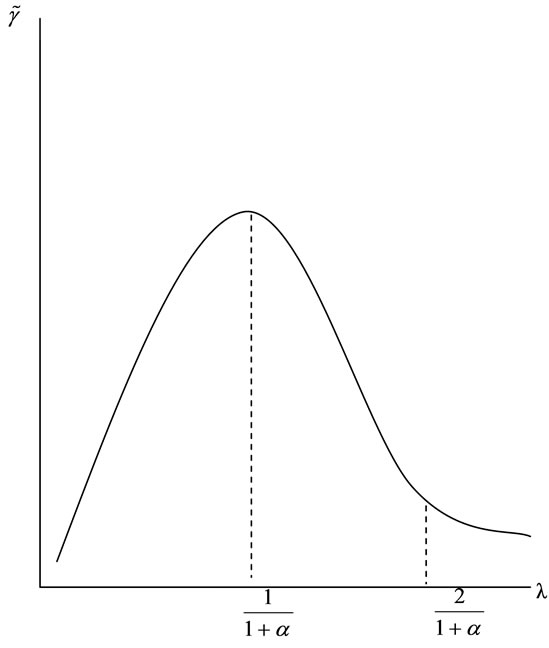
Figure 1. The competitiveness-growth relationship.
numerical example, indicating that due to the distinct status quo level of PMC, competition is beneficial in countries where the degree of IRPS is relatively low, but remains detrimental elsewhere with relatively high IRPS. Our result not only reconciles the theoretical prediction with the recent empirical evidence, but also provides a plausible explanation to the considerable diversity in the PMC-growth relationship across countries.
REFERENCES
- P. M. Romer, “Endogenous Technological Change,” Journal of Political Economy, Vol. 98, No. 5, 1990, pp. S71- S102. doi:10.1086/261725
- P. Aghion and P. Howitt, “A Model of Growth through Creative Destruction,” Econometrica, Vol. 60, No. 2, 1992, pp. 323-351. doi:10.2307/2951599
- P. Aghion and P. Howitt, “Endogenous Growth Theory,” MIT, Cambridge, 1998.
- R. Blundell, R. Griffith and J. V. Reenen, “Dynamic Count Data Models of Technological Innovation,” Economic Journal, Vol. 105, No. 429, 1995, pp. 333-344. doi:10.2307/2235494
- R. Blundell, R. Griffith and J. van Reenen, “Market Share, Market Value and Innovation in a Panel of British Manufacturing Firms,” Review of Economic Studies, Vol. 66, No. 3, 1999, pp. 529-554. doi:10.1111/1467-937X.00097
- S. Basu, “Procyclical Productivity: Increasing Returns or Cyclical Utilization?” Quarterly Journal of Economics, Vol. 111, No. 3, 1996, pp. 719-751. doi:10.2307/2946670
- S. Nickell, “Competition and Corporate Performance,” Journal of Political Economy, Vol. 104, No. 4, 1996, pp. 724-746. doi:10.1086/262040
- R. Disney, J. Haskel and Y. Heden, “Restructuring and Productivity Growth in UK Manufacturing,” Economic Journal, Vol. 113, No. 489, 2003, pp. 666-694. doi:10.1111/1468-0297.t01-1-00145
- P. Aghion, R. Blundell, N. Bloom and R. Griffith, “Competition and Innovation: An Inverted-U Relationship,” Quarterly Journal of Economics, Vol. 120, No. 2, 2005, pp. 701-728. doi:10.1162/0033553053970214
- P. Aghion and R. Griffith, “Competition and Growth: Reconciling Theory and Evidence,” Zeuthen Lecture Book Series, MIT, Cambridge and London, 2005.
- P. Aghion, M. Dewatripont and P. Rey, “Competition, Financial Discipline and Growth,” Review of Economic Studies, Vol. 66, No. 4, 1999, pp. 825-852. doi:10.1111/1467-937X.00110
- P. Aghion, C. Harris, P. Howitt and J. Vickers, “Competition and Growth with Step-by-Step Innovation,” Review of Economic Studies, Vol. 68, No. 3, 2001, pp. 467-492. doi:10.1111/1467-937X.00177
- S. Ahn, “Competition, Innovation and Productivity Growth: A Review of Theory and Evidence,” OECD Economics Working Paper, No. 317, 2002.
- A. Bucci, “An Inverted-U Relationship between Product Market Competition and Growth in an Extended Romerian Model,” Rivista di Politica Economica, Vol. 95, No. 5, 2005, pp. 177-206.
- A. Minniti, “Product Market Competition, R&D Composition and Growth,” Economic Modelling, Vol. 27, No. 1, 2010, pp. 417-421. doi:10.1016/j.econmod.2009.10.008
- P. M. Romer, “Growth Based on Increasing Returns Due to Specialization,” American Economic Review, Vol. 77, No. 2, 1987, pp. 56-62.
- M. B. Devereux, A. C. Head and B. L. Lapham, “Government Spending and Welfare with Returns to Specialization,” Scandinavian Journal of Economics, Vol. 102, No. 4, 2000, pp. 547-561. doi:10.1111/1467-9442.00214
- A. K. Dixit and J. E. Stiglitz, “Monopolistic Competition and Optimum Product Diversity,” American Economic Review, Vol. 67, No. 3, 1977, pp. 297-308.
- M. B. Devereux, A. C. Head and B. L. Lapham, “Monopolistic Competition, Increasing Returns, and the Effects of Government Spending,” Journal of Money, Credit, and Banking, Vol. 28, No. 2, 1996, pp. 233-254. doi:10.2307/2078025
- J. P. Bénassy, “Monopolistic Competition, Increasing Returns to Specialization and Output Persistence,” Economics Letters, Vol. 52, No. 2, 1996, pp. 187-191. doi:10.1016/S0165-1765(96)00856-7
- J. P. Bénassy, “Is There Always Too Little Research in Endogenous Growth with Expanding Product Variety?” European Economic Review, Vol. 42, No. 1, 1998, pp. 61-69. doi:10.1016/S0014-2921(97)00061-5
- D. Bianco, “Competition and Growth in an Endogenous Growth Model with Expanding Product Variety without Scale Effects,” MPRA Paper, No. 9469, University Library of Munich, Munich, 2007.
- B. Balassa, “Trade Liberalization among Industrial Countries: Objectives and Alternatives,” McGraw-Hill for Council on Foreign Relations, New York, 1967.
- B. Balassa, “The Determinants of Intra-Industry Specialization in United States Trade,” Oxford Economic Papers, Vol. 38, No. 2, 1986, pp. 220-233.
- W. J. Ethier, “National and International Returns to Scale in the Modern Theory of International Trade,” American Economic Review, Vol. 72, No. 3, 1982, pp. 389-405.
- L. Rapping, “Learning and World War II Production Functions,” Review of Economics and Statistics, Vol. 47, No. 1, 1965, pp. 81-86. doi:10.2307/1924126
- R. Sanchez and J. T. Mahoney, “Modularity, Flexibility, and Knowledge Management in Product and Organization Design,” Strategic Management Journal, Vol. 17, 1996, pp. 63-76.
- R. N. Langlois, “Modularity in Technology and Organization,” Journal of Economic Behavior and Organization, Vol. 49, No. 1, 2002, pp. 19-37.
- M. G. Jacobides, “Industry Change through Vertical Disintegration: How and Why Markets Emerged in Mortgage Banking,” Academy of Management Journal, Vol. 48, No. 3, 2005, pp. 465-498. doi:10.5465/AMJ.2005.17407912
- S. Rebelo, “Long-Run Policy Analysis and Long-Run Growth,” Journal of Political Economy, Vol. 99, No. 3, 1991, pp. 500-521. doi:10.1086/261764
- S. Basu and J. G. Fernald, “Returns to Scale in US Production: Estimates and Implications,” Journal of Political Economy, Vol. 105, No. 2, 1997, pp. 249-283. doi:10.1086/262073
- M. B., Devereux, A. C. Head and B. L. Lapham, “Aggregate Fluctuations with Increasing Returns to Specialization and Scale,” Journal of Economic Dynamics and Control, Vol. 20, No. 4, 1996, pp. 627-656. doi:10.1016/0165-1889(95)00868-3
- R. J. Caballero and R. K. Lyons, “External Effects in US Procyclical Productivity,” Journal of Monetary Economics, Vol. 29, No. 2, 1992, pp. 209-225. doi:10.1016/0304-3932(92)90013-R
- A. Kraay and C. Raddatz, “Poverty Traps, Aid, and Growth,” Journal of Development Economics, Vol. 82, No. 2, 2007, pp. 315-347. doi:10.1016/j.jdeveco.2006.04.002
- R. Christopoulou and P. Vermeulem, “Markups in the EURO Area and the US over the Period 1981-2004: A Comparison of 50 Sectors,” Empirical Economics, Vol. 42, No. 1, 2012, pp. 53-77. doi:10.1007/s00181-010-0430-3
- J. Høj, M. Jimenez, M. Maher, G. Nicoletti and M. Wise, “Product Market Competition in the OECD Countries: Taking Stock and Moving Forward,” OECD Economics Working Paper, No. 575, 2007.
- K. Sekkat, “Does Competition Improve Productivity in Developing Countries?” Journal of Economic Policy Reform, Vol. 12, No. 2, 2009, pp. 145-162. doi:10.1080/17487870902872946
- P. Prapassornmanu, “The Effect of Exchange Rates on Firm’s Investment: The Evidence from Thailand’s Manufacturing Firms,” Faculty of Economics, Thammasat University, Bangkok, 2009.
NOTES
1See [13] for a comprehensive review of the theory and evidence on the competition-innovation-growth relationship.
2By extending the [14] model to a more generalized one, [22] shows that under some situations, the inverted-U-shaped relationship between PMC and growth may disappear.
3[31] shows that the degree of increasing returns in US manufacturing is different from estimates of the markup.
4It is easy to find that the inverted-U-shaped relationship between PMC and growth has a inflection point at .
.
5By also focusing on US production, [31] finds relatively lower external increasing returns.
6The detailed information can be accessed at http://stats.oecd.org/Index.aspx.