Open Journal of Safety Science and Technology
Vol.3 No.2(2013), Article ID:33341,9 pages DOI:10.4236/ojsst.2013.32002
Pedestrian Injury Severity in Automobile Crashes
Department of Marketing, Transportation and Supply Chain, North Carolina A&T State University, Greensboro, USA
Email: obengk@ncat.edu
Copyright © 2013 Kofi Obeng, Md Rokonuzzaman. This is an open access article distributed under the Creative Commons Attribution License, which permits unrestricted use, distribution, and reproduction in any medium, provided the original work is properly cited.
Received January 29, 2013; revised February 28, 2013; accepted March 15, 2013
Keywords: Pedestrians; Injury Severity; Signalized Intersections; Automobile Crashes
ABSTRACT
This paper analyzes pedestrian injury severity from automobile crashes at signalized intersections in a medium-size city. It estimates an ordered logit model of injury severity and finds that vehicle type, gender, land-use, speed limit, traffic volume, the presence of sidewalks and visual-obstruction significantly explain pedestrian injury severity in vehiclepedestrian crashes at signalized intersections. Females also are found to be disproportionately involved in these crashes, while sidewalks increase the probability of a pedestrian sustaining a serious injury, passenger cars, sport utility vehicles and pickups are associated with less severe pedestrian injuries.
1. Introduction
Although the invention of the automobile is considered as a boon to mankind, it has the unwanted effects of causing injuries, fatalities and property damage in crashes as well as environmental pollution. Despite these adverse effects, increasing personal wealth and economic activities and their resultant increases in travel demand make automobiles indispensable and bring into focus the need to understand and control automobile crashes. Reference [1] writes about these adverse effects and notes that each year over 1.2 million people die in automobile crashes world-wide, that 20 - 50 million people suffer non-fatal injuries, and that pedestrians, cyclists and users of motorized two-wheeled modes represent almost half of those who die in automobile crashes. It is also reported that most of these deaths are in lowand middle-income countries. For the US [2] estimates that in 2010 approximately 4280 pedestrians were killed in automobile related crashes and 70,000 injured. In addition, the Federal Highway Administration reports that intersection or intersection related fatalities comprised 20.8% of total automobile crash fatalities in 20091. And in North Carolina, the Highway Safety Research Center reports that approximately 2200 vehicle-pedestrian crashes occur yearly resulting in 150 - 200 deaths and 500 serious injuries2.
Although these statistics show low fatalities rates, pedestrians face disproportionately higher injury risks than motorists because they account for a small share of total trips [3,4]. Because of this, pedestrian safety continues to be important in transportation safety researches. While some of these researches identify demographic and economic factors [3,5], behavioral factors [6,7] and built environment and roadway characteristics [8-11] as explaining automobile-pedestrian conflicts, particularly at signalized intersections, others focus on intersection designs and evaluate the effectiveness of engineering countermeasures in increasing pedestrian safety [12,13]. Despite these efforts, injuries and deaths from automobile crashes continue to be high [14], and many factors that cause automobile crashes still remain less understood. In addition, the effectiveness of some engineering countermeasures remains unsettled in the transportation safety literature. For example, [15] noted that a universal approach to selecting the change interval for an all-red phase of a traffic light, or whether or not to use all-red phase in a traffic light at all is nonexistent. Similarly, [16] noted the lack of consensus in US regarding the effectiveness of marked cross-walks at locations without traffic signals or stop signs. This has led [17] to suggest that because it is difficult to generalize the findings in traffic safety literature to all localities, location-specific studies must be conducted to understand the factors that contribute to pedestrian injury severity.
Following this suggestion, this paper analyzes pedestrian injury severity from automobile crashes at signalized intersections in a medium-size city. The paper’s modest contribution to the transportation safety literature is in identifying some factors that increase pedestrian injury severity. In line with some earlier research such as [18,19] it finds that vehicle type, being female, institutional land-use, speed limit, presence of sidewalks and visual obstruction explain pedestrian injury severities in automobile crashes at signalized intersections. But, while the paper finds sizeable marginal effects of these variables on the probabilities of pedestrians sustaining no injury, possible and evident injuries, it does not provide strong support to show that disabling and fatal pedestrian injuries increase with increases in these variables. Rather, consistent with the small number of these injuries in the data, it finds very small marginal effects of some of these variables on disabling and fatal injuries. Furthermore, it finds that 76.6% of those involved in crashes at signalized intersections that cause pedestrian injuries are females, a finding which correlates with what [20] reported in their study.
The rest of the paper is organized as follows. The next section deals with literature review, and it is followed by methodology, data, estimation and results in that order. Next in order are the marginal effects, a discussion of the results and conclusion.
2. Literature
Two streams of literature on vehicle-pedestrian crashes can be identified. The first deals with the factors explaining these crashes, and the second with engineering countermeasures to control their occurrences. Among the first, [18] found more crashes in which pedestrians compared to drivers were at fault and disproportionately more males and elderly persons in these crashes. In addition, such behavioral factors as alcohol abuse, violations of traffic rules and regulations have been found to contribute to crashes involving pedestrians. For example, [21] reports that 48% of the automobile crashes in US in 2009 which resulted in pedestrian fatalities involved alcohol, and more pedestrians (35%) than drivers (13%) with blood-alcohol concentrations of 0.08 grams per deciliter or higher in these crashes. Additionally, [18] found alcohol and drug use by pedestrians and drivers led to more crashes at night than at any other time of the day. Other behavioral factors such as traffic signal violations, disregard of pedestrians and reckless driving also contribute to pedestrian crashes. In urban areas, for example, a noted reason for the high frequency of these crashes is that some drivers disregard traffic signals [18], drivers of turning vehicles do not yield to pedestrians during the pedestrian green phase [22], and male pedestrians tend to be distracted longer than females [6].
Besides these variables, road width, the presence of traffic signals and control measures, traffic flow and speed have been associated with vehicle-pedestrian conflicts. In [18] especially, frequent crashes in which pedestrians were at fault were associated with the widths of undivided roadways and intersections with only traffic signs. For traffic volume the evidence is mixed with these same authors finding that the chance of a vehiclepedestrian crash increases at intersections with higher traffic volumes, and [23] finding otherwise. Complementing these results, [24] found that wide roads are significantly less safe for pedestrians; locations with low speed limits are safer than expected for pedestrians; and locations with median speeds have higher risks of pedestrian crashes. Comparatively, a more heterogeneous vehicle speed increases the risk of crashes [23], and locations without traffic control devices or signs are positively associated with automobile crashes [24]. Crashes between pedestrians on conflicting cross-walks and leftturning or right-turning vehicles have also been found to be significantly related to both vehicle and pedestrian traffic volumes at intersections [25]. And according to [24] vehicle-pedestrian crashes occur in clear weather on dry roads between four o’clock in the afternoon and seven o’clock in the evening when drivers may be tired. Urban sprawl [26] and vehicle type [23] are additional factors which have been associated with these crashes.
While the above studies associate vehicle-pedestrian crashes with driver, pedestrian and traffic volumes, landuse and environmental characteristics, the second stream of research examines the effectiveness of existing traffic countermeasures such as crosswalk markings and pedestrian scramble lights in reducing vehicle-pedestrian conflicts. Reference [12] reviewed the extant literature on existing engineering counter-measures concluding that their effects in calming traffic speed to reduce vehiclepedestrian crashes were uncertain. However, they found significant decreases in pedestrian crashes when traffic signals were replaced by multi-way stop signs at intersections with low-traffic volumes. According to them, the installation of traffic signals at intersections with high speed limits significantly reduced conflicts, and traffic signs and pavement markings were effective in reducing pedestrian crashes at intersections. Another study, [6], found that all-red signals and clearance time cycle had positive impacts as countermeasures in reducing crashes involving pedestrians. Added to this are the results of [27] which showed that pedestrian scramble signals that give pedestrians exclusive clearance time at intersections significantly decreased the rate of vehicle-pedestrian conflicts. Although [24] found marked crosswalks to be safer at non-signalized locations than at signalized locations, in [12] crosswalk markings were largely ineffectual and sometimes harmful. However, in a later study on multilane roads with marked and unmarked crosswalks, lower rates of pedestrian crashes were associated with the existence of a raised median or crossing island [16]. Further, in comparison to multi-lane roads with no medians, multilane roads with painted (not raised) medians and center two-way left-turn lanes did not appear to have potentials for pedestrian safety. These results reveal that the impacts of marked versus unmarked crosswalks on two-lane roads in terms of pedestrian safety do not vary significantly, suggesting that crosswalk markings alone have little potential for protecting older pedestrians in auto crashes. These reviews do not show much consistency in results and suggest more work to be done to understand the factors contributing to pedestrian injury severity in automobile crashes at signalized intersections. However, they show that an analysis of vehicle pedestrian crashes at signalized intersections must include vehicle, intersection, driver, pedestrian and land-use characteristics.
3. Methodology
Using the variables discussed above, different methods are used in the traffic safety literature to study and analyze crashes and injury severity, and these methods differ according to whether the focus is on an analysis of crashes or injury severity. For those works that analyze crashes using count data, negative binomial, zero-inflated Poisson, and Poisson regression models are often used. For example, [23] used negative binomial regression in their analyses of slight injuries and the relationship between the factors contributing to crash occurrences and crash frequency respectively. Comparatively, [16,18,28] used Poisson regression in their work. For other works such as [29,30] where the focus is on the probability of an injury of a particular severity occurring, conditional and binary logit models have been used though the common methods exemplified in the works of [31-33] are ordered and multinomial probability models. Despite their widespread use, these two latter models have been critiqued extensively in the injury severity literature. Ordered models, for example, have been critiqued by [31- 33] as unable to handle interior solutions, and constrained to increase the probability of one level of injury while reducing the probabilities of others. Although multinomial logit models appear to solve the problems in ordered models well, they too are critiqued on the grounds that their constant terms can be very large and they give probability ratios which do not change even if another crash outcome is added. Further, they assume parallel slopes, and the signs and significance levels of their marginal effects and coefficients may be different. When such differences are found, [34] suggests using the coefficients for analysis because a marginal effect tests “hypothesis about a function of all the coefficients, not just the one of interest3.” Contrariwise, [35] suggests using an ordered model because it gives consistent signs and preserves inherent order in data.
Despite these problems, a recent evaluation of multinomial logit and ordered models by [31] using vehicle ownership data recommended multinomial logit models because they had the highest adjusted likelihood ratio test. The parallel regression tests of these authors suggested some variables whose coefficients should not remain the same in all equations as in ordered models and others which should. But, where data are ordered, they argue that failing to account for this order as multinomial logit (or multinomial probit) models do may lead to loss of efficiency, though not necessarily making the coefficients of the multinomial logit model biased.
The above discussion leads to the choice of an ordered logit model to study crash outcomes defined by the KABCO scale: killed (K-injury = 4), disabling injury (A-injury = 3) evident injury (B-injury = 2), possible injury (C-injury = 1) and no injury (O-injury = 0). Assume that the probability of a pedestrian sustaining a particular injury outcome given that a vehicle has crashed at a signalized intersection is a function of a set of variables consisting of pedestrian, driver, intersection, road and vehicle characteristics among others and let this set be represented by  where j is the number of variables. Further, let
  be the probability of a pedestrian sustaining a particular injury severity m in such an automobile crash,
  a continuous latent variable representing injury severity, and let the latent regression for injury severity be:
 (1)
(1)
where,  is a random error,
  is a latent variable representing pedestrian injury severity outcome m and the ordered observations of injury severity are generated as,
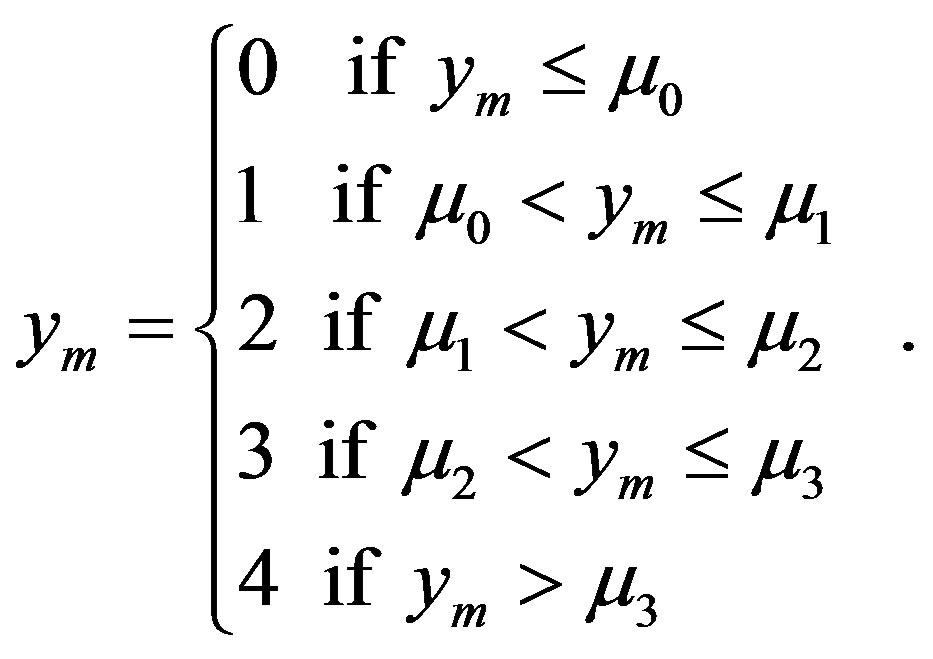 (2)
(2)
In Equation (2),  is a set of threshold parameters which are estimated together with the coefficients. If the error term
  is distributed as logistic then the conditional probability of observing an injury severity outcome from an automobile crash at a signalized intersection is,
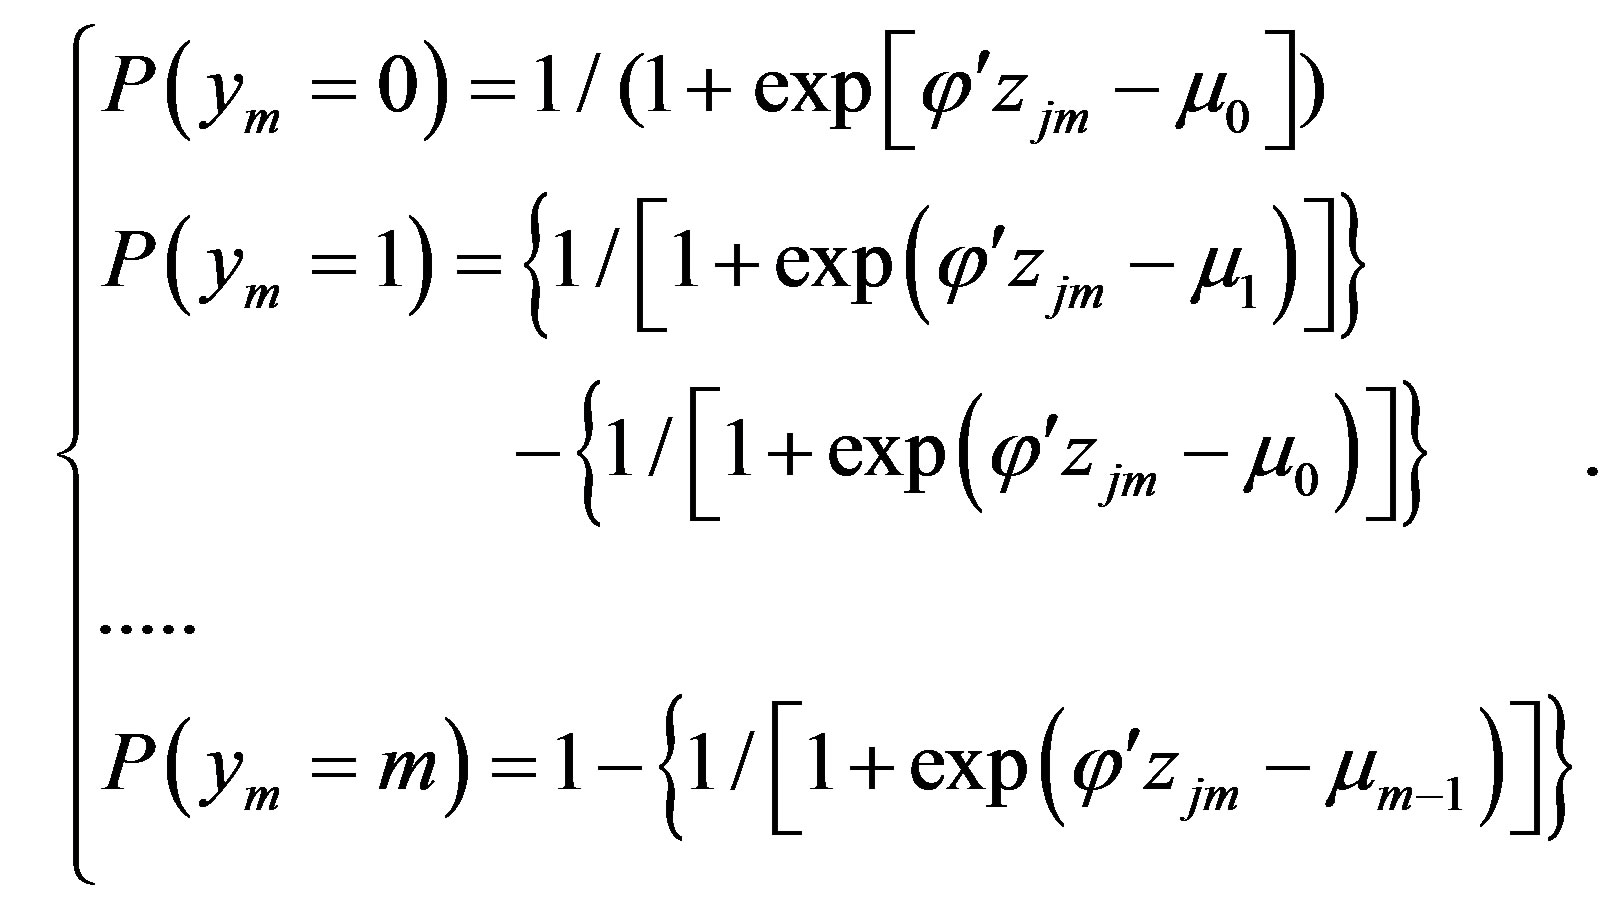 (3)
(3)
Because the ordered logit model is nonlinear, inferences about the effect of a variable on a particular type of pedestrian injury severity outcome is determined by its marginal effect which is calculated by,
 (4)
(4)
where  is a logistic density function. For a discrete variable its marginal effect is the difference between the probabilities when that variable takes a value of one less the corresponding probability when the same variable takes a value of zero. This marginal effect can be written as,
 (5)
(5)
where  is a discrete change in the probability of a particular pedestrian injury occurring when an automobile crash occurs at a signalized intersection,
  is this probability evaluated at when a binary variable whose coefficient is
  takes a value of one, and
  is the corresponding probability evaluated when the value of this binary variable is zero.
4. Data
It is the purpose of this research to estimate Equation (1) and calculate the marginal effects of the variables per Equations (2) or (3) using data for signalized intersections. The data is for Greensboro, North Carolina and consists of 69 crashes at signalized intersections involving 142 individuals. These crashes occurred from February 1999 to October 2005. Among the data are driver characteristics and condition, land use, vehicle type, environmental conditions and road and intersection characteristics. Others include vehicle occupants, types of injuries and crash location, number of vehicles involved, indications of alcohol and drug use. Still, others are detailed intersection data on amber and red times, presence of a sidewalk or a median and pedestrian crossing signal, number of lanes on each road, traffic volume and posted speed limit. Table 1 shows descriptive statistics about the data.
From this table 47.89% of the reported crashes had no pedestrian injury followed by 23.24%, 20.42% and
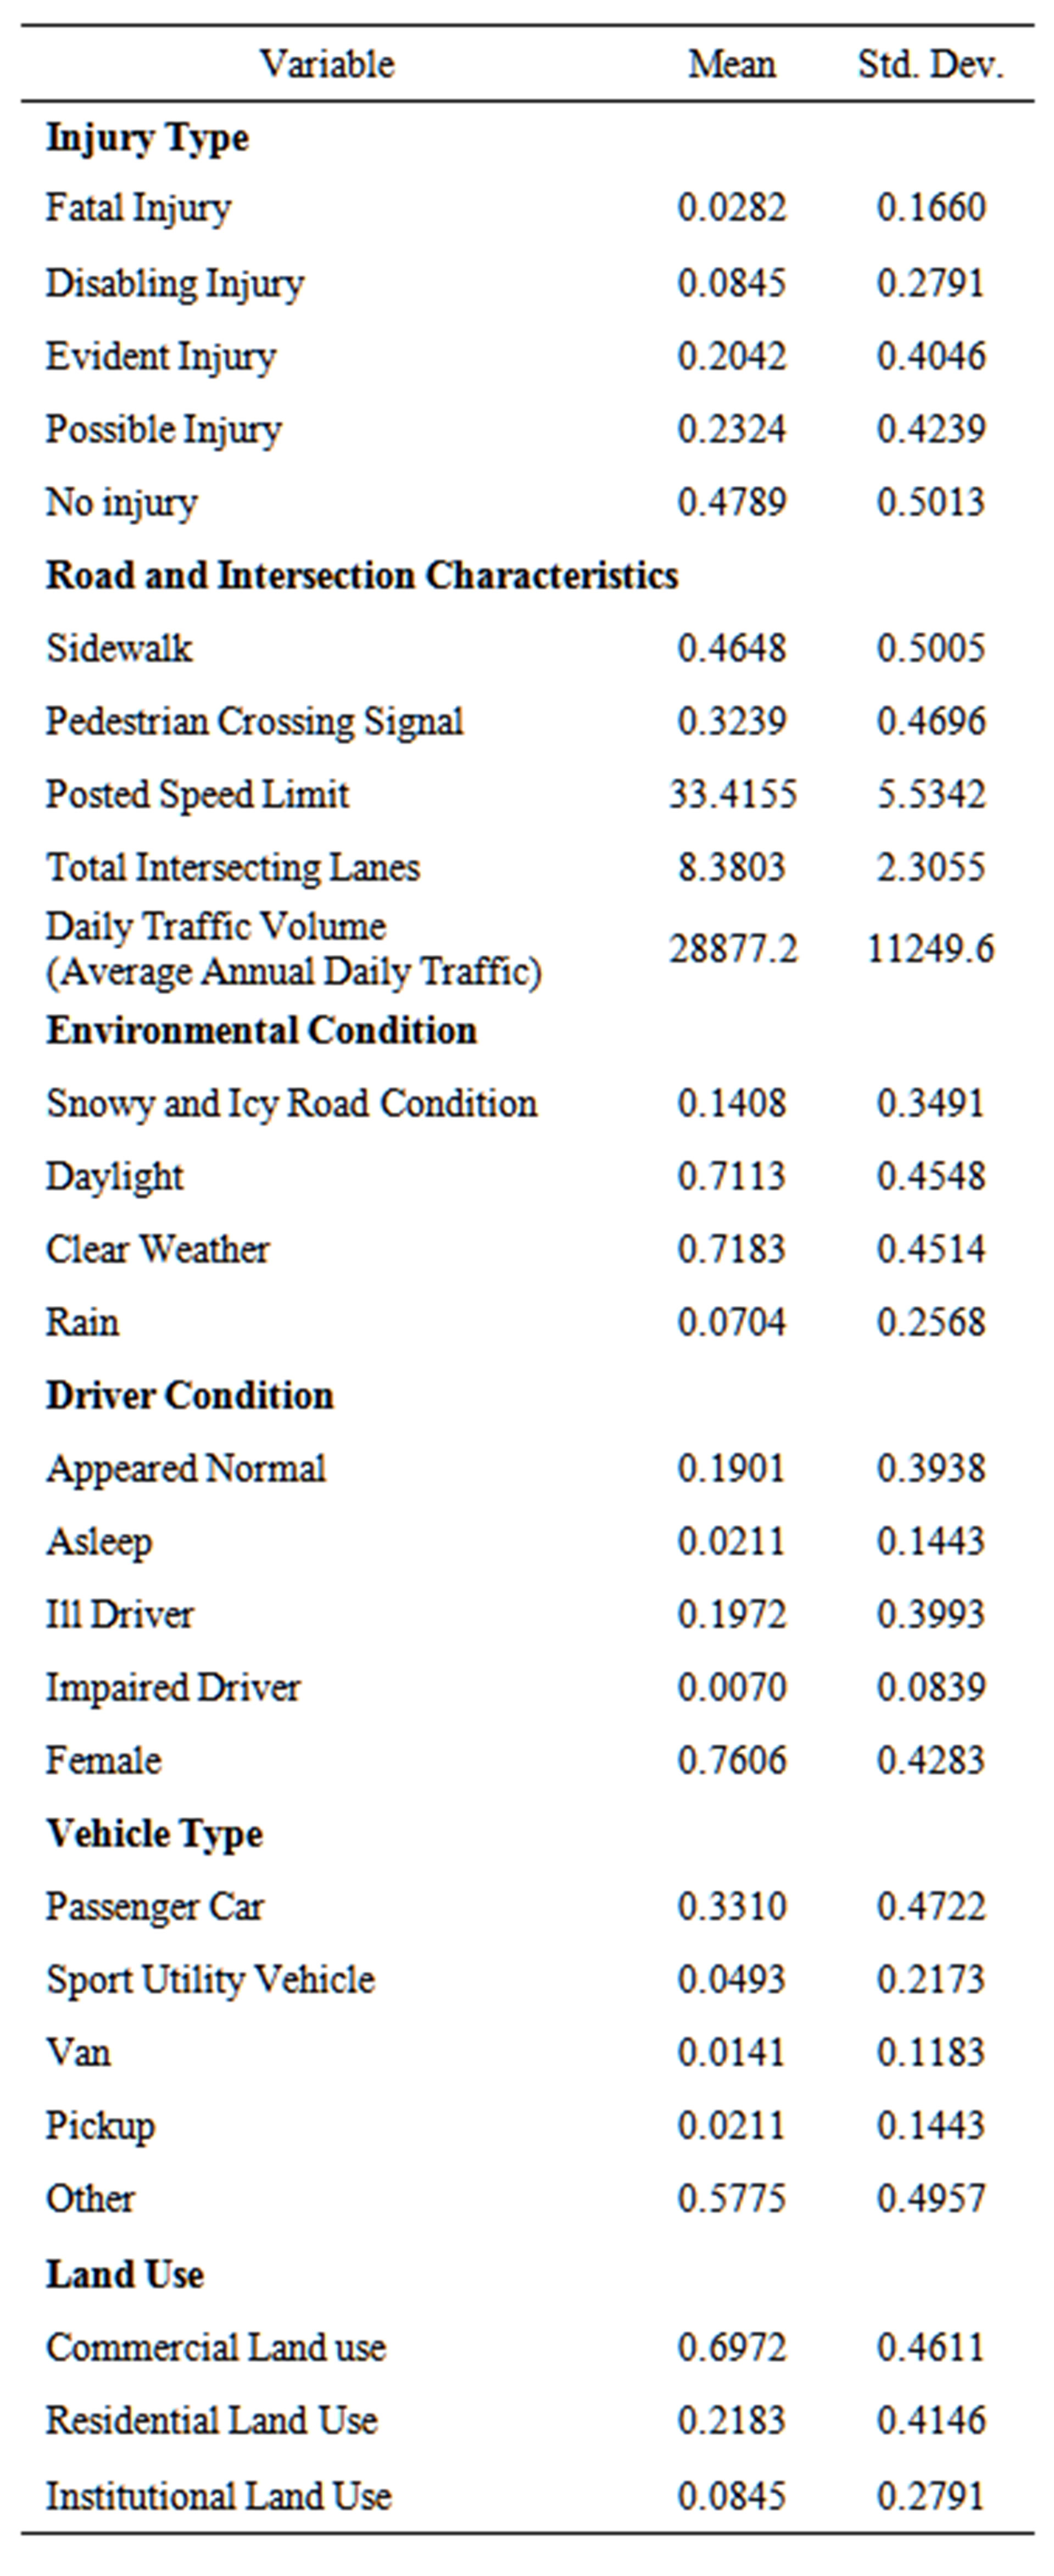
Table 1. Descriptive statistics.
8.45% which had possible, evident and disabling pedestrian injuries respectively; only 2.82% of the crashes were fatal injuries. Also, the data show that the crashes occurred at intersections with 8.38 lanes on the average and a combined average annual daily traffic volume of 28,877. This traffic volume gives a per lane average of 3607 vehicles per day. About 46.48% of the intersections had sidewalks, 32.39% had pedestrian crossing signals and posted speed limits averaged 33.42 miles per hour. Other information is that 71.13% of the pedestrian-related crashes occurred in daylight and 71.83% in clear weather. On the other hand 7.04% occurred on rainy days while 14.08% occurred when there were snow and ice on the roads. Also, 76.06% of those involved in the crashes were females4, and alcohol or drug impairment accounted for only 0.7% of the crashes, while driver ill health accounted for 19.72%. From the statistics 19.01% of the drivers were identified by the recording police officers as appearing normal. In addition passenger cars were involved in 33.10% of the crashes compared to sport utility vehicles’ 4.93%, and pickups’ 2.11%. These percentages show that 59.86% of the vehicles were trucks, buses, vans and other vehicles. Lastly 69.72% of the crashes occurred where the predominant land use was comercial, 21.83% occurred where it was residential and the rest 8.45% where it was institutional5.
5. Estimation and Results
Prior to estimating the model with the data just described pedestrian crash fatality is added to disabling (incapacitating) injury because there are only few of them. In addition traffic volume is the combined volume on all roads at a signalized intersection, and the number of lanes is the combined lanes on all intersecting roads. The logarithms of traffic volume and number of lanes are used in this study. Also, initial estimation that included red and amber times and the presence of a solid median yielded many insignificant coefficients. Consequently, these variables are excluded from the models.
Following the methodology outlined earlier, Table 2 shows the fit statistics and Table 3 the coefficients and marginal effects from the ordered logit model. Clearlythe model predicts the cell frequencies quite well for the injury severity except disabling and fatal injuries. Other fit statistics are: Akaike Information Criterion = 1.6995, McFadden R-Squared = 0.4155 and Chi-squared statistic . In Column 2, many of the coefficients are statistically significant, for example, traffic volume, visual obstruction, the presence of sidewalks and speed limit. Others whose coefficients are statistically significant include gender, passenger car, a sport utility vehicle, a pickup and institutional land-use. Factors such as road width, red-light camera, impaired driver, driver asleep, vehicle occupants and snowy and icy road conditions have statistically insignificant coefficients in this table.
Using the estimated coefficients, the last four columns of Table 2 show the marginal effects of the variables. Examining the crashes in which no pedestrian injury occurred, daily traffic volume per lane, the presence of a sidewalk, a unit increase in speed limit and being female reduce the probability of a pedestrian sustaining no injury in an intersection crash by varying amounts of 0.1009%, 9.02%, 0.1556% and 38.83% respectively. In comparison, when there is visual obstruction or when a passenger car, a sport utility vehicle or a pickup is involved in a crash at a signalized intersection, the results show increases in the probability of a pedestrian sustaining no injury by 6.85%, 21.74%, 13.83%, 7.77% and 7.52% respectively. Similarly, the probability of a pedestrian sustaining no injury increases by 7.52% when such a crash occurs by an institutional land use such as a school. Perhaps this is due to drivers exercising extra caution in those areas, the low posted speed limits usually there, and possible strict police enforcement of speed limits near schools.
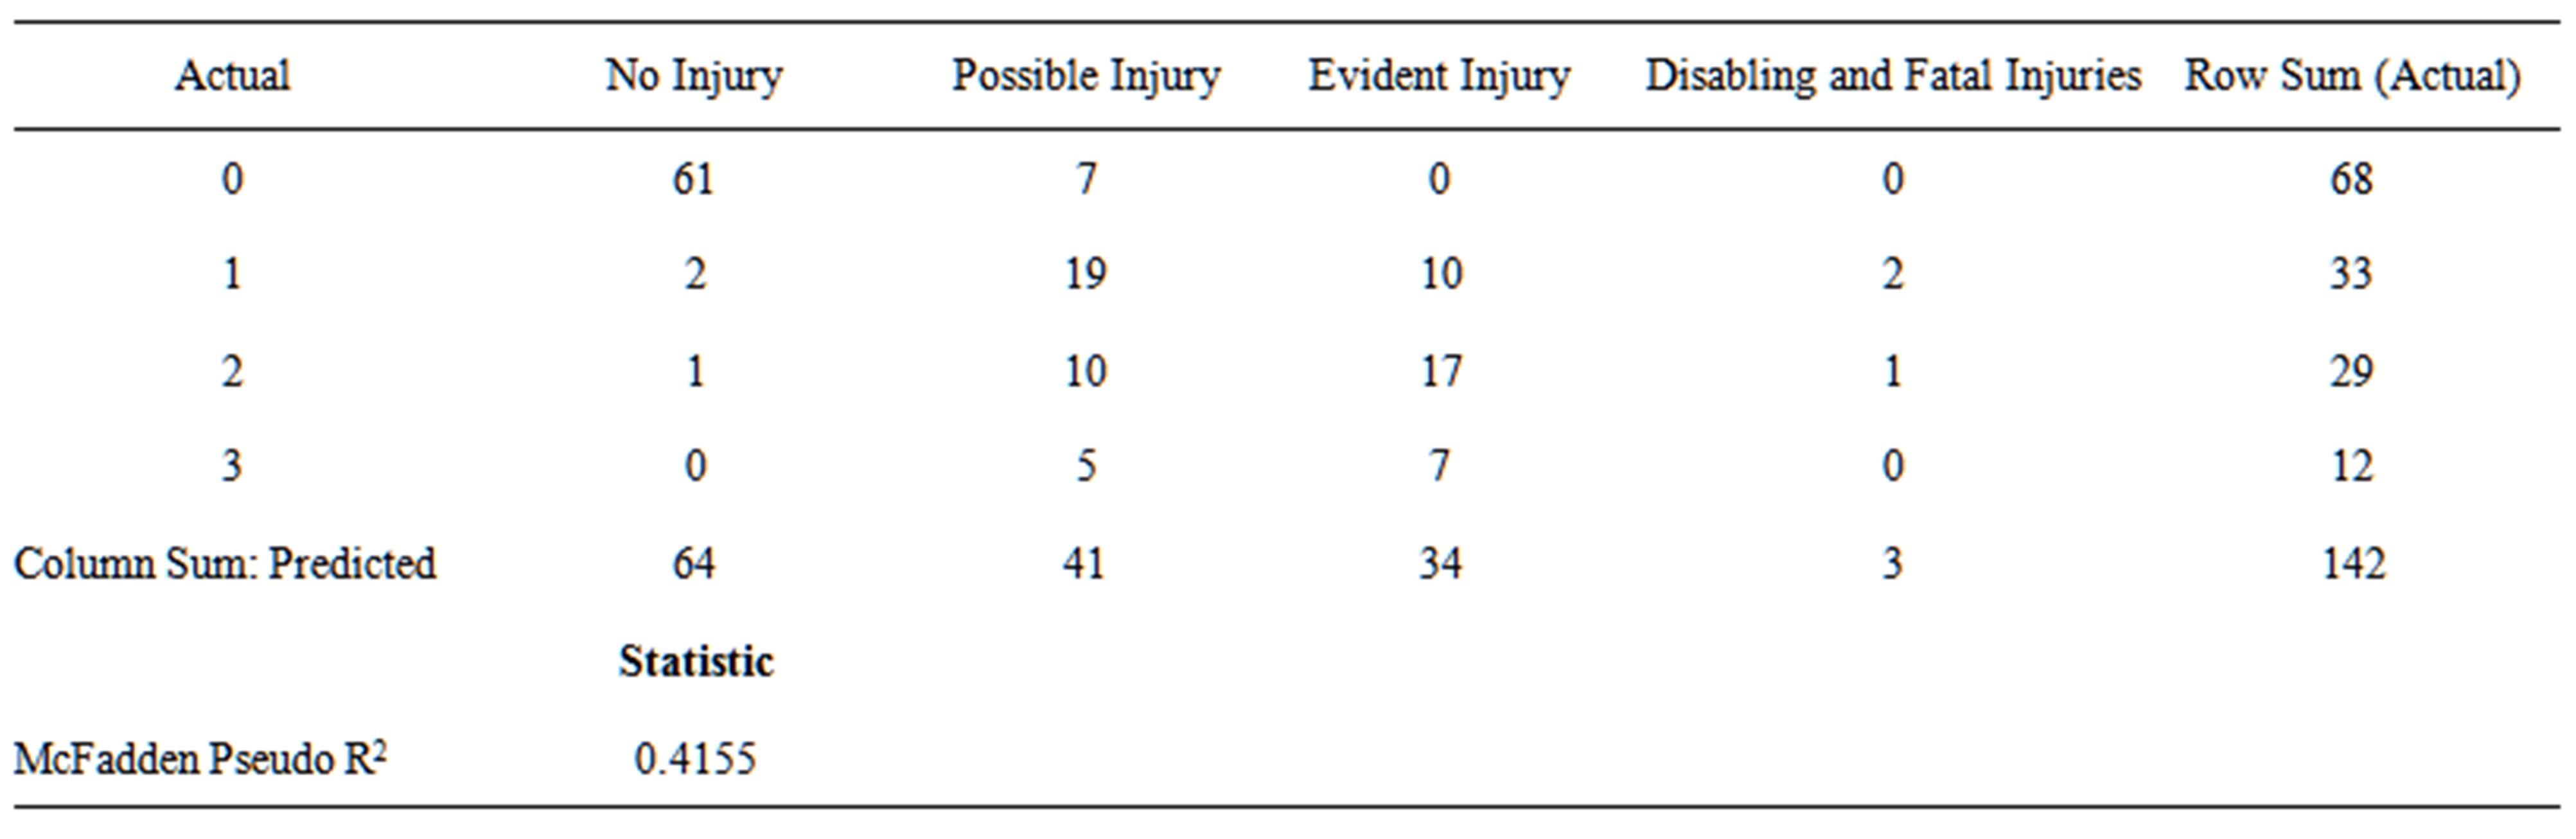
Table 2. Actual vs. predicted outcomes.
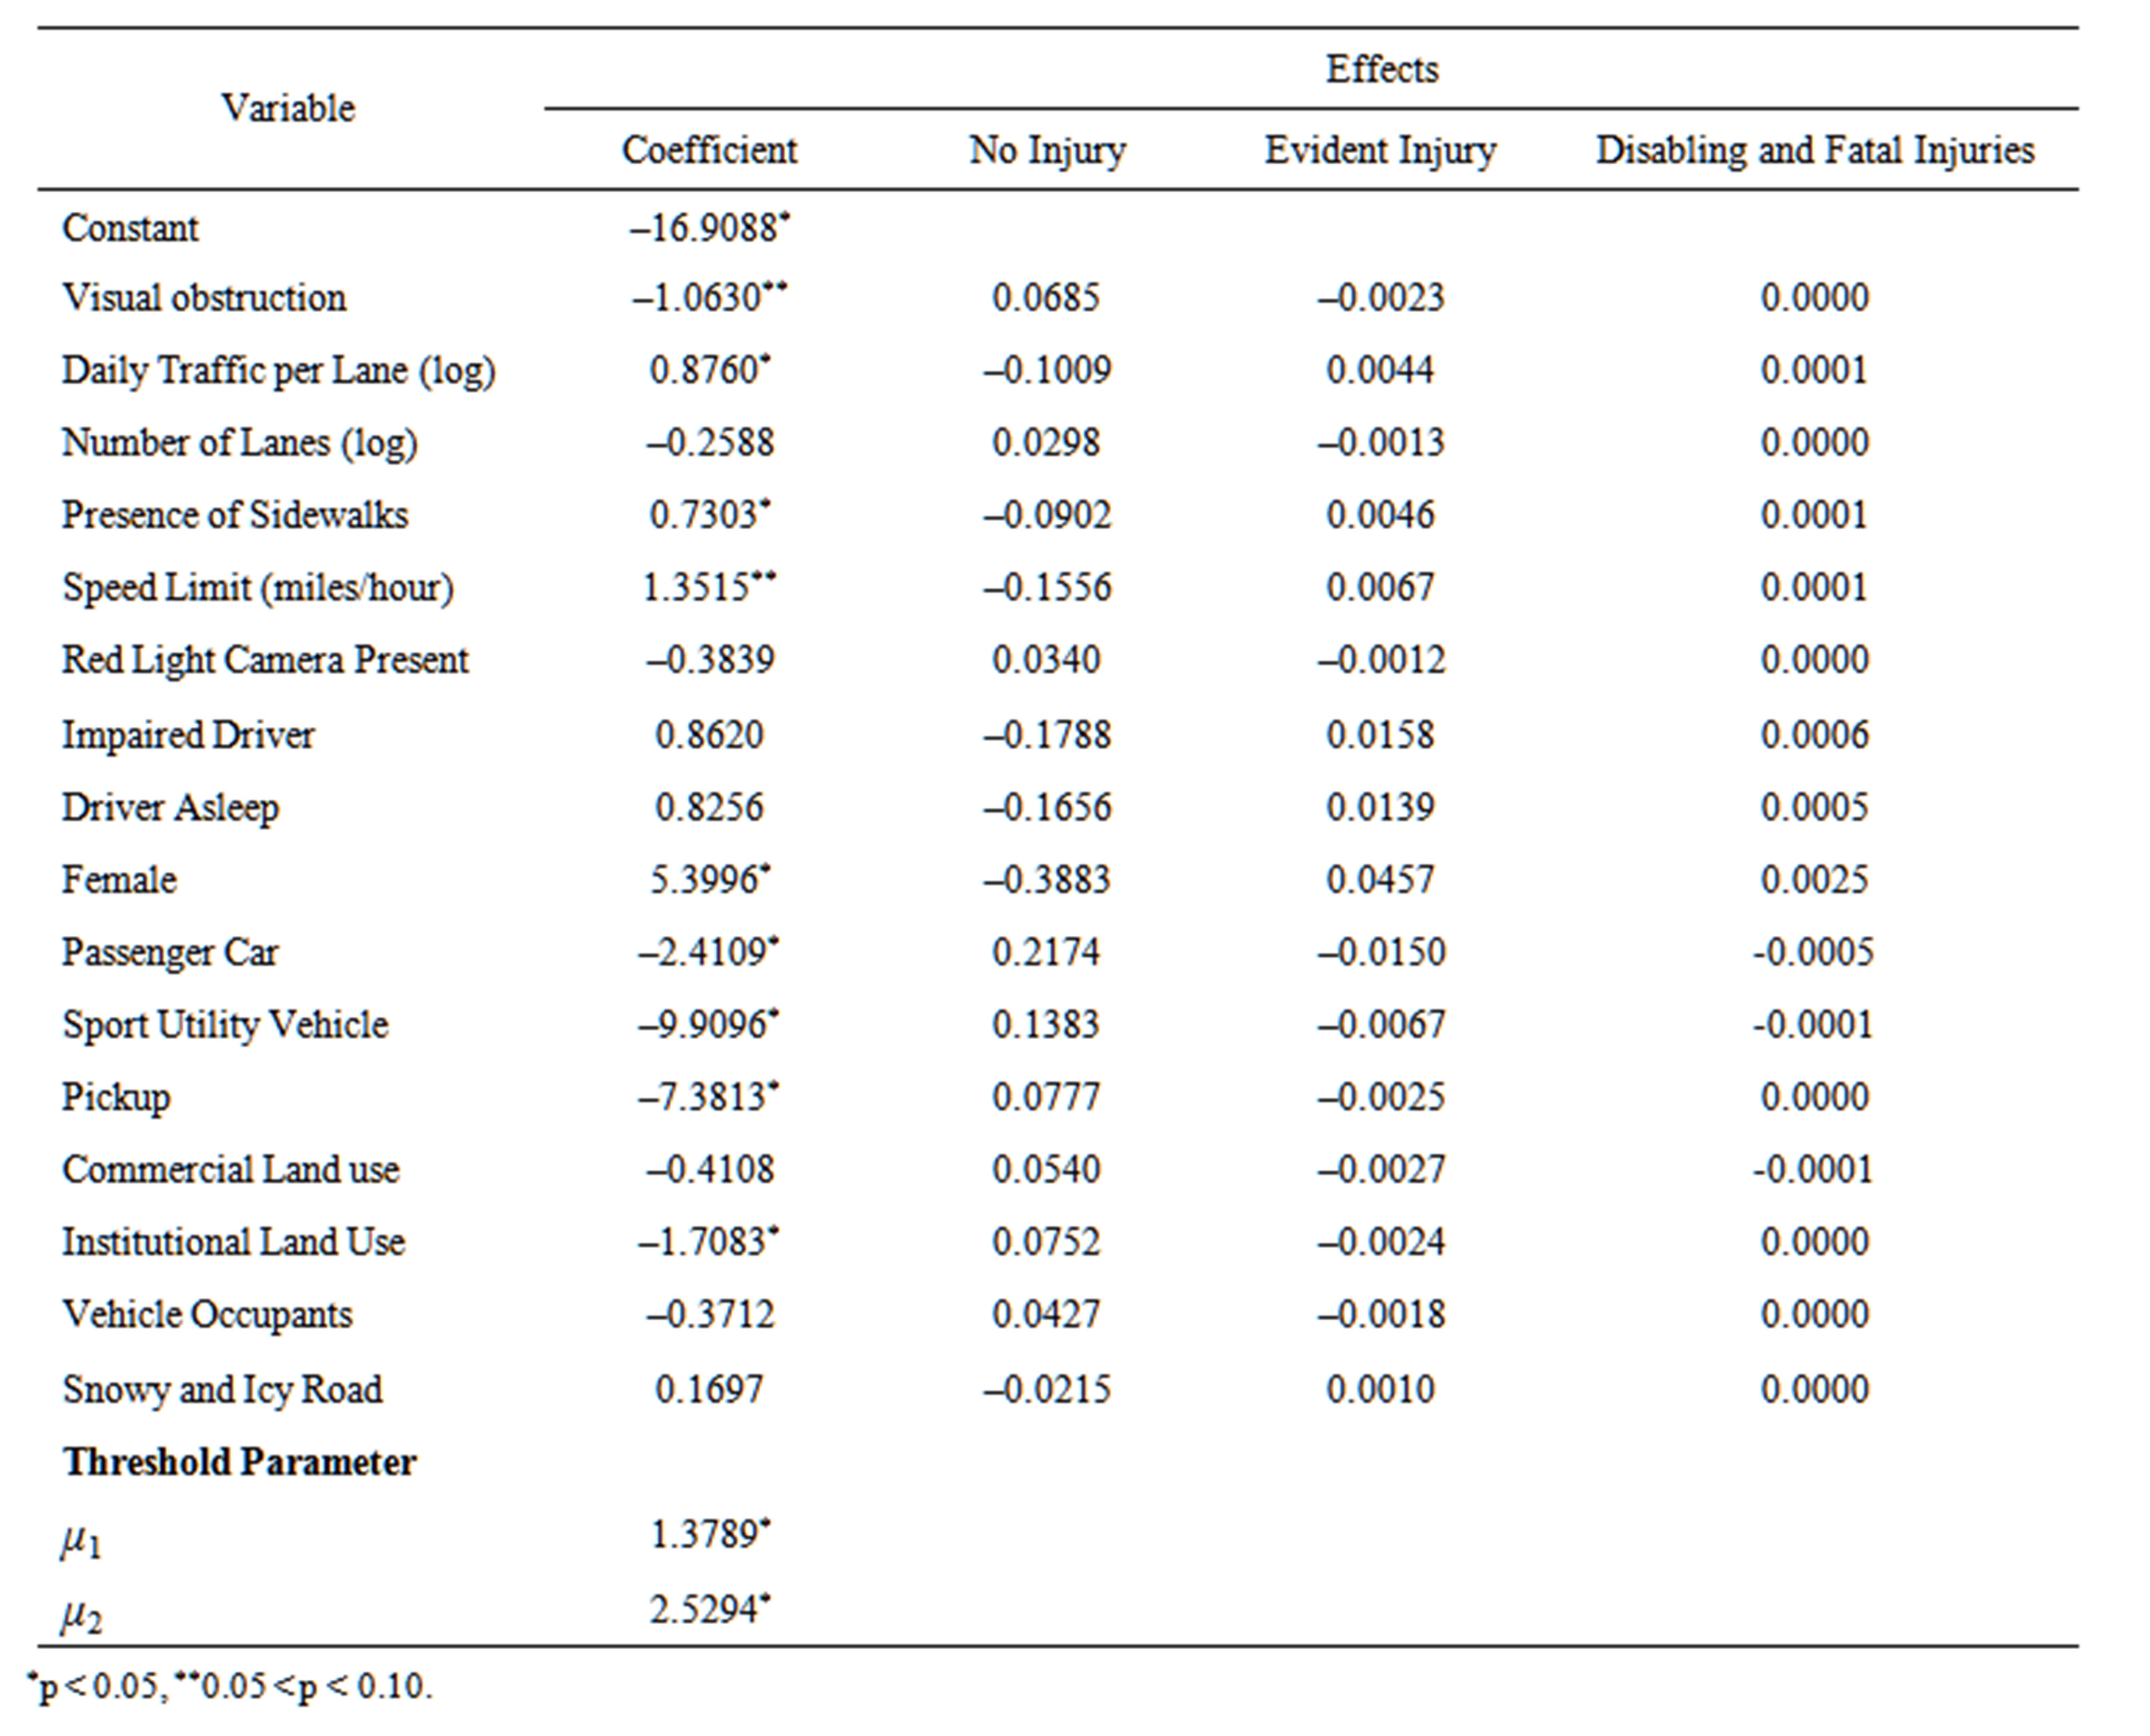
Table 3. Ordered logit results.
These strong marginal effects extend to crashes in which a pedestrian suffers possible injury. In this case an increase in traffic volume per lane increases the probability of a pedestrian suffering a possible injury outcome by 0.0964% compared to 8.55% when there is a sidewalk at an intersection, and 34.01% when a female is involved in such a crash. In addition a unit increase in speed limit increases possible injury by 0.1488%. But, when a crash involves a passenger car, sport utility vehicle or pickup, the marginal effect is a reduction in possible injury by 20.19%, 13.15% and 7.52% respectively, compared to a reduction of 7.27% when the crash is at a signalized intersection where the predominant land use is institutional and a 6.62% reduction from visual obstruction.
In comparison, the marginal effects of the variables with statistically significant coefficients are small for the probability of a pedestrian sustaining evident injury. Here, a percent increase in traffic volume, the presence of a sidewalk, an increase in speed limit or being female increases the probability of a pedestrian sustaining evident injury by 0.0044%, 0.46%, 0.0067% and 4.57% respectively. Contrariwise, reflecting the extra care drivers take in areas they perceive to be susceptible to vehicle-pedestrian crashes, visual obstruction is associated with a reduction of 0.23% in the probability of evident injury, whereas when a crash involves a passenger car, sport utility vehicle, or pickup, the probability of evident injury reduces by 1.5%, 0.67% and 0.25% respectively. Also, there is a reduction of 0.24% in the probability of evident injury when such a crash is at where the predominant land use is institutional.
For the more serious injuries, that is disabling and fatal injuries, Table 2 shows extremely small marginal effects of the variables on the probability of a pedestrian suffering them in these crashes. But, it does not provide evidence that these injuries increase if the cause of a crash is visual obstruction, if a pickup is involved in a crash or if a crash occurs where the predominant land use is institutional. However, it shows negligible increases of 0.01%, 0.0001% and 0.01% in the probabilities of disabling and fatal injuries respectively from unit increases in traffic volume and speed limit, and when a sidewalk is present. The largest increase in this probability of 0.25% comes from being female compared to reductions of 0.05% and 0.01% respectively from a passenger car or a sport utility vehicle being involved in a similar crash.
6. Discussion
From Table 2, there is no variable whose marginal effect is negative or consistently positive across all pedestrian injury outcomes, and the marginal effects are stronger in the no injury and possible injury outcomes than they are in the other injury outcomes. In line with what [18] found, Table 2 shows that gender, intersection and traffic characteristics and vehicle type strongly affect pedestrian injury outcomes, and less severe pedestrian injuries occur if a crash is at a traffic light located where the land use is institutional. Particularly, there is a reduction in pedestrian evident injury and no effect on disabling and fatal injuries in crashes at signalized intersections near or at where the predominant land use is institutional. The corollary of this finding is that more severe pedestrian injuries occur in vehicle-pedestrian crashes at intersections where the land use is not institutional but may be commercial or residential. If so, then this finding is supported indirectly by [19] whose results show that the presence of a commercial land use increases fatal and possible injuries by 14% because of increased vehicle-pedestrian conflicts and traffic flow, as well as by [36]. However, it contradicts the results in [3] that showed negative effects of residential and commercial land uses on vehicle-pedestrian crashes and explained them as motorists being conscious and attentive when driving through those areas because they expect pedestrians. This finding could be attributed to lower speed limits and increased police enforcement of speed limits, as well as to generally cautious driver behaviors near institutional land uses particularly schools.
Of significance too is that 76.06% of those involved in the vehicle-pedestrian crashes studied are female drivers and pedestrians. This correlates very much with [20]’s result that more females than males are involved in vehicle-pedestrian crashes at signalized intersections. While there are many explanations for this finding in the traffic safety literature, possibly it is that females walk more than men do [37] and this increases their exposures to vehicle-pedestrian conflicts. Additionally, serious injuries categorized as evident, disabling and fatal are observed when these crashes involve females. Thus, not only are disproportionately more females than males involved in these crashes but the injuries they sustain are most severe. And, per the results, these injuries occur where signalized intersections have sidewalks suggesting as in [38] that while sidewalks are important, they increase pedestrian traffic volume and concentrate pedestrians at signalized intersections thereby increasing their probabilities of sustaining injuries in vehicle-pedestrian conflicts. To reduce such conflicts could involve ways of channeling pedestrians to physically separate them from road traffic at or near signalized intersections.
This channelization may be combined with speed control strategies since as found, an increase in posted speed limit increases severe pedestrian injuries in crashes at signalized intersections. The benefits of such strategies are exemplified in the work by [39] which found 20% reduction in pedestrian casualties and 25% decrease in pedestrian fatalities when speed was reduced from 60 to 50 kilometers per hour. Similarly, [18,24,40] found a higher speed/speed limit is related to higher pedestrian injury severity, suggesting that lowering posted speed limits could reduce pedestrian injury severities. Alternatively, the possibility of disallowing pedestrian crossings at some wide signalized intersections especially where speed limits are high should be considered as a countermeasure. This, in fact, has been suggested by [40] for roads with high speeds and a substantial mix of vehicles, and where the proportion of heavy trucks is high.
In terms of the types of vehicles involved in the crashes, Table 2 shows that pedestrian injury severity level reduces when a passenger car or a sport utility vehicle is involved in a crash at a signalized intersection. On the other hand the results show that pickups have no effect on disabling and fatal injury outcome. Though the effect of sport utility vehicles is inconsistent with what [19] reports, the finding that trucks, vans and buses cause more severe pedestrian injuries in crashes than other vehicles confirms many earlier researches in the traffic safety literature. For example, [18] reports similar results in their Florida study and explain them as due to these vehicles hitting a large area of the human body in crashes. Reference [41] adds that light trucks, vans and sport utility vehicles result in higher injury severity risks, while to [19] these trucks increase fatal injuries because of their larger masses, longer stopping distances and greater momentum. Although [42] found similarly, they add that the front-end designs of these vehicles contribute to pedestrian injuries in crashes as well.
7. Conclusion
This paper analyzes pedestrian injury severity outcomes in automobile crashes that occur at signalized intersections to identify its statistically significant correlates. It uses data and a small sample from a medium-size city, estimates an ordered logit model of injury severity outcomes and finds that vehicle type, gender, land-use and some road and intersection characteristics such as speed limit, traffic volume and the presence of sidewalks, as well as visual obstruction significantly explain pedestrian injury outcomes. In particular, female drivers and pedestrians are found to be disproportionately involved in crashes at intersections that involve pedestrians. And, the presence of a sidewalk at an intersection is found to increase the probability of a pedestrian sustaining a disabling or fatal injury in an automobile crash as passenger cars, sport utility vehicles and pickups which are found to be associated with less severe pedestrian injuries in these crashes. Comparing these results to those from previous research, some consistencies and deviations are observed. For example, the finding that more females than males are involved in these crashes is inconsistent with what [24] found whereas the finding that road, intersection and traffic characteristics as well as land use affect these crashes is consistent with the results in [24] among others. Additionally, the finding that passenger cars, sport utility vehicles and vans cause less injury in these crashes is consistent with what previous research found. Where inconsistencies prevail, they show that these effects are contextual and that likely differences in results would obtain if city compared to state or national data are used. This means that caution must be exercised in extending the results from national or state data to local levels and vice versa.
REFERENCES
- World Health Organization, “Global Status Report on Road Safety: Time for Action,” Geneva, 2009. www.who.int/violence_injury_prevention/road_safety_status/2009
- US Department of Transportation, “2010 Motor Vehicle Crashes: Overview,” Traffic Safety Facts: Research Note. National Highway Safety Administration, Washington DC, 2012, pp. 1-6.
- S. S. Pulugurtha and V. R. Sambhara, “Pedestrian Crash Estimation Models for Signalized Intersections,” Accident Analysis & Prevention, Vol. 43, No. 1, 2011, pp. 439-446. doi:10.1016/j.aap.2010.09.014
- R. Elvik, “The Non-Linearity of Risk and the Promotion of Environmentally Sustainable Transport,” Accident Analysis & Prevention, Vol. 41, No. 4, 2009, pp. 849-855. doi:10.1016/j.aap.2009.04.009
- E. A. LaScala, D. Gerber and P. J. Gruenewald, “Demographic and Environmental Correlates of Pedestrian Injury Collisions: A Spatial Analysis,” Accident Analysis & Prevention, Vol. 32, No. 5, 2000, pp. 651-658. doi:10.1016/S0001-4575(99)00100-1
- T. Fugger, B. Randles, A. Stein, W. Whiting and B. Gallagher, “Analysis of Pedestrian Gait and Perception-Reaction at Signal-Controlled Crosswalk Intersections,” Transportation Research Record: Journal of the Transportation Research Board, Vol. 1705, No. 1, 2000, pp. 20-25.
- J.-K. Kim, G. F. Ulfarsson, V. N. Shankar and S. Kim, “Age and Pedestrian Injury Severity in Motor-Vehicle Crashes: A Heteroskedastic Logit Analysis,” Accident Analysis & Prevention, Vol. 40, No. 5, 2008, pp. 1695-1702. doi:10.1016/j.aap.2008.06.005
- K. J. Clifton, C. V. Burnier and G. Akar, “Severity of Injury Resulting from Pedestrian-Vehicle Crashes: What Can We Learn from Examining the Built Environment?” Transportation Research Part D: Transport and Environment, Vol. 14, No. 6, 2009, pp. 425-436. doi:10.1016/j.trd.2009.01.001
- S. Ukkusuri, L. F. Miranda-Moreno, G. Ramadurai and J. Isa-Tavarez, “The Role of Built Environment on Pedestrian Crash Frequency,” Safety Science, Vol. 50, No. 4, 2012, pp. 1141-1151. doi:10.1016/j.ssci.2011.09.012
- L. F. Miranda-Moreno, P. Morency and A. M. El-Geneidy, “The Link between Built Environment, Pedestrian Activity and Pedestrian-Vehicle Collision Occurrence at Signalized Intersections,” Accident Analysis & Prevention, Vol. 43, No. 5, 2011, pp. 1624-1634. doi:10.1016/j.aap.2011.02.005
- M. Wier, J. Weintraub, E. H. Humphreys, E. Seto and R. Bhatia, “An Area-Level Model of Vehicle-Pedestrian Injury Collisions with Implications for Land Use and Transportation Planning,” Accident Analysis & Prevention, Vol. 41, No. 1, 2009, pp. 137-145. doi:10.1016/j.aap.2008.10.001
- R. A. Retting, S. A. Ferguson and A. T. McCartt, “A Review of Evidence-Based Traffic Engineering Measures Designed to Reduce Pedestrian-Motor Vehicle Crashes,” American Journal of Public Health, Vol. 93, No. 9, 2003, pp. 1456-1463.
- B. Persaud, E. Hauer, R. Retting, R. Vallurupalli and K. Mucsi, “Crash Reductions Related to Traffic Signal Removal in Philadelphia,” Accident Analysis & Prevention, Vol. 29, No. 6, 1997, pp. 803-810. doi:10.1016/S0001-4575(97)00049-3
- K. Kim, I. M. Brunner and E. Yamashita, “Modeling Violation of Hawaii’s Crosswalk Law,” Accident Analysis & Prevention, Vol. 40, No. 3, 2008, pp. 894-904. doi:10.1016/j.aap.2007.10.004
- R. A. Retting, J. F. Chapline and A. F. Williams, “Changes in Crash Risk Following Re-Timing of Traffic Signal Change Intervals,” Accident Analysis & Prevention, Vol. 34, No. 2, 2002, pp. 215-220. doi:10.1016/S0001-4575(01)00016-1
- C. V. Zegeer, C. T. Esse, J. R. Stewart, H. F. Huang and P. Lagerwey, “Safety Analysis of Marked Versus Unmarked Crosswalks in 30 Cities,” ITE Journal, Vol. 74, No. 1, 2004, pp. 34-41.
- G. F. Ulfarsson, S. Kim and K. M. Booth, “Analyzing Fault in Pedestrian-Motor Vehicle Crashes in North Carolina,” Accident Analysis & Prevention, Vol. 42, No. 6, 2010, pp. 1805-1813. doi:10.1016/j.aap.2010.05.001
- C. Lee and M. Abdel-Aty, “Comprehensive Analysis of Vehicle-Pedestrian Crashes at Intersections in Florida,” Accident Analysis & Prevention, Vol. 37, No. 4, 2005, pp. 775-786. doi:10.1016/j.aap.2005.03.019
- J.-K. Kim, G. F. Ulfarsson, V. N. Shankar and F. L. Mannering, “A Note on Modeling Pedestrian-Injury Severity in Motor-Vehicle Crashes with the Mixed Logit Model,” Accident Analysis & Prevention, Vol. 42, No. 6, 2010, pp. 1751-1758. doi:10.1016/j.aap.2010.04.016
- A. Waylen and R. Mckenna, “Cradle Attitudes-Grave Consequences—The Development of Greater Differences in Risky Attitudes and Behaviour in Road Use,” AA Foundation for Road Safety, Basingstoke, 2002.
- US Department of Transportation, “Alcohol-Impaired Driving,” Traffic Safety Facts: 2009 Data, National Highway Safety Administration, Washington DC, 2009, pp. 1-6.
- V. P. Sisiopiku and D. Akin, “Pedestrian Behaviors at and Perceptions Towards Various Pedestrian Facilities: An Examination Based on Observation and Survey Data,” Transportation Research Part F: Traffic Psychology and Behaviour, Vol. 6, No. 4, 2003, pp. 249-274. doi:10.1016/j.trf.2003.06.001
- S. C. Wong, N. N. Sze and Y. C. Li, “Contributory Factors to Traffic Crashes at Signalized Intersections in Hong Kong,” Accident Analysis & Prevention, Vol. 39, No. 6, 2007, pp. 1107-1113. doi:10.1016/j.aap.2007.02.009
- P. E. Gårder, “The Impact of Speed and Other Variables on Pedestrian Safety in Maine,” Accident Analysis & Prevention, Vol. 36, No. 4, 2004, pp. 533-542. doi:10.1016/S0001-4575(03)00059-9
- L. Leden, “Pedestrian Risk Decrease with Pedestrian Flow. A Case Study Based on Data from Signalized Intersections in Hamilton, Ontario,” Accident Analysis & Prevention, Vol. 34, No. 4, 2002, pp. 457-464. doi:10.1016/S0001-4575(01)00043-4
- R. Ewing, R. A. Schieber and C. V. Zegeer, “Urban Sprawl as a Risk Factor in Motor Vehicle Occupant and Pedestrian Fatalities,” American Journal of Public Health, Vol. 93, No. 9, 2003, pp. 1541-1545. doi:10.2105/AJPH.93.9.1541
- A. Bechtel, K. MacLeod and D. Ragland, “Pedestrian Scramble Signal in Chinatown Neighborhood of Oakland, California: An Evaluation,” Transportation Research Record: Journal of the Transportation Research Board, Vol. 1878, No. 1, 2004, pp. 19-26.
- V. N. Shankar, G. F. Ulfarsson, R. M. Pendyala and M. B. Nebergall, “Modeling Crashes Involving Pedestrians and Motorized Traffic,” Safety Science, Vol. 41, No. 7, 2003, pp. 627-640. doi:10.1016/S0925-7535(02)00017-6
- T. Koepsell, L. McCloskey, M. Wolf, A. V. Moudon, D. Buchner, J. Kraus and M. Patterson, “Crosswalk Markings and the Risk of Pedestrian—Motor Vehicle Collisions in Older Pedestrians,” JAMA: The Journal of the American Medical Association, Vol. 288, No. 17, 2002, pp. 2136-2143. doi:10.1001/jama.288.17.2136
- S. M. L. Hubbard, D. M. Bullock and F. L. Mannering, “Right Turns on Green and Pedestrian Level of Service: Statistical Assessment,” Journal of Transportation Engineering, Vol. 135, No. 4, 2009, pp. 153-159. doi:10.1061/(ASCE)0733-947X(2009)135:4(153)
- D. Potoglou and Y. O. Susilo, “Comparison of VehicleOwnership Models,” Transportation Research Record: Journal of the Transportation Research Board, Vol. 2076, 2008, pp. 97-105. doi:10.3141/2076-11
- S. Islam and F. Mannering, “Driver Aging and Its Effect on Male and Female Single-Vehicle Accident Injuries: Some Additional Evidence,” Journal of Safety Research, Vol. 37, No. 3, 2006, pp. 267-276. doi:10.1016/j.jsr.2006.04.003
- K. Obeng, “Gender Differences in Injury Severity Risks in Crashes at Signalized Intersections,” Accident Analysis & Prevention, Vol. 43, No. 4, 2011, pp. 1521-1531. doi:10.1016/j.aap.2011.03.004
- W. H. Greene, “Limdep Version 9.0: Econometric Modeling Guide Vol. 2,” 2007.
- P. Wang, “Financial Econometrics,” 2nd Edition, Routledge, New York, 2009.
- A. Loukaitou-Sideris, R. Liggett and H.-G. Sung, “Death on the Crosswalk,” Journal of Planning Education and Research, Vol. 26, No. 3, 2007, pp. 338-351. doi:10.1177/0739456X06297008
- C. Ross and D. Hayes, “Exercise and Psychologic WellBeing in the Community,” American Journal of Epidemiology, Vol. 127, No. 4, 1988, pp. 762-771.
- R. J. Schneider, M. R. Rhonda and J. K. Asad, “An Accident Waiting to Happen: A Spatial Approach to Proactive Pedestrian Planning,” Accident Analysis & Prevention, Vol. 36, No. 2, 2004, pp. 193-211. doi:10.1016/S0001-4575(02)00149-5
- F. H. Walz, M. Hoefliger and W. Fehlmann, “Speed Limit Reduction from 60 to 50 Km/H and Pedestrian Injuries,” Paper presented at the Twenty-Seventh Stapp Car Crash Conference Proceedings with International Research Council on Biokinetics of Impacts (IRCOBI), Society of Automotive Engineers, Warrendale, 1983.
- N. Eluru, R. B. Chandra and D. A. Hensher, “A Mixed Generalized Ordered Response Model for Examining Pedestrian and Bicyclist Injury Severity Level in Traffic Crashes,” Accident Analysis & Prevention, Vol. 40, No. 3, 2008, pp. 1033-1054. doi:10.1016/j.aap.2007.11.010
- B. S. Roudsari, C. N. Mock, R. Kaufman, D. Grossman, B. Y. Henary and J. Crandall, “Pedestrian Crashes: Higher Injury Severity and Mortality Rate for Light Truck Vehicles Compared with Passenger Vehicles,” Traffic Injury Prevention, Vol. 10, No. 3, 2004, pp. 154-158. doi:10.1136/ip.2003.003814
- M. F. Ballesteros, C. D. Patricia and P. Langenberg, “Pedestrian Injuries and Vehicle Type in Maryland, 1995- 1999,” Accident Analysis & Prevention, Vol. 36, No. 1, 2004, pp. 73-81. doi:10.1016/S0001-4575(02)00129-X
NOTES
1Federal Highway Administration. “Intersection Safety.” http://safety.fhwa.dot.gov/intersection/ (Accessed 4/22/2012).
2Highway Safety Research Center. “North Carolina Pedestrian Crash Statistics.” http://www.hsrc.unc.edu/safety_info/pedestrian/nc_crash_stats.cfm (Accessed 4/22/2012).
3See Greene W. “Discrete Choice Modeling.” http://people.stern.nyu.edu/wgreene/DiscreteChoiceSurvey.pdf (Accessed February 23, 2012).

4Although this percentage is quite high, several checks of the data confirmed it is correct. These are drivers and pedestrians.
5The data did not contain information on age.