Open Journal of Ecology
Vol.05 No.07(2015), Article ID:57764,11 pages
10.4236/oje.2015.57023
Ecological Devastation in Lake Victoria: Part A: Thermal Structure and Anoxia
Moshe Gophen
Migal-Scientific Institute, Kiryat Shemone, Israel
Email: Gophen@Migal.org.il
Copyright © 2015 by author and Scientific Research Publishing Inc.
This work is licensed under the Creative Commons Attribution International License (CC BY).
http://creativecommons.org/licenses/by/4.0/


Received 18 May 2015; accepted 4 July 2015; published 7 July 2015
ABSTRACT
Lake Victoria is the second (excl.
Keywords:
Lake Victoria, Kenya, Nile Perch, Anoxia, Thermal Stability

1. Introduction
Lake Victoria is the second (excl. Caspian Sea) largest lake in the world by surface area and 7th by Volume: Maximum Length― 337 km and Maximum Breadth― 250 km . The lake is located at an altitude of 1134 m above mean sea level and latitude between 0˚20
Direct rain contribute 85% of total water input, the rest is coming from inflow rivers. Evaporation accounts for 85% of the outputs. The impact of upwelling and mixing on nutrient supply is significant. Grazing, physi-

Table 1. Limnological features and the Kenyan utilization measures of Lake Victoria.
cal conditions (light penetration, thermal structure), bottom-up and atmospheric sources of nutrients are controlling phytoplankton development. At the end of the 1950’s and early 1960’s specimens of the piscivore Nile Perch (Lates niloticus (Linnaeus, 1758) were removed from lakes Albert and Turkana and stocked in Lake Victoria accompanied by scientist concerns [2] [3] . Twenty years later, the Nile Perch comprised >50% in catches. From early 1980’s this fish produced >90% of landings. Before the Nile Perch invasion, the lake was densely populated by more than 400 endemic species of Haplochromine cichlids [4] - [6] . As a result of the Nile Perch piscivory, the Haplochromid cichlids as well as 6 introduced and 2 native species of Tilapia were severely suppressed [7] . As a consequence, non-grazed algal biomass was accumulated, and progressive build up of physico- chemical changes enhanced anoxia. Anoxic waters have been found at shallower depths and longer time due to an increase of oxygen demands for accumulated organics decomposition in the Hypolimnion. Landings composition were also significantly changed. Haplochromid cichlids declined, and the portion of the exotics, Nile Perch, Nile Tilapia (Oreochromis niloticus, Linnaeus 1758) and Silver Cyprinid (Rastrineobola argentea, Pell- grin, 1904) significantly enhanced but overfishing also took place [5] [8] - [10] . The Lake Victoria Ecosystem has also undergone successive changes within the drainage basin such as industrialization, agricultural development, dams constructions, deforestation and soil erosion. The combined external (Urban, industrial, dust deposition, soil erosion, deforestation, agricultural fertilizers) and internal pollutant input (resulted by the Nile Perch invasion) enhanced deterioration of water quality. The Lake Victoria ecosystem clearly exhibit symptoms of eutrophication [11] - [13] .
2. Material and Methods
2.1. Study Area (Figure 1 and Figure 2)
The lake and the drainage Basin territories is shared between three countries: Kenya, Tanzania and Uganda. The ratio between lake Volume and Catchment area is 11.7 m3/m2. The significance of that value is that each m3 of the lake accept nutrients from 11.7 m 2 of the catchment, which is, for example, higher than that of Lake Kinneret (1.8 m3/m2). Moreover, the D number for Lake Victoria (3.7) which is the ratio between the real length of the

Figure 1. Bathimetrical map of Lake Victoria.
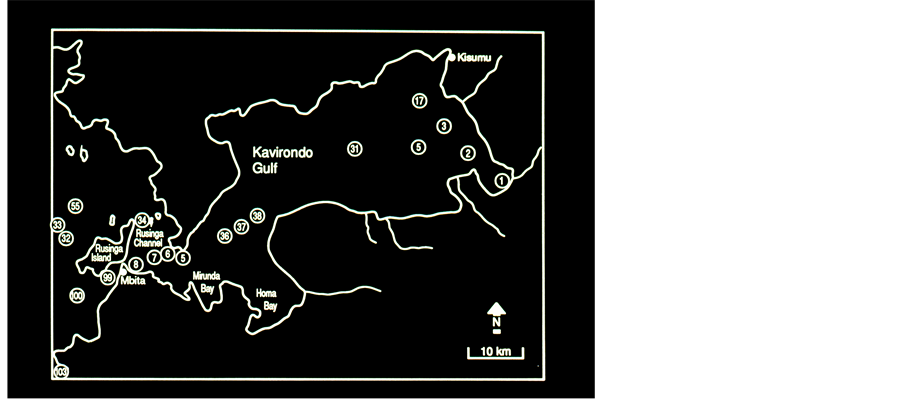
Figure 2. The Kenyan Part of Lake Victoria Kavirondo, (Wynam) Gulf Sampling Stations are numbered.
shoreline and the length of the circumference of a circle of an area equal to that of the lake is high (1.16 for Kinneret). In other words, long line of inter-phase between terrestrial land and the lake waters which is a potential for nutrients input. Those two indicators exhibit high potential of nutrient supply from the catchment. The basin is covered by grassland, savanna, agricultural crops, urban centers and forested mountains (Burundi). Nevertheless, anthropogenic deforestation followed by soil erosion was intensively enhanced. The two major inflow rivers are Kagera and Nzoia and the only outflow river is the Nile. Twenty sampling stations were monthly monitored for physicochemical parameters (DO, pH and Temperature): 8 stations in Wynam Gulf, 5 Stations at the transition zone between Wynam Gulf and the open waters (offshore), 1 station in the Rusinga Channel, and 5 stations in offshore zone.
2.2. Fisheries
Data on fishery in Lake Victoria during 1968-1991 was supported by Kenya Marine and Fisheries Research Institute. Statistical evaluation of these data was done by Simple Linear Regressions between annual landings (dependent variable) and years (independent variable) and rr (correlation coefficient which indicates the strength of the association between the two variables) and p (probability) values are given for each of the fish species.
2.3. Bathymetrical Profiles of Temperature, Dissolved Oxygen, and pH
Bathymetrical profiles ( 1 m intervals) of Temperature, Dissolved Oxygen, pH and depths, were measured monthly during 1990-1992 and additional hourly profiles, were carried out as well. The measurements were carried out by an assembly of Hydrolab Surveyor II connected to an SVR 2 Display Unit and 4041-Circulator. Secchi depths were also monitored. The monthly measurements were taken during 1990-1992. Total number of 246 of profiles (pH, DO Temp.) were measured at 15 stations covering 4 lake zones in the Kenian part of Lake Victoria: 1) Shallow (3 - 10 m) in Wynam Gulf; 2) Deep (30 - 56 m) and shallow (4 - 10 m) in Rusinga Channel; and 3) In Offshore zone (30 - 66 m). The measurements were taken during day time (08:00 am - 18:00 pm).
3. Results
Summary of Temperature, DO and pH measured profiles are presented in Table 2 and Table 3.
Total average of all (155) Secchi depths measurements: 1.8 m (SD 0.4 m) with Min.-Max. range of 0.8 - 2.8 m .
Table 2. Averages and ranges of station depths (m), Secci Depths (m), Upper Depths (m) of anoxic layer (<4.0 ppm DO) (SD) in stations divided according to lake zone: Rusinga Channel (deep and shallow), Wynam Gulf, and offshore.
Table 3. Total average (SD) of Maxima and Minima and range of pH and Temperature measured in all stations and dates (1990-1992) (n = 246).
This overall screening of results exhibit the low diversity and fluctuations of resulted values of pH and Temperature. In order to clarify potential relation between temperature and pH profile values Linear Regressions were evaluated between: 1) Maximal Temperature and pH values; 2) Minimal values of temperature and pH; and 3) between all ranges of temperature and pH. Regressions of 2 & 3 groups indicated significant positive regression: r2 = 0.341, (p = 0.0001), and r2 = 0.463 (p = 0.0001) for group 2 and 3 respectively. In profiles where bottom anoxic layer was indicated, a close association was found between minimal temperature, ph values (ranged 7.0 - 7.7) and DO concentration below 4.0 ppm. Averages of pH gradients in profiles without anoxia measured at Wynam Gulf, Shallows and Deeps of Rusinga Channel and offshore stations (n = 74) varied between 0.66 - 0.36. Values of pH in profiles with anoxia were varied between 9.60 - 6.65. Ranges of pH in profile with anoxia (n = 137) in offshore and Rusinga Channel were averaged between 1.63 - 1.75 (SD’s 0.4 - 0.71). Fisheries data compiled by Kenya Marine and Fisheries Research Institute is given in Table 4.
4. Discussion
Data documented in previous studies [14] [15] has indicated that Secchi Depths in Lake Victoria became shallower by 2 - 3 m from mid 1960’s to early 1990’s. Talling [14] documented during 1950’s-1960’s Secchi depths between 1.0 - 3.9 while the report given here (n = 155) indicated shallower values of 0.8 - 2.8 m. Documentation about anoxic water (<4.0 ppm DO) in the Kenyan part of Lake Victoria were reported 26 times during 1985- 1987 in March, May and August by several authors. These anoxic waters were recorded at station depths which varied between 5 - 30 m whilst the upper boundary of the anoxia at 4.5 - 25 m . Very low concentrations of DO (<4.0 ppm) were recoded in bottom waters at offshore Stations (30 - 60 m ) were also documented by several authors during 1957-1989. It is suggested that the disappearance of anoxia from the deeper (> 30 m ) part of Rusinga Channel that we measured during 08:00 - 09:00 am in 24.8.1990 (Figure 5) was driven by internal Seiche movement which injected the anoxic waters into the shallows (<10 m) as we measured in two other profiles (not shown here). Undoubtedly, Lake Victoria has undergone modifications initiated by both the invasion of the exotic Nile Perch [16] and the anthropogenic activity in the catchment [17] . Results given in Table 4 clearly indicates the massive invasion of Nile Perch, the devastation of Haplochromid fishery which was replaced by Rastrineobola. The takeover of Nile Perch in the lake Victoria fishery is prominent. The Nile Perch invasion into Lake Victoria is the founding event which together with anthropogenic activities and pollution created the deleterious changes of the entire ecosystem of which the physico-chemical conditions are discussed in this paper. Among the increase of anthropogenic activities which enhanced pollutant contributions the followings are included: production of domestic sewage (nutrients, and pathogenics), Coffee processing, Textile industry, Soap factories, Oil Mills, Breweries, Dairy products, Paper production and packing industries, Starch and Flour mills, Tannery, Pharmaceuticals, Sial, Beer and soft drinks production, Pesticides, Insecticides, herbicides, molluscacides [5] , Diseases vectors (Bilharzia, Malaria) grass overgrazing, and others. During 7 months (II-IV, VII-IX, and XI) no anoxic conditions were recorded in Rusinga Channel station as well as in two stations in the offshore waters during two months (II-III). Prior to the Nile Perch invasion the upper depths of anoxic waters were measured between 45 - 75 m [1] [7] [9] [18] [19] whereas we found it at an averaged depth of 22 - 23 m. Hourly monitoring in station 34, which is located on the marginal zone of the hypolimnic water mass confirmed Seiche movements and the existence of anoxia during August-October in water layer below 23 m (Figure 6) of Rusinga Channel. It is therefore suggested that a significant area of the deeper part of the lake (> 23 m ) is consistently anoxic during long season. Table 5 represents cases of anoxia in the offshore deep stations.
Table 4. Simple regression values (r2 and p = 0.0001) between annual Kenyan landings and years of Rastrineobola, Haplochromids, Nile Perch and Tilapias during 1968-1991) (I = Increase; D = Decrease; S = Significant).
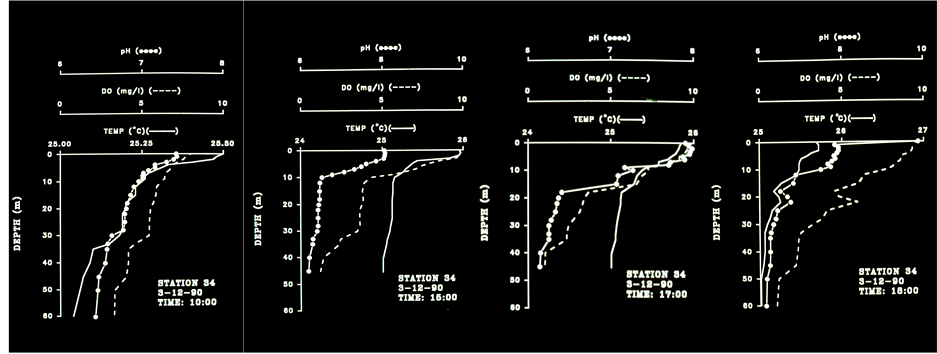
Figure 3. Temperature, pH and DO Profiles Station 34, 3.12.90, 10:00 am - 18:00 pm.
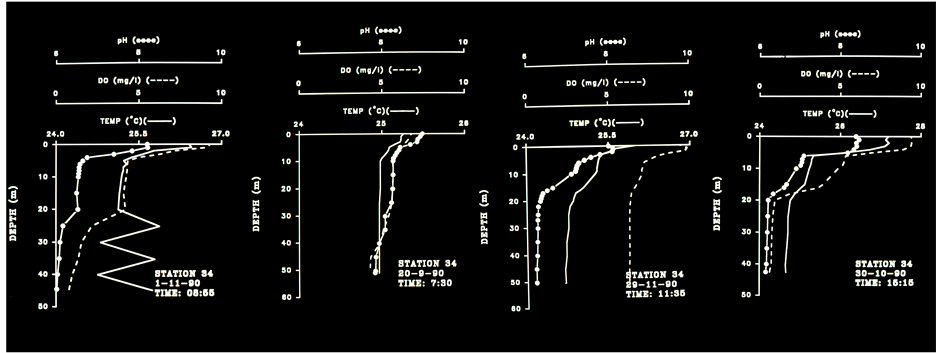
Figure 4. Temperature, pH and DO Profiles Station 34, September-November 1990, 08:55 am - 15:15 pm.
4.1. Thermal Structure and Stratification Stability
Enhancement of external pollutant inputs together with the Nile Perch invasion are the major reasons for deterioration of water quality, and the devastation of fishery and a natural biodiversity of Hapolochromid fish assemblages in Lake Victoria. Independently the thermal structure of Lake Victoria is very sensitive, which by itself accelerate pollution processes [20] . Lake Victoria is located in the tropical zone where the amplitude of temperature differences between day and night and seasonally are low. Moreover, the lake is too shallow for stable stratification as in other deep lakes in east Africa. Lake Victoria is not deep enough to form permanent non- mixed layers (Meromictic Lake) and thermal changes are not high enough to create stable stratification. Nevertheless, due to pollution impact, Nile Perch invasion and thorough modification of the food-web structure formed deleterious effects of water quality. The data presented in Table 5 indicates instability of thermal stratification. Stability of stratification and water column mixing effect rely on thermal and consequently on density (weight/volume) differences between upper and lower layers. If water thermal differences and consequently densities are close, the potential for mixing is high. These criteria are termed as Relative Thermal Resistence (R.T.R.). The RTR values are calculated for adjacent layers (could be half a meter and several meters thickness) accounted for their temperatures and consequent densities. In this paper the Epilimnetic water density is the conversion of Surface Temperature (S) to density. The Hypolimnetic water density is the conversion of the temperature of the upper layer of Anoxia (A). One unit of RTR is 8 ´ 10−6. That is the difference between water density at 5˚C (0.999992) and 4˚C, the highest water density, (1.000000). The higher the water temperature is the lower is their density. The actual RTR value of the Lake Victoria water column is expressed as the Ratio
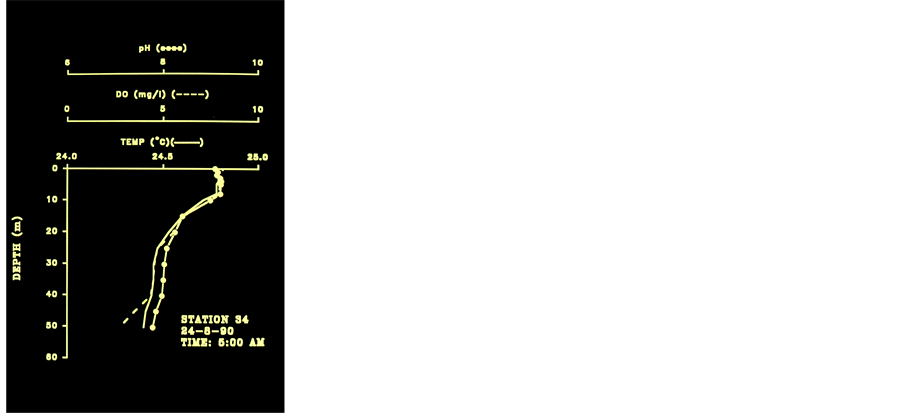
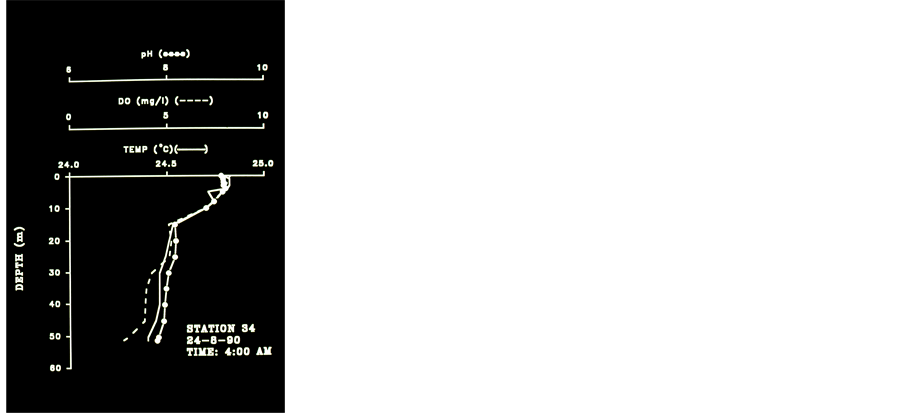
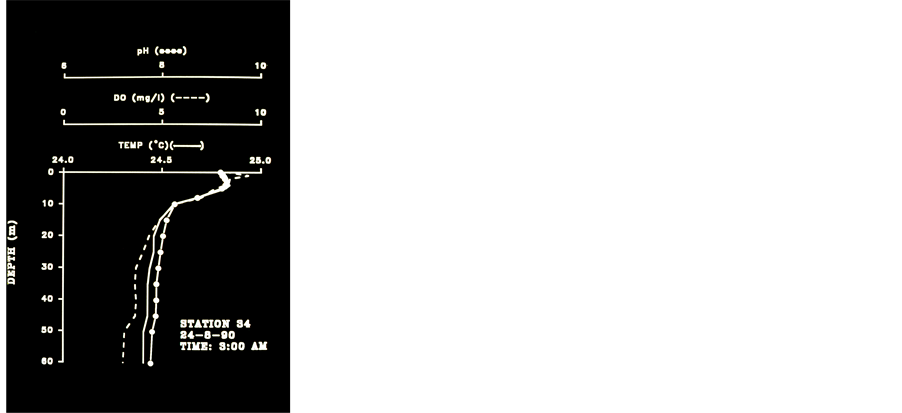
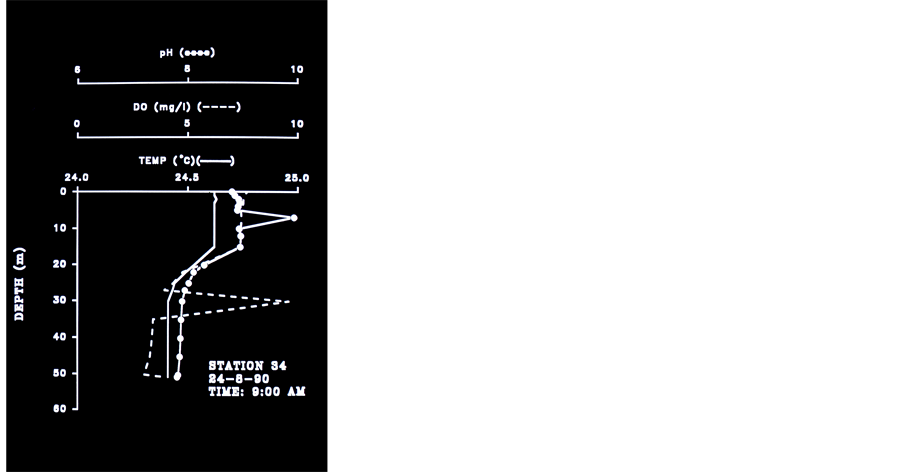
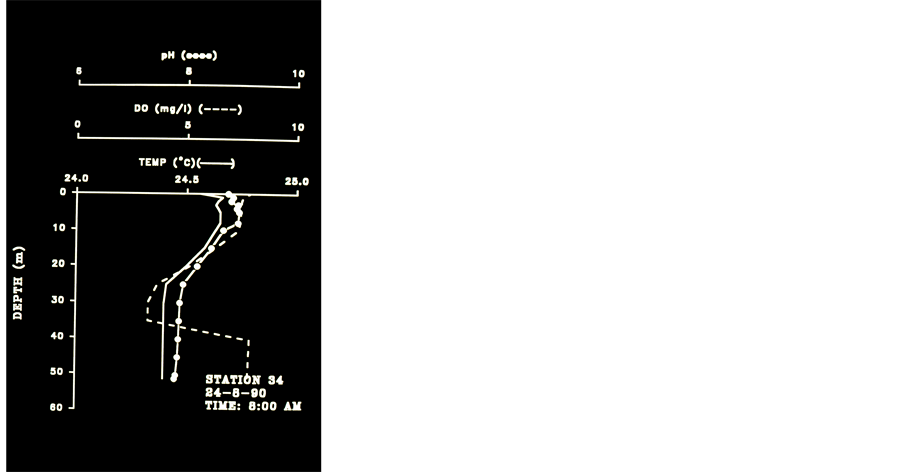
Figure 5. Temperature, pH and DO Profiles Station 34, 24.8.90, 03:00 am - 08:00 pm.
between the density of “A” minus the density of “S” in relation to the density difference of 4˚C and 5˚C. The higher the result is the higher is the stratification stability, i.e. more energy is required for mixing. A significant indicator of the strong mixing activity within the water column of the offshore zone of lake Victoria is also presented by the pH values uniformity, ranged between 6.91 - 7.55 (one exception of 8.02). The significant relations as presented by linear regressions between the minimal temperatures and pH values as well as between the thermal ranges and pH values indicates the following situation: There are two independent processes: 1) Photosynthesis resulting DO production and pH decline, and 2) Thermal changes. Solar radiation is the only heat source (air temperature) and its distribution downwards is depend upon water heat conductivity. The DO production and pH decline is primarily induced by phytoplankton which is homogenously distributed in upper layers resulting insignificant regression with temperature. In deep waters where light is limited and phytoplankton biomass is lower and consequently photosynthesis, DO production and pH decline and simultaneously fluctuate with thermal changes, and therefore the two processes (thermal and pH fluctuations) are significantly related. The significant relations between pH and thermal ranges reflect the dominant impact of the low temperatures in deep layers. Consequently, thermal ranges in profiles without anoxia are smaller than those with anoxic (and
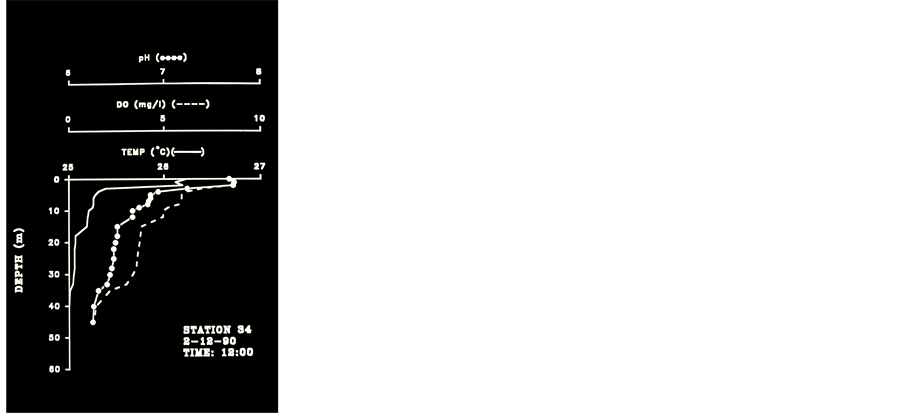
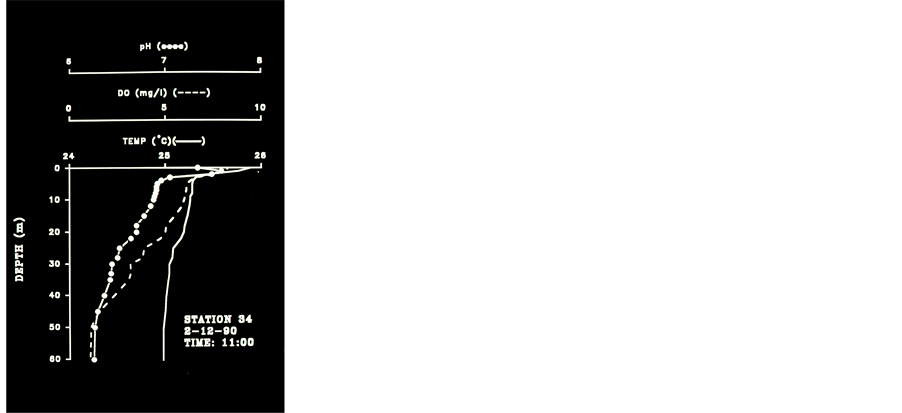
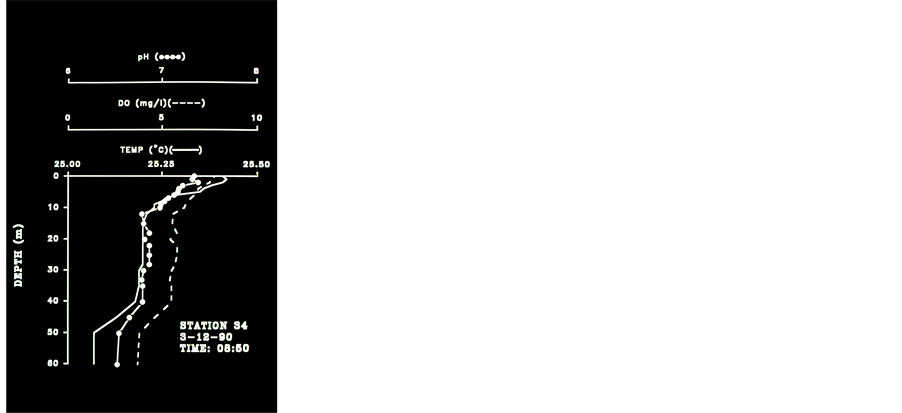
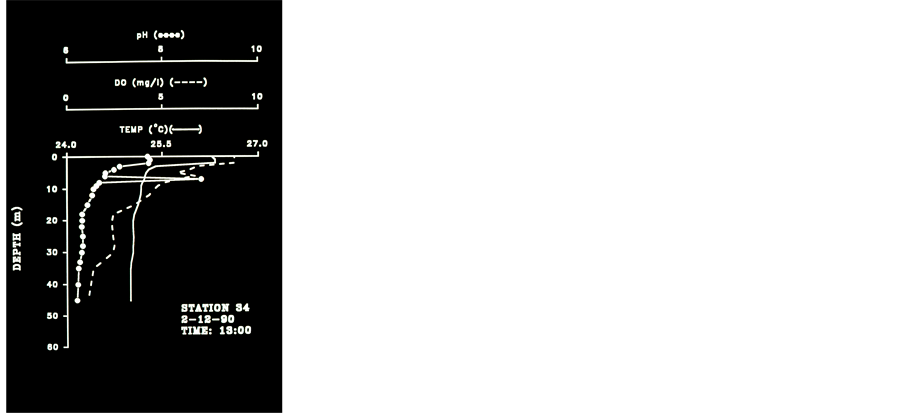
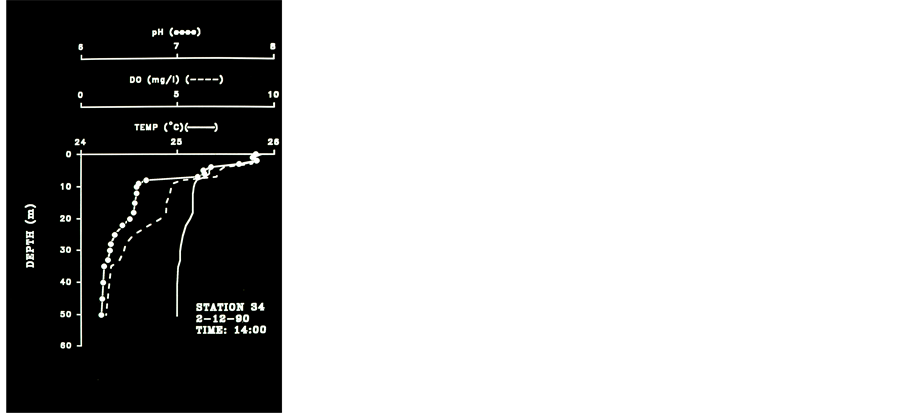
Figure 6. Temperature, pH and DO Profiles Station 34, 2.12.90, 08:50am - 14:00pm am - 18:00 pm.
colder) waters.
4.2. Mixing Potential (RTR Value for Lake Victoria)
RTR values for Lake Victoria as Calculated for actual maximal and minimal S (surface) and A (Anoxic) temperatures:
Minima: S = 25.74˚C; Density (g/ml) = 0.996856; A = 24.78˚C; Density (g/ml) = 0.997104; Difference = 248 ´ 10−6;
Maxima S = 27.41˚C; Density (g/ml) = 0.996403; A = 26.04˚C; Density (g/ml) = 0.99776; Difference = 373 ´ 10−6;
RTR value: Minimal: 248 ´ 106/8 ´ 106 = 31; Maximal: 373 ´ 106/8 ´ 106 = 46;
The RTR value for Lake Kinneret (Israel) (mean Epilimnetic and Hypolimnetic Temperatures-26˚C and 15˚C respectively converted to density units) is 290. Consequently, stratification stability in Lake Kinneret is much stronger than in Lake Victoria [21] . The low stability of stratification in Lake Victoria is therefore acting as a significant factor of nutrient input through an effective upwelling and mixing processes [19] [21] . It is an efficient bottom-up eco-force contributing nutrients for phytoplankton growth. A Monthly averages of DO concentration (ppm) and % saturation in two layers (0 - 20 m ; 40 - 60 m ) in the Kenyan waters of Lake Victoria during the 19601’s [18] [20] and 1990’s are given in Table 6.
Table 5. Surface water and upper layer of anoxic water temperatures, bottom and anoxic water depth, measured in deep stations (see map) during 1990-1991 by HYDROLAB System.
Table 6. Monthly Averages of DO concentration (ppm) and % saturation in the Kenyan waters of Lake Victoria during the 1960’s and 1990’s [18] [20] .
Results in Table 6 show the followings: 1) Higher DO concentration in upper layer during the 1990’s probably due to increase of phytoplankton biomass; 2) Lower DO concentration (enhancement of anoxia) in deep layer during the 1990’s, excluding April, May, July. The increase of photosynthetic activity in upper layer during the 1990’s is also expressed by the higher % of saturation. A verification of the anoxic enhancement and the close relation between DO and pH in Lake Victoria are presented in Table 6 and in Figures 3-8. The formation of a thermocline at 5 m depth during 10:00 am and its decline to 10 m as expressed by Temperature, DO and pH at 15:00 pm. In late afternoon (17:00 - 18:00) thermocline decline to 20 meters was indicated together with anoxia (<4.0 ppm DO) below 20 m . The four profiles measured at station 34 during 08:55 - 15:15 which are presented in Figure 4 indicates thermocline located at 5 m and anoxia (<4.0 ppm) accompanied by low pH (<7.0) below 20 meters during day time. The five profiles given in Figure 5 represents thermal changes during morning time in station 34. Thermocline formation at 10 m during 03:00 followed by a decline to 15 m and evaluated to 9m one hour later and almost a complete destruction of stratification later at 05:00. During late morning a
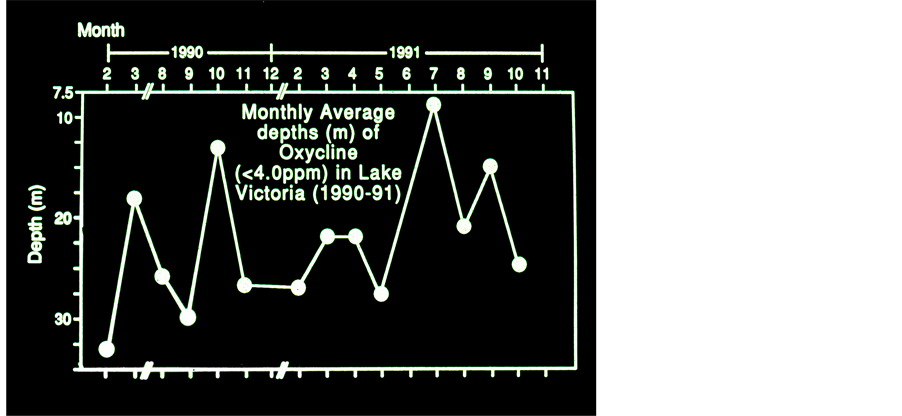
Figure 7. Monthly Average Depth (m) of Oxycline (<4 ppm DO) in Lake Victoria 1990-1991.
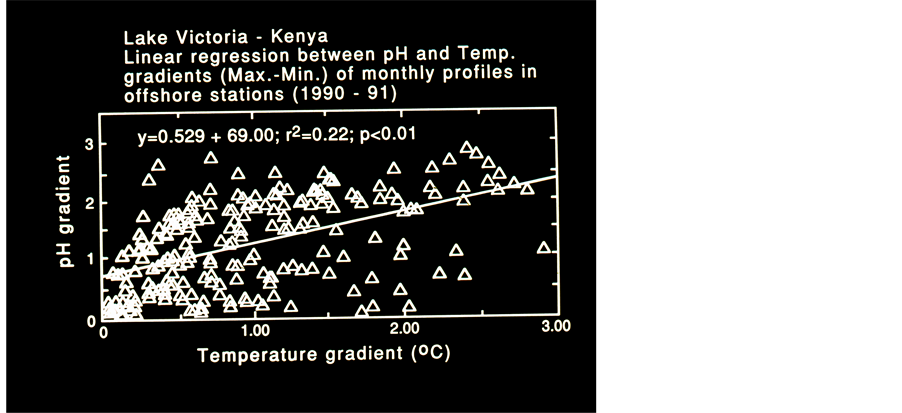
Figure 8. Linear Regressions (r2 and p value are given) Between Themal gradient (Max.-Min.) of monthly averaged Profiles in offshore stations, Kenyan waters.
mass of oxidized waters penetrated below 40 m during 08:00 and one hour later it was detected at 30 m depth. Five profiles (Figure 6) measured at station 34 during 08:00 and 14:00 indicates a build up of the Thermocline at 5 m depth and deeper at 11:00 - 13:00. A decline to 10 m after 12:00, accompanied by anoxia (<4.0 ppm) existence below 20 m from 12:00 and onwards. The total monthly averages (1990-1991) of the Thermocline depths are given in Figure 7. These data was tested by linear and Quadratic prediction (Figure 8) and resulted a decline of 8 m (from 27 to 19 m ) and 7 m (from 26 to 19 m ) respectively. When gradients (Max.-Min.) of Temperature and pH values were tested by Linear regression (r2, p < 0.01) the result has indicated a significant positive relation. The formation of stratification and its fast destruction, the quick and slight changes of water temperature, oxygen content and pH prominently presented in those Figures 3-8 exhibit the low stability of the thermal structure.
5. Summary
Exotic piscivore fish, Nile Perch (Lates niloticus) was planted in Lake Victoria, East Africa and devastated the entire ecosystem structure. Extinction of Natural assemblages of about 400 endemic species of Haplochromid cichlid, causing surplus algal biomass that was produced and its decomposition enhanced anoxia in deep layers together with the Nile Perch invasion anthropogenic activities in the drainage basin enhanced pollution pro- cesses. The lake is located in the tropics where thermal regime is stable and only slightly changed. Therefore, stratification is not stable and mixing supporting suitable conditions for eutrophication.
Acknowledgements
The research was funded by USAID-CDR (Grant No. DPE-5544-SS-7075-00-C7-080) to Prof. Moshe Gophen and Utza Pollingher, Israel Oceanographic and Limnological Research Company―The Iygal Alon Kinneret Limnological Laboratory and Peter B.O. Ochumba Kenya Marine and Fisheries Research Institute. U. Pollingher and P.B.O. Ochumba deceased and the paper is dedicated to their memory. Warm thanks for help, friendly cooperation, field assistance and technical support are given to Prof. L. S. Kaufman, W. Cooper, E. Okemwa, J. Ogary, and the team of the Kisumu Laboratory: S. Agembe, W. Oyieko, J, Manyala, J. Ochuko.
References
- Newell, B.S. (1960) Hydrology of Lake Victoria. Hydrobiologia, 15, 363-383. http://dx.doi.org/10.1007/BF00046419
- Fryer, G. (1960) Concerning the Proposed Introduction of Nile Perch into Laken Victoria. East Africa Agriculture Journal, 267-270.
- Barel, C.D.N., Dorit, R., Greenwood, P.H., Fryer, G., Hughes, N., Jackson, P.B.N., Kawanabe, H. and Lowe-McConell, R.H. (1985) Destruction of Fisheries in Africa’s Lakes. Nature, 325, 19-20. http://dx.doi.org/10.1038/315019a0
- Greenwood, P.H. (1981) The Haplochromine Fishes of East African Lakes: Taxonomy, Biology, and Evolution. Kraus International Publications, Munich, 839 p.
- Ochumba, P.B.O., Gophen, M. and Pollingher, U. (1992) Ecological Changes in Lake Victoria after the Invasion of Nile Perch (Lates niloticus): The Catchment, Water Quality, and Fishery Management. Aquaculture and Schistosomiasis: Proceedings of the Network Meeting, Manila, National Academy Press, Washington DC, 137-147.
- Ochumba, P.O.B., Gophen, M. and Pollingher, U. (1992) Management of Limnology and Fisheries of Lake Victoria: General Characteristics, Sociogeographic and Management of the Fisheries. Hydraulic Enigneering in Mexico, 7, 37- 43.
- Kaufman, L.S. (1992) Catastrophic Change in Species-Rich Freshwater Ecosystems: The Lesson of Lake Victoria. BioScience, 42, 846-858. http://dx.doi.org/10.2307/1312084
- Ojwang, W.O., Ojuok, J.E., Nyamweya, C., Agembe, S., Owili, M., Yongo, E. and Wakwabi, E.O. (2014) The Intriguing Dynamics of Rastrineobola argentea Fishery in the Kenyan Waters of Lake Victoria. Aquatic Ecosystem Health and Management, 17.
- Akiyama, T., Kajumulo, A.A. and Olsen, S. (1977) Seasonal Variation of Planktonand Physico-Chemical Condition in Mwanza Gulf, Lake Victoria. Bulletin of Freshwater and Fisheries Research Laboratory, 27, 49-61.
- Asila, A. and Ogari, J. (1987) Growth Parameters and Mortality Rates of Nile Perch Lates niloticus Estimated from Length Frequency Data in the Nyanza Gulf (Kenya) Lake Victoria. UN-FAO-Fisheries Report, 389, 271-287.
- Ochumba, P.B.O., Gophen, M. and Pollingher, U. (1994) Ecological Changes in Lake Victoria after the Introduction of Nile Perch (Lates niloticus): The Catchment, Water Quality and Fisheries Management. In: Cowx, I.G., Ed., Rehabilitation of Freshwater Fisheries (Fishing News Books), Chap. 31, Blackwell Scientific Publications Ltd., 338-347.
- Ochumba, P.B.O., Gophen, M. and Pollingher, U. (1994) Ecological Changes in Lake Victoria after the Invasion by Nile Perch (Lates niloticus). In: Okemwa, E., Wakwabi, E.O. and Getabu, A., Eds., Recent Trends in Research on Lake Victoria Fisheries. Proceeding of the 2nd EEC Regional Seminar on Recent Trends in Research on Lake Victoria Fisheries Organized and Hosted by Kenia Marine and Fisheries Research Institute (KMFRI), Kisumu, 25-27 September 1991, ICIPE Science Press, 29-39.
- Gophen, M., Ochumba, P.B.O. and Kaufman, L.S. (1995) Some Aspects of Perturbations in the Structure and Biodiversit of the Ecosystem of Lake Victoria. Aquatic Living Resources, 8, 27-41. http://dx.doi.org/10.1051/alr:1995003
- Talling, J.F. (1966) The Annual Cycle of Stratification and Phytoplankton Growth in Lake Victoria (East Africa). Internationale Revue der gesamten Hydrobiologie und Hydrographie, 51, 545-621.
- Fish, G.R. (1957) A Seiche Movement and Its Effect on the Hydrology of Lake Victoria. Colonial Office Fishery Publications, London, No. 10, 1-60.
- Gophen, M., Ochumba, P.B.O., Pollingher, U. and Kaufman, L.S. (1993) Nile Perch (Lates niloticus) Invasion in Lake Victoria (East Africa). Verhandlungen des Internationalen Verein Limnologie, 25, 856-859.
- Reynolds, J.E. and Grebovall, D.F. (1988) Socio-Economic Effects of the Evolution on Nile Perch Fisheries in Lake Victoria: A Review. CIFA Technical Paper 17, 148 p.
- Talling, J.F. (1957) Some Observations on the Stratification of Lake Victoria. Limnology and Oceanography, 2, 213-221.
- Kitaka, G.E.B. (1971) An Instance of Cyclonic Upwelling in the Southern Offshore Waters of Lake Victoria. African Journal of Tropical Hydrobiology and Fisheries, 1, 85-92.
- Hecky, R.E., Bugenyi, F.W.B., Ochumba, P.B.O., Talling, J.F., Mugidae, R., Gophen, M., Robinson, W. and Kaufman, L.S. (1994) Deoxygenation of the Deep Water of Lake Victoria, East Africa. Limnology and Oceanography, 39, 1476-1481. http://dx.doi.org/10.4319/lo.1994.39.6.1476
- Talling, J.F. (1969) The Incidence of Vertical Mixing and Some Biological and Chemical Consequences in Tropical African Lakes. Verhandlungen der Internationalen Vereinigung für theoretische und angewandte Limnologie, 17, 998- 1012.