Open Journal of Ecology
Vol.4 No.8(2014), Article ID:46464,13 pages DOI:10.4236/oje.2014.48037
Influence of Substrate Quality and Moisture Availability on Microbial Communities and Litter Decomposition
David J. Berrier1, Morgan S. Rawls1, Shannon Leigh McCallister1,2, Rima B. Franklin1*
1Department of Biology, Virginia Commonwealth University, Richmond, USA
2Center for Environmental Studies, Virginia Commonwealth University, Richmond, USA
Email: *rbfranklin@vcu.edu
Copyright © 2014 by authors and Scientific Research Publishing Inc.
This work is licensed under the Creative Commons Attribution International License (CC BY).
http://creativecommons.org/licenses/by/4.0/


Received 13 February 2014; revised 13 March 2014; accepted 19 March 2014
ABSTRACT
The main source of carbon (C) to soil stocks is plant litter, the decomposition of which is controlled by a mixture of physical, chemical, and biological processes. Bacteria and fungi are the dominant biota responsible for decomposition, yet we know very little about their respective contributions or how community dynamics may be affected by litter quality. This study sought to gain a better understanding of the variable relationships between organic matter decomposition, litter quality, and microbial community composition, with a specific focus on distinguishing bacterial and fungal dynamics. Experiments were conducted under contrasting hydrological conditions, comparing a wetland with an upland forest environment. Decomposition of native vegetation was monitored in addition to breakdown of a common substrate (Acer rubrum (red maple) leaves) placed in both environments. In situ incubations lasted 16 months, and were sampled at ~3-month intervals. Regardless of site, maple litter decomposition proceeded at a similar rate, though we did observe differences in litter quality over time (C:N, %N, solubility of organic C). For the upland site, native litter decomposed more slowly than the maple did. At the wetland site, both litter types decomposed at a similar rate which, surprisingly, was faster than either litter type at the upland site. This finding could be attributed to water-limitation at the upland site and/or stimulation of decomposition at the wetland site due to allochthonous nutrient inputs or organic matter priming. Substrate induced respiration (SIR) was measured for native litter incubated at each sampling site, and the relative contributions of bacteria and fungi were compared. No consistent major differences were detected across these microbial groups, though we did observe much higher rates of SIR at the wetland site compared to the upland site. Community structure of each microbial group was examined via terminal restriction fragment length polymorphism (TRFLP), which revealed dramatic temporal shifts for both groups at both sites. In general, these results indicate a long-term effect of both litter type and environmental conditions (site) on the bacterial community, but show only environmental effects on the fungal communities. This suggests that different environmental conditions allow microbial communities to uniquely approach decomposition of leaf litter components.
Keywords:Fungi, Bacteria, Decomposition, Wetland, Marsh, Soil Moisture

1. Introduction
Globally, the world’s soils store more carbon (C) than is present in living biomass and the atmosphere combined [1] . The main source of C to soil stocks is plant litter, the decomposition of which is controlled by a mixture of physical, chemical, and biological processes [2] . Bacteria and fungi are the dominant biota responsible for decomposition, and are known to breakdown upwards of 90% of terrestrial plant biomass [3] . However, despite numerous studies (e.g., see citations in Prescott [4] ), scientists have yet to develop a synthetic understanding of the underlying mechanisms that control the rate and extent of plant litter decomposition. Such information is essential for predicting ecosystem-scale patterns in organic matter (OM) mineralization and accumulation, and is a necessary component of models of global C cycling.
Microbial decomposition can be strongly influenced by environmental conditions such as temperature, moisture, and nutrient availability (e.g., see [5] -[7] ). Substrate quality is also important. For example, a recent metaanalysis demonstrated that the carbon to nitrogen (C:N) ratio and nutrient content of plant litter can account for 70% of the variation in decomposition rates in terrestrial ecosystems [8] . A similar meta-analysis [4] recognized litter quality effects, but suggested that a more nuanced conceptual model is necessary to understand factors that control decomposition. In particular, Prescott [4] hypothesized that any variable could become rate limiting at a critical threshold. For example, while litter quality may be an important predictor under conditions of adequate temperature, water, and nutrient availability, in xeric environments, moisture availability may limit OM decomposition in such a way that litter quality effects are negligible. Similarly, excess moisture may suppress decomposition in saturated ecosystems such as wetlands, where the resulting hydric anaerobic soil conditions can lead to detritus accumulation even in the cases of high litter quality [9] [10] .
Most of the studies described above focus on net decomposition rates based on OM loss, and there are considerably fewer studies that consider the composition of the microbial decomposer community or the differential contributions of bacteria versus fungi [11] -[15] . Because of the distinctive physiology of the two microbial groups, their relative impact on OM decomposition may vary depending on substrate quality and environmental conditions. For example, fungi are thought to possess a competitive advantage over bacteria when considering decomposition of more refractory OM with higher C:N ratios. This advantage is due to the fact that fungal hyphae can penetrate recalcitrant litter surfaces and relocate nutrients [15] -[18] sidestepping resource constraints that might limit bacterial growth. Consequently, it has been hypothesized that as decomposition progresses, a succession from labile-C consuming bacteria to depolymerizing fungi occurs [18] [19] . However, this microbial progression may not hold true in saturated environments, as fungal growth is often assumed to be limited by anaerobic conditions [13] [17] ; this assumption does not universally apply as some studies have found fungal production and biomass to be greater in inundated wetland detritus [11] [14] .
The research described here examines plant litter decomposition with the specific goal of linking litter quality and moisture availability to changes in microbial community structure. A 16-month litterbag study was conducted using three different types of plant litter incubated in two habitats that varied dramatically in moisture content (a forested upland and an adjacent freshwater wetland). Litter decomposition rates were determined, as were several attributes of litter quality (C:N, %N concentration, solubility of organic C), and compared to changes in bacterial and fungal community composition as assessed using terminal restriction fragment length polymorphism (TRFLP). Lastly, substrate-induced respiration (SIR) was used to quantify respiration rates for each microbial group and help link community structure, function, and litter quality.
2. Methods
2.1. Site Description
This study was conducted at Virginia Commonwealth University’s Rice Center for Environmental Life Sciences near Richmond, Virginia (USA). Two habitat types were chosen to represent differing moisture regimes in which to study plant litter decomposition: 1) forested upland and 2) freshwater wetland. The “upland” site was characterized by relatively dry soil (annual average gravimetric water content: 40%), and vegetation dominated by Fagus gradifolia, Quercus alba, and Quercus rubra. Vegetation at the “wetland” site was primarily comprised of a variety of graminoid species and Typha angustifolia. Soil moisture was high at the wetland site (annual average gravimetric water content: 110%) and standing water was observed on the soil surface during precipitation events.
2.2. Experimental Design
In November 2007, senesced plant material was collected from each site and from a single nearby Acer rubrum (red maple) tree. This material was air dried in the laboratory for two weeks and then used to prepare four sets of litter bags: 1) red maple leaves to be deployed at the upland site, 2) red maple leaves for the wetland site, 3) upland vegetation for the upland site, and 4) wetland vegetation for the wetland site. Prior to litterbag assembly, wetland vegetation was cut into ~5 cm pieces; other litter types were left intact. Litterbags (15 cm × 15 cm) were constructed from 0.5-mm Nitex mesh (#24-C60, Wildlife Supply Company, Buffalo, New York, USA), filled with 5 g of dry plant material, and sealed using polyester thread. Bags were randomly distributed in a 200-m2 plot at each site. On each collection date (0, 3, 6, 10, and 16 months in the field), 8 litterbags from each set (16 per site) were harvested.
2.3. Environmental Analyses
For the field sites, baseline soil conditions were monitored monthly using six replicate 100-g samples per site per sampling event. Redox potential and pH were measured using a Hanna Combo probe (QA Supplies, Norfolk, Virginia, USA), and soil moisture content was analyzed gravimetrically (100˚C for 72 h). Any remaining soil was stored at −20˚C until the end of the study, at which point archived samples were pooled and homogenized to generate a single aggregate soil sample for each site for analysis of soil OM content, cation availability, and texture (A & L Laboratories, Richmond, Virginia, USA).
For each litterbag collection date, harvested intact bags were stored at ambient temperature for transport to the lab. External soil and debris were gently wiped from the litterbags before weighing. Each litterbag’s contents were then homogenized using a small coffee grinder and immediately analyzed for mass remaining (after drying at 50˚C for 48 h), OM content (loss on ignition at 500˚C for 4 h), and microbial respiration. Subsamples were stored at −80˚C until analyzed for C and N content, water-extractable dissolved organic C (DOC), and genetic profiling of microbial community structure. The total C and N content of the litter was determined using a Perkin Elmer CHNS/O Analyzer (Waltman, Massachusetts, USA) after acidification (10% hydrochloric acid). Extractable DOC was determined from 100-mg subsamples immersed in 15-ml deionized water following the approach outlined in [14] , and quantified using a Shimadzu TOC Analyzer (Torrence, California, USA).
2.4. Substrate-Induced Respiration
Microbial substrate-induced respiration (SIR) was quantified as the total production of 14C-labeled CO2 following incubation with 14C-radiolabeled acetate. The separate contributions of bacteria and fungi were determined via selective inhibition using the antimicrobials cycloheximide and streptomycin [20] [21] . SIR was performed for litterbags containing site-specific litter (i.e., upland vegetation incubated at the upland site, and wetland vegetation incubated in the wetland site); maple litter was not considered. For each sampling event, four replicate bags of each type were randomly selected for this assay.
Litter was ground, homogenized, and 0.25-g portions were distributed into four separate sterile culture flasks (55-ml volume, #3055, Corning Inc., Corning, New York, USA) preloaded with 15 ml of sterile PBS (pH = 7.4). Flasks were assigned to the following treatments: 1) an antibacterial treatment with 40 mg·g−1 litter of streptomycin, to measure fungal respiration; 2) an antifungal treatment with 80 mg·g−1 litter cyclohexamide, to measure bacterial respiration; 3) a combined antibacterial and antifungal treatment to serve as an inhibitor control; and 4) and a killed control with 1 ml of 2 N H2SO4 added to stop all microbial activity. Flasks were incubated for 2.5 h following addition of the inhibitor, and then spiked with 0.5 μCi of 14C-acetate (NEN Life Sciences Products, Boston, Massachusetts, USA) and capped with an airtight septum. Following another 2.5-h incubation, the CO2 in each vial was trapped using phenethylamine, and associated radioactivity was measured using a Beckman LS 6500 scintillation counter. Respiration rates were calculated as amount of 14CO2 generated per hour after controlling for abiotic production in the H2SO4-killed controls.
2.5. Microbial Community Composition
For each litterbag analyzed via SIR, microbial community structure was also examined using TRFLP DNA fingerprinting [22] . Whole-community DNA was extracted from 0.25-g subsamples of litter using the MoBio Labs Power Soil DNA kit (Carlsbad, California, USA) and concentration was determined using a Nanodrop ND-1000 (Thermo Scientific, Willmington, Delaware, USA). DNA extracts were stored at −20˚C.
Group specific primers were used to separately examine the bacterial and fungal members of the community using conserved regions associated with the 16S and 18S rRNA genes respectively. Bacteria were targeted using FAM-labeled 27F (5’-AGA GTT TGA TCC TGG CTC AG-3’) and unlabeled 1492R (5’-GGT TAC CTT GTT ACG ACT T-3’) [23] . For the fungal community, TET-labeled ITS1-F (5’-CTT GGT CAT TTA GAG GAA GTA A-3’) was combined with unlabeled ITS4 (5’-TCC TCC GCT TAT TGA TAT GC-3’) [24] . All primers were synthesized by Integrated DNA Technologies (Coralville, Iowa, USA).
The bacterial community PCRs were conducted in 50-μl reactions that contained: template DNA (2.5 - 10 ng), 10 mM Tris HCl (pH 8.3), 50 mM KCl, 3 mM MgCl2, 200 μM of each dNTP, 0.1 μM of each primer, 20 mg BSA (bovine serum albumin; Roche Inc., Nutley, New Jersey, USA), and 2.5 units of AmpliTaq DNA polymerase (Applied Biosystems, Foster City, California, USA). PCR amplification conditions were: 95˚C for 3 min, 27 cycles of 45 sec at 94˚C, 1 min at 57˚C, and 2 min at 72˚C, and 72˚C for 7 min (PTC-100 Thermal Controller, MJ Research, Inc., Waltham, Massachusetts, USA). The fungal community PCR followed identical reaction conditions but with a total cycle number of 32 and an annealing temperature of 52˚C. After successful amplification was confirmed by agarose gel electrophoresis, each set of PCR products was purified using the MiniElute PCR Purification Kit (Qiagen, Valencia, California, USA) and digested using either the MspI (for bacteria) or the HhaI (for fungi) restriction enzyme following the manufacturer’s protocol (NEB, Ipswich, Massachusetts, USA). A second purification step was performed (MiniElute), and aliquots (8 µl) of each purified digest were processed on a MegaBACE 1500 Series Sequencer (Amersham Biosciences, Piscataway, New Jersey, USA) according to Campbell et al. [25] .
2.6. Statistical Analyses
Analysis of variance (ANOVA) was used to compare litter quality metrics for the initial plant material and for each set of litter samples at each time point. Decomposition rates (k) were calculated for each litter type and site using the negative exponential decay model:

where OMt corresponds to %OM at sample time t, OMo represents initial %OM (t = 0), and t is the time period [26] . To determine if differences existed among breakdown rates, a general linear model with a dummy variable was used to make pairwise comparisons between site and litter type. Multiple linear regression was performed to determine which attributes of litter quality were significant predictors of %OM loss using the backwards stepwise approach. Bacterial and fungal SIR rates were examined via ANOVA and a Tukey’s post hoc test for each sampling period. Spearman rank correlations were performed to correlate litter quality, %OM loss, and respiration. All these statistics relied on α = 0.05 and used SPSS statistical software (Version 16, Chicago, Illinois, USA).
For the TRFLP data, separate analyses were carried out for the bacterial and fungal datasets using non-metric multidimensional scaling (NDMS) with Jacquard’s similarity coefficient. Two dimensional plots were produced as a means of visualizing the differences among communities based on both site and sampling time. An analysis of similarities (ANOSIM) was used to test for significant differences between communities across sites or over time, again using the Jacquard coefficient. The relationship between the TRFLP profiles and specific litter quality attributes was analyzed via Mantel tests [27] . For the ANOSIM and Mantel tests, an initial α of 0.05 was used and adjusted via sequential step-down Bonferroni approach; all TRFLP data analyses used the PAST (PAleontological STatistics) program [28] .
3. Results
3.1. Site Soil
Monthly sampling revealed that gravimetric water content (%) of the soil was always greater in the wetland (110 ± 3 (S.E.)) compared to the upland (40 ± 3) (Figure 1). Redox potential (mv) was consistently higher in the upland soil (388 ± 11), and the values indicate an aerobic environment. In contrast, redox potential was lower in the wetland (239 ± 15), and high saturation frequently established anaerobic conditions. Besides redox potential and moisture content, there are few differences in the soils found at the two sites. Soil pHs were slightly acidic (wetland: 4.7 ± 0.1; upland: 4.8 ± 0.1) and varied little over time. Analysis of pooled samples indicate similar OM content (%, wetland: 3.0; upland: 5.5), cation exchange capacity (meq per 100 g, wetland: 5.3; upland: 3.7), and texture (both classified as silt loam/loam).
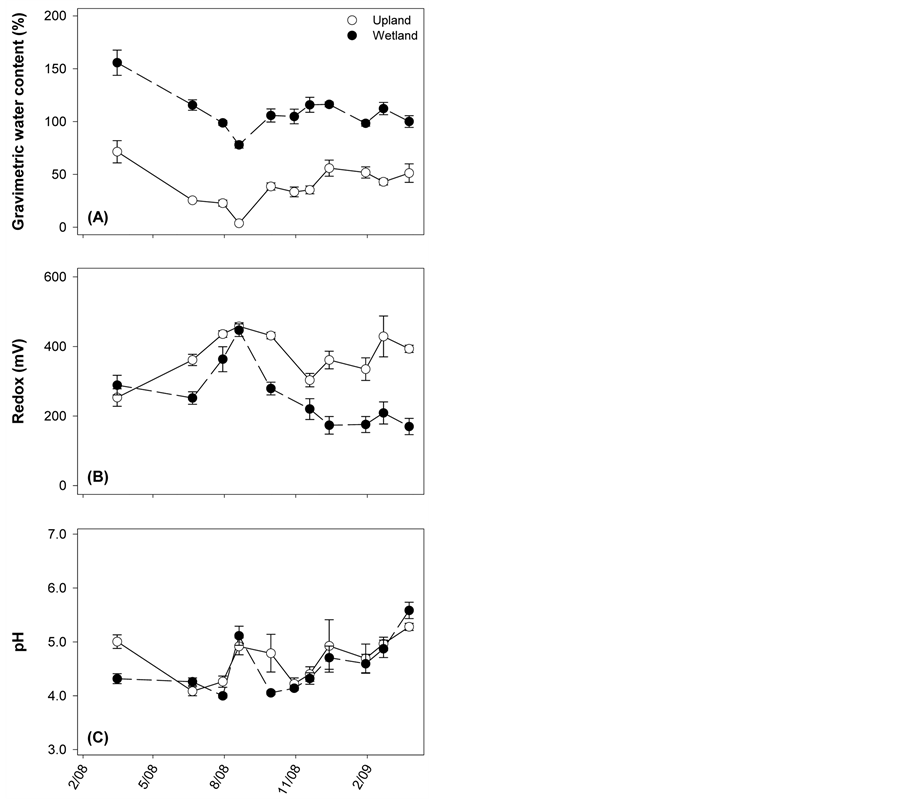
Figure 1. Soil characteristics of each site from monthly sampling: (a) gravimetric water content, (b) redox potential, and (c) pH. Open circles represent the upland site; closed circles correspond to the wetland site. Points are means ± standard error, each with N = 6.
3.2. Litter Quality
At the start of the study, litter quality was different depending on the type of plant material (Table 1). Maple leaves had a significantly lower %N content and higher C:N ratio (%N: F = 10.2, p = 0.003; C:N: F = 8.8, p = 0.002) than native wetland plant litter, but did not differ significantly from native upland plant material. Waterextractable DOC content of the red maple was significantly higher than the two native litter types (F = 25.8, p = 0.001), which did not differ from each other. Total %OM and %C content were not significantly different across any of the litter types (OM: F = 2.9, p = 0.08; %C: F = 0.7, p = 0.51).
Over time, the %N content of the OM in the litterbags increased for all litter types at both incubation sites (Figure 2), with an unusual high point for the wetland site, native material at t = 3 months (Figure 2(H)). Coincident with this, C:N ratios decreased over time, and appeared to stabilize after 10 months. In all litter, the amount of water-extractable DOC decreased until reaching ~zero after 16 months in situ. Regardless of incubation site, maple litter always had higher C:N and DOC and lower %N relative to native material. Comparing the behavior of maple litter across sites, no differences were evident until ~6 months, after which time the C:N, %N, and DOC levels became significantly lower for samples incubated at the wetland site.
3.3. Decomposition Rates
When all litter types are considered, the mean decomposition rate for plant material placed in the wetland was significantly higher than for the upland site (k(wetland) = 0.42 ± 0.02, k(upland) = 0.29 ± 0.02; p = 0.002). Within the wetland, differences in decomposition rates across litter types were not significant (k(wetland-native) = 0.47 ± 0.04, k(wetland-maple) = 0.40 ± 0.02; p = 0.29), and the shape of the two decomposition curves were similar (Figure 2(B)). In contrast, decomposition curves for the upland site were different across the two litter types (Figure 2(A)), especially during the first six months of the study, and decomposition rates were significantly higher for upland maple litter (k(upland-native) = 0.17 ± 0.02, k(upland-maple) = 0.35 ± 0.02; p = 0.29). When only maple litter is considered, decomposition rates were not significantly different across sites (k(upland-maple) = 0.40 ± 0.20, k(wetland-maple) = 0.35 ± 0.02; p = 0.33). At the upland site, maple litter initially decomposed fastest (i.e., OM remaining dropped first (Figure 2(A))), which was different from the wetland site (Figure 2(B)).
For each combination of site and litter-type, a multiple regression model was developed to assess what litter quality attributes were the best predictors of OM loss (Table 2). For all combinations except native material in the upland site, litter quality explained more than half of the variation in OM loss. The significant litter quality attributes were different for each litter type and site.
3.4. Substrate-Induced Respiration
Respiration was measured for native litter incubated at each sampling site (Figure 3). For the upland samples, respiration was never significantly different between bacteria and fungi. Spearman correlation analysis was performed to compare bacterial and fungal SIR to litter-quality attributes. Significant correlations for fungal SIR include negative relationships with %OM remaining (rs = −0.85) and C:N (rs = −0.73), and a positive relationship with %N (rs = 0.68). Bacterial SIR was also negatively related to %OM remaining (rs = −0.53), though not as strongly as fungi. Bacterial SIR was most strongly related to water-extractable DOC content (rs= −0.70).
Respiration at the wetland site was ~5-fold higher than for the upland site (note difference in scale for Figure 3(A) and Figure 3(B)). Bacterial respiration was generally lower than fungal, though not significantly different at the 3- or 10-month sampling. In contrast to the upland site, %OM remaining was not strongly correlated with

Table 1. Initial attributes of plant litter quality (mean ± standard error, N = 8 per group). Superscript letters designate statistically significant subgroups via Tukey’s post hoc test following ANOVA (α = 0.05).
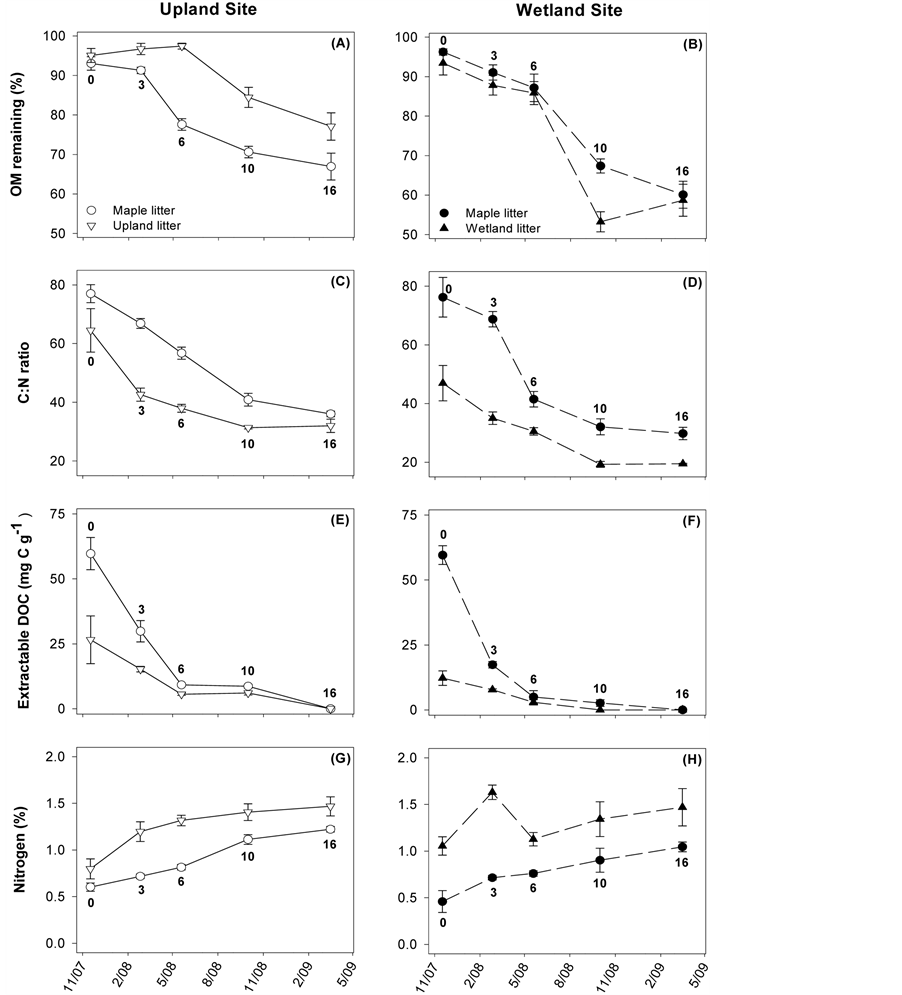
Figure 2. Temporal patterns for litter quality variables associated with the decomposition of maple litter (circles), native upland litter (down triangles), or native wetland litter (up triangles). Incubations took place at either the upland (open symbols, left column) or wetland (closed symbols, right column) site. The bold number next to each symbol corresponds to the number of months of field incubation at the time of sample collection. Points are means ± standard error, each with N = 8.
SIR (rs for bacteria: −0.13, for fungi: −0.17). The only strong correlations between SIR and litter quality were for DOC content (rs for bacteria: −0.60, for fungi: −0.61); all other |rs| < 0.40.
3.5. Microbial Community Composition
Microbial community composition was evaluated for native litter for all time points (Figure 4). For both bacterial and fungal community structure, NDMS of the TRFLP data produced a two dimensional representation of
Table 2. Results of a multiple regression comparing OM remaining (%) to litter quality. Regression coefficients are reported only when the attribute was a significant component of the final model. All R2 are significant with p < 0.01 except Native-Upland with p = 0.04.
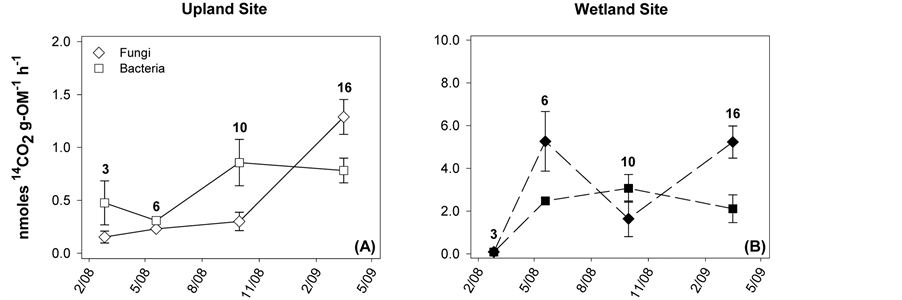
Figure 3. Bacterial and fungal SIR rates for native litter incubated at either site. Points are means ± standard error, each with N = 6. The number by each symbol corresponds to the number of months the sample incubated in the field before collection.
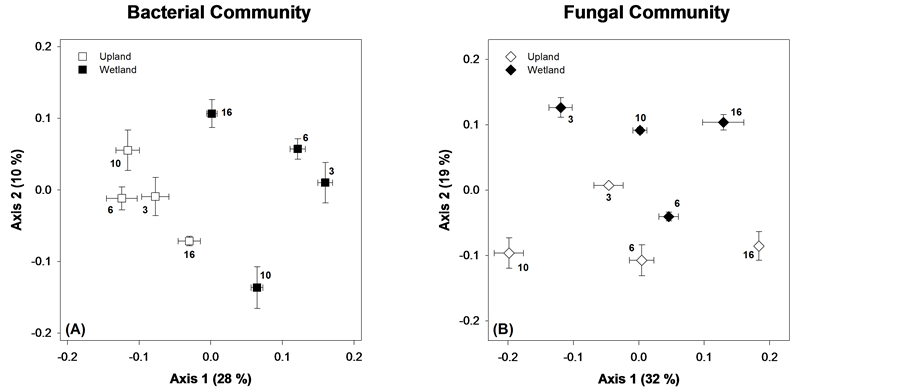
Figure 4. NDMS of microbial communities on native litter. Points are means ± standard error, each with N = 6. The bold number by each symbol corresponds to the number of months the sample incubated in the field before collection.
the relationship among samples with stress ≤0.20. At every time point, there was a difference across sites in the microbial community (ANOSIM, all p ≤ 0.03). For the bacteria, there was a strong separation of upland and wetland assemblages on Axis 1 (28% of variance), showing a large effect of site. The bacterial community showed clear temporal shifts within sites, which manifest on both axes 1 and 2. Bacterial community structures in the upland site were not significantly different for the first 10 months (ANOSIM, p = 0.25) followed by a significant (p = 0.0005) shift at month 16. In contrast, the wetland bacterial community was significantly different at every sampling event (all p < 0.03).
Fungal community composition was significantly different between all time points for both sites (ANOSIM, all p ≤ 0.03). Temporal changes in community composition were larger for fungi, with most of the change occurring on NDMS Axis 1 (32% of variance explained). Both sites showed correlations between microbial community and litter quality variables, but the strength of these correlations were stronger at the upland (Table 3).
Community composition was also compared across litter types (maple versus native) for the final set of samples, taken at 16 months (Figure 5). For the bacterial community, effects of both site and litter type are evident. For fungi, only site affects were detected.
4. Discussion
4.1. Decomposition Rates
Overall, decomposition rates were higher at the wetland site compared to the upland site. This finding is contrary to the prevailing hypothesis that decomposition is suppressed under saturated conditions, and suggests that
Table 3. Results of several Mantel tests correlating bacterial and fungal community structure with litter quality attributes. Asterisks (*) denote statistically significant relationships following sequential Holm-Bonferroni correction with initial α = 0.05.
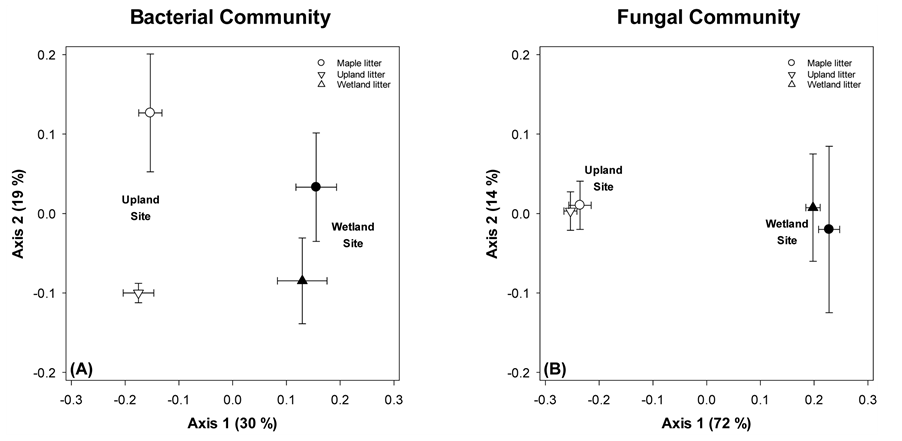
Figure 5. NDMS of microbial communities on native and maple litter across sites following 16 months of in situ incubation. Points are means ± standard error, each with N = 6. The bold number by each symbol corresponds to the number of months the sample incubated in the field before collection.
other factors were at play in this study. One possibility is that, despite being highly saturated (Figure 1(A)), soils at the wetland site were not always anaerobic; this is supported by redox potential in the soil being, at times, either close to or above 300 mV (Figure 1(B)). Further, it is likely that wetland litter experienced periodic influxes of nutrients from the surface water body, which could stimulate microbial activity [29] . Another potential explanation for these results is that moisture limitation at the upland site suppressed those decomposition rates. In particular, although the upland maple-litter k value (0.35) was similar to temperate ecosystem averages (0.36), it was lower than maple decay rates found in other studies [8] [30] -[32] . The native upland-litter k constant was also low (0.17) compared to other forest decay rates [8] . This could be due to the suboptimal water content during the summer months when the gravimetric soil moisture content was below 30% [4] [33] . Along these lines, it is worth noting that litter decay in the wetland was not exceptional compared to other emergent macrophyte decay rates. Some published decay rates of Typha were even higher (~0.75) [11] [14] [34] , and considerable variation has been noted based on plant species [35] .
When the same litter type (maple) was incubated at the two different sites, we saw no statistically significant differences in decay rates, which suggests that litter quality may also be a major determinant of the speed of decomposition. The effects of litter quality were also evident when looking within sites and comparing the two litter types (Figure 2(A) and Figure 2(B)). These differences in OM breakdown coincided with temporal changes in litter quality which were site-specific. Site effects on litter quality can be well explained using C:N as an example. Specifically, C:N ratios of maple litter in the wetland environment decreased faster and stabilized lower than maple litter in the upland environment (Figure 2(C) and Figure 2(D)). These patterns of changing C:N ratios may be thought of in two ways, which both have consequences for decomposition activity. First, the size of the C:N gap is indicative of the magnitude of N limitation and, in turn, the fate of the N; either immobilization or ammonification [35] . The faster drop for the wetland site suggests that the microbial communities more quickly reached a point in which N was not limiting and no longer needed to be immobilized. Alternately, the lower C:N may represent differences in the specific metabolic functions of the microbial communities. For example, anaerobic bacteria have been found to form efficient concerted enzyme complexes to degrade cellulose known as cellulosomes, which are not present in aerobic bacteria [17] [36] . An abundance of cellulosomes would lead to high respiration rates and a more rapid decrease in total litter C content relative to N. The interplay of site and quality can best be understood by examining the results of the multiple regression analyses (Table 2), which demonstrated various aspects of litter quality to be important for different starting materials at separate sites. Interestingly, the C:N ratio helped explain a large portion of the change in %OM remaining at the wetland. This suggests that the C:N dynamics of the litter and microbes are influential in the processes underlying decomposition in the wetland regardless of litter type.
As discussed above, the most obvious difference between the two sites is moisture availability, which could be a direct abiotic driver of decomposition rates by mediating: 1) oxygenation/redox status, 2) inorganic nutrient subsidies, and/or 3) water availability. In addition, moisture content could impose indirect litter-quality mediated effects, via leaching for example. Leaching could remove essential nutrients and decrease availability of labile C substrates, thus having a negative impact on decomposition rates. However, the relative impact of leaching depends on initial litter quality and the extent to which the plant constituents are water-extractable under a given set of environmental conditions. For example, in this study, initial DOC was higher for maple compared to either native litter (Table 1), but maple was leached rapidly (Figure 2(E) and Figure 2(F)). Within six months, DOC content was similar for each pair of litter types and slightly higher at the upland site. Another mechanism by which moisture availability could impose an indirect effect on decomposition is via priming, which is the process whereby increased labile C inputs may stimulate decomposition of more recalcitrant C. The wetland microbial communities likely had greater access to allochthonous labile C and nutrients dissolved in solution [18] [35] [37] and thus greater potential for priming effects, relative to the upland site. In contrast, microbes in the drier upland site were limited to the labile C and nutrients available in the immediate litter, either as initial sugars and glycosides, or to those accumulated through lignin and holocellulose depolymerization. This was well reflected in the litter quality components that best explained %OM loss in the upland: DOC (R2 = 0.69). In contrast, C:N and N concentration were the important predictors of OM loss (R2 = 0.64) when the same litter type (maple) was incubated in the wetland.
4.2. Microbial Communities
Bacterial and fungal communities’ respective SIR contributions fluctuated over time (Figure 3, assessed for native litter only), however not as expected based on the literature. Previous work has suggested an orderly succession from bacterial to fungal functional dominance, at least for upland sites, and is believed to be driven by a shift in litter quality—initial material having more labile compounds and aged material being primarily recalcitrant residues [16] [18] [19] . While this trend was visible at the upland site (Figure 3(A)), bacterial and fungal SIR was not significantly different for any of the time points. At the wetland site, we expected bacteria to dominate overall, as it is frequently assumed that saturated conditions suppress fungal activity; instead, we observed high levels of activity by both groups (Figure 3(B)). This result could be due to the fact that, despite high soil saturation (Figure 1(A)), redox conditions suggest that aerobic conditions occurred with some frequency (Figure 1(B)). These findings for the wetland site are consistent with Su et al. [14] , who compared several wetland litters and similarly found neither fungal nor bacterial production ubiquitously dominated.
Although neither site was characterized by bacterial or fungal dominance of SIR, there were differences between sites in the microbial community function. In particular, respiration values were generally higher in the wetland site and of the same order of magnitude as in other wetland studies [14] . In contrast, respiration rates at the upland site were lower than the wetland litter and when compared to SIR of other litters decomposing in forest environments [33] . This may be the result of the limited moisture environment, as discussed above, or particular traits of the upland native litter. Specifically, Quercus alba, the dominant upland native species, has been found to contain a high portion of recalcitrant C compounds [38] and may simply be hard to decompose.
The differences between the native litters extend beyond SIR to the microbial communities present and their compositional shifts throughout decomposition. The most pronounced difference was in the bacterial communities (Figure 4(A)). For the upland site, community composition was similar for the first three sampling events (3, 6, and 10 months were not different via ANOSIM), and then changed dramatically at 16 months. The bacteria community may have remained constant in the upland site because harsher conditions only allowed for survival of a specific, relatively inactive community. Shifts in the composition of the upland bacterial community were strongly related to litter quality, particularly DOC availability and %N (Table 3). Bacterial communities in the wetland were more dynamic (Figure 4(A)) and did not correlate with any of the litter quality attributes we measured. This may be due to the more variable nature of the wetland environment, and suggests other environmental drivers may be at play. The strongest differences in the bacterial community profiles related to site, which were consistent for all time periods sampled.
Similar results were obtained for the fungal community (Figure 4(B)) in that communities changed dramatically over time and were quite different across sites. For both sites, community composition was strongly related to DOC availability, which suggests that higher levels of water extractable (presumably labile) DOC help determine what species of fungi predominate. This relationship could be direct (i.e., fungi responding to DOC) or it could be indirect and mediated via competition with bacteria. In addition to DOC, fungal community composition was related to %N (upland) and C:N (wetland), which suggests an overall potential for N limitation on fungal community structure.
For the final sampling event (t = 16 months), we compared the microbial communities from both maple and native litter to examine the long term effect of litter type as a determinant of microbial community structure (Figure 5). For the bacterial community, we saw a strong effect of site (separation on Axis 1, 30% of variance) but also a residual effect of litter type (maple litter positioned higher on Axis 2, 19% of variation). Overall, this indicates that the bacterial communities remained distinct based on initial OM despite 16 months of identical environmental conditions. In contrast, by this final sampling event, fungal community composition no longer showed any selection based on litter type. For both sites, native and maple litter had essentially identical fungal communities. Taken together, the bacterial and fungal results indicate that litter quality effects vary based on environmental conditions and depend on the microbial functional group under consideration; specifically both litter type and environment (site) were important determinants of bacterial community composition, while only environmental conditions (site effects) were important for fungi.
4.3. Conclusion
Results indicate that both plant litter type and incubation site were important in determining decomposition rates. Site-specific changes in litter quality associated with moisture availability may have driven this interaction. Further, both factors were important in structuring the bacterial and fungal communities, affecting composition and activity. Overall, these findings suggest that more nuanced conceptual models of OM breakdown are necessary, especially ones that consider interactive effects of environmental conditions and substrate availability. The results also suggest that conventional thinking about microbial communities, which often predict: 1) that decomposition follows a path of succession from labile decomposing bacteria to recalcitrant decomposing fungi, and 2) that anaerobic bacteria slowly decompose litter in hydric environments, is an over simplification that does not account for the caveats of the environment that effect decomposition and the microbial communities that underlie it. Future work should focus on understanding of these potential interactions.
Acknowledgements
We would like to thank E. Crawford for his advice and expertise, which increased the merit of this research, as well as A. Mills and L. Blum for their assistance with the SIR measurements. We thank J. Battistelli for his thoughtful reviews and logistical help, and J. Chanat for statistical advice. We acknowledge a VCU Rice Center Student Research Award to Rawls for partial funding of this research. This paper is contribution #44 from the VCU Rice Rivers Center.
References
- Jobbágy, E.G. and Jackson, R.B. (2000) The Vertical Distribution of Soil Organic Carbon and Its Relation to Climate and Vegetation. Ecological Applications, 10, 423-436. http://dx.doi.org/10.1890/1051-0761(2000)010[0423:TVDOSO]2.0.CO;2
- Liski, J., Perruchoud, D. and Karjalainen, T. (2002) Increasing Carbon Stocks in the Forest Soils of Western Europe. Forest Ecology and Management, 169, 159-175. http://dx.doi.org/10.1016/S0378-1127(02)00306-7
- McGuire, K.L. and Treseder, K.K. (2010) Microbial Communities and Their Relevance for Ecosystem Models: Decomposition as a Case Study. Soil Biology & Biochemistry, 42, 529-535. http://dx.doi.org/10.1016/j.soilbio.2009.11.016
- Prescott, C.E. (2010) Litter Decomposition: What Controls It and How Can We Alter It to Sequester More Carbon in Forest Soils? Biogeochemistry, 101, 133-149. http://dx.doi.org/10.1007/s10533-010-9439-0
- Trofymow, J.A., Moore, T.R., Titus, B., Prescott, C., Morrison, I., Siltanen, M., et al. (2002) Rates of Litter Decomposition over 6 Years in Canadian Forests: Influence of Litter Quality and Climate. Canadian Journal of Forest Research, 32, 789-804. http://dx.doi.org/10.1139/x01-117
- Powers, J.S., Montgomery, R.A., Adair, E.C., Brearly, F.Q., Dewalt, S.J., Castanho, C.T., et al. (2009) Decomposition in Tropical Forests: A Pan-Tropical Study of the Effects of Litter Type, Litter Placement and Mesofaunal Exclusion across a Precipitation Gradient. Journal of Ecology, 97, 801-811. http://dx.doi.org/10.1111/j.1365-2745.2009.01515.x
- Kirschbaum, M.U.F. (2010) The Temperature Dependence of Organic Matter Decomposition: Seasonal Temperature Variations Turn a Sharp Short-Term Temperature Response into a More Moderate Annually Averaged Response. Global Change Biology, 16, 2117-2129. http://dx.doi.org/10.1111/j.1365-2486.2009.02093.x
- Zhang, D., Hui, D., Luo, Y. and Zhou, G. (2008) Rates of Litter Decomposition in Terrestrial Ecosystems: Global Patterns and Controlling Factors. Journal of Plant Ecology, 1, 85-93. http://dx.doi.org/10.1093/jpe/rtn002
- Kayranli, B., Scholz, M. and Mustafa, A. (2010) Carbon Storage and Fluxes within Freshwater Wetlands: A Critical Review. Wetlands, 30, 111-124. http://dx.doi.org/10.1007/s13157-009-0003-4
- Mitsch, W.J. and Gosselink, J.G. (2007) Wetlands. John Wiley & Sons, Hoboken.
- Kuehn, K.A., Lemke, M.J., Suberkropp, K. and Wetzel, R.G. (2000) Microbial Biomass and Production Associated with Decaying Leaf Litter of the Emergent Macrophyte. Juncus effuses. Limnology and Oceanogrophy, 45, 862-870. http://dx.doi.org/10.4319/lo.2000.45.4.0862
- Reith, F., Drake, H.L. and Kusel, K. (2002) Anaerobic Activities of Bacteria and Fungi in Moderately Acidic Conifer and Deciduous Leaf Litter. FEMS Microbiology Ecology, 41, 27-35. http://dx.doi.org/10.1111/j.1574-6941.2002.tb00963.x
- Buesing, N. and Gessner, M.O. (2006) Benthic Bacterial and Fungal Productivity and Carbon Turnover in a Freshwater Marsh. Applied and Environmental Microbiology, 72, 596-605. http://dx.doi.org/10.1128/AEM.72.1.596-605.2006
- Su, R., Lohner, R.N., Kuehn, K.A., Sinsabaugh, R. and Neely, R.K. (2007) Microbial Dynamics Associated with Decomposing Typha angustifolia Litter in Two Contrasting Lake Erie Coastal Wetlands. Aquatic Microbial Ecology, 46, 295-307. http://dx.doi.org/10.3354/ame046295
- Strickland, M.S. and Rousk, J. (2010) Considering Fungal: Bacterial Dominance in Soils—Methods, Controls, and Ecosystem Implications. Soil Biology & Biochemistry, 42, 1385-1395. http://dx.doi.org/10.1016/j.soilbio.2010.05.007
- Chapin III, F.S., Matson, P.A. and Mooney, H.A. (2002) Principles of Terrestrial Ecosystem Ecology. Springer, New York.
- de Boer, W., Folman, L.B., Summerbell, R.C. and Boddy, L. (2005) Living in a Fungal World: Impact of Fungi on Soil Bacterial Niche Development. FEMS Microbiology Reviews, 29, 795-811. http://dx.doi.org/10.1016/j.femsre.2004.11.005
- Poll, C., Marhan, S., Ingwersen, J. and Kandeler, E. (2008) Dynamics of Litter Carbon Turnover and Microbial Abundance in a Rye Detritusphere. Soil Biology & Biochemistry, 40, 1306-1321. http://dx.doi.org/10.1016/j.soilbio.2007.04.002
- Dilly, O. and Irmler, U. (1998) Succession in the Food Web during the Decomposition of Leaf Litter in a Black Alder (Alnus glutinosa (Gaertn.) L.) Forest. Pedobiologia, 422, 109-123.
- Velvis, H. (1997) Evaluation of the Selective Respiratory Inhibition Method for Measuring the Ratio of Fungal: Bacterial Activity in Acid Agricultural Soils. Biology and Fertility of Soils, 25, 354-360. http://dx.doi.org/10.1007/s003740050325
- Ananyeva, N.D., Susyan, E.A., Chernova, O.V., Chernov, I.Y. and Makarova, O.L. (2006) The Ratio of Fungi and Bacteria in the Biomass of Different Types of Soil Determined by Selective Inhibition. Microbiology, 75, 702-707. http://dx.doi.org/10.1134/S0026261706060130
- Liu, W.T., Marsh, T.L., Cheng, H. and Forney, L.J. (1997) Characterization of Microbial Diversity by Determining Terminal Restriction Fragment Length Polymorphisms of Genes Encoding 16S rRNA. Applied and Environmental Microbiology, 63, 4516-4522.
- Hayashi, H., Sakamoto, M. and Benno, Y. (2002) Fecal Microbial Diversity in a Strict Vegetarian as Determined by Molecular Analysis and Cultivation. Microbiology and Immunology, 46, 819-831. http://dx.doi.org/10.1111/j.1348-0421.2002.tb02769.x
- Hanson, C.A., Allison, S.D., Bradford, M.A., Wallenstein, M.D. and Treseder, K.K. (2008) Fungal Taxa Target Different Carbon Sources in Forest Soil. Ecosystems, 11, 1157-1167. http://dx.doi.org/10.1007/s10021-008-9186-4
- Campbell, A.H., Meritt, D.W., Franklin, R.B., Boone, E.L., Nicely, C.T. and Brown, B.L. (2011) Effects of Age and Composition of Field-Produced Biofilms on Oyster Larval Setting. Biofouling: The Journal of Bioadhesion and Biofilm Research, 27, 255-265. http://dx.doi.org/10.1080/08927014.2011.560384
- Olson, J.T. (1963) Energy Storage and the Balance of Producers and Decomposers in Ecological Systems. Ecology, 44, 322-331. http://dx.doi.org/10.2307/1932179
- Mantel, N. (1967) The Detection of Disease Clustering and a Generalized Regression Approach. Cancer Research, 27, 209-220.
- Hammer, Ø., Harper, D.A.T. and Ryan, P.D. (2001) PAST: Palaeontological Statistics Software Package for Education and Data Analysis. Palaeontologia Electronica, 4, 9. http://palaeo-electronica.org/2001_1/past/issue1_01.htm
- Battle, J.M. and Golladay, S.W. (2001) Hydroperiod Influence on Breakdown of Leaf Litter in Cypress-Gum Wetlands. The American Midland Naturalist, 146, 128-145. http://dx.doi.org/10.1674/0003-0031(2001)146[0128:HIOBOL]2.0.CO;2
- Day, F.P. (1982) Litter Decomposition Rates in the Seasonally Flooded Dismal Swamp. Ecology, 63, 670-678. http://dx.doi.org/10.2307/1936787
- Aerts, R. (1997) Climate, Leaf Litter Chemistry and Leaf Litter Decomposition in Terrestrial Ecosystems: A Triangular Relationship. Oikos, 79, 439-449. http://dx.doi.org/10.2307/3546886
- Blair, J.M., Parmelee, R.W. and Beare, M.H. (1990) Decay Rates, Nitrogen Fluxes, and Decomposer Communities of Single-and Mixed-Species Foliar Litter. Ecology, 71, 1976-1985. http://dx.doi.org/10.2307/1937606
- Berg, B. and McClaugherty, C. (2008) Plant Litter: Decomposition, Humus Formation, Carbon Sequestration. Springer Verlag, Berlin. http://dx.doi.org/10.1007/978-3-540-74923-3
- Davis, C.B. and van der Valk, A.V. (1978) The Decomposition of Standing and Fallen Litter of Typha glauca and Scirpus fluviatilis. Canadian Journal of Botany, 56, 662-675. http://dx.doi.org/10.1139/b78-073
- Reddy, K.R. and DeLaune, R.D. (2008) Biogeochemistry of Wetlands: Science and Applications. CRC Press, Boca Raton. http://dx.doi.org/10.1201/9780203491454
- Doi, R.H. and Kosugi, A. (2004) Cellulosomes: Plant-Cell-Wall-Degrading Enzyme Complexes. Nature Reviews Microbiology, 2, 541-551. http://dx.doi.org/10.1038/nrmicro925
- Fontaine, S., Mariotti, A. and Abbadie, L. (2003) The Priming Effect of Organic Matter: A Question of Microbial Competition? Soil Biology & Biochemistry, 35, 837-843. http://dx.doi.org/10.1016/S0038-0717(03)00123-8
NOTES

*Corresponding author.