Open Journal of Ecology
Vol.2 No.3(2012), Article ID:21611,6 pages DOI:10.4236/oje.2012.23013
Effect of localized oil spills on Atlantic loggerhead population dynamics
![]()
1Department of Mathematics, Oregon State University, Corvallis, USA
2Department of Mathematics, California State University Bakersfield, Bakersfield, USA
3Department of Mathematics, Luther College, Decorah, USA
4Department of Mathematics, Arizona State University, Tempe, USA
5Department of Mathematics, The University of South Dakota, Vermillion, USA; *Corresponding Author: jflores@usd.edu
Received 30 April 2012; revised 2 June 2012; accepted 30 June 2012
Keywords: Loggerhead Sea Turtle; Oils Spill; Matrix Model; Simulations; Population Ecology
ABSTRACT
The purpose of this study is to analyze the population dynamics of loggerhead sea turtles (Caretta caretta) affected by localized oil spills. Methods include development of a spatial, stageclassified matrix model parameterized for the following primary loggerhead populations: Gulf of Mexico, western North Atlantic Ocean, and Florida peninsula. Oil spills are simulated deterministically in each population's nesting region, with 1) oil-induced mortality ranging from 25% to 100% and 2) stage classes affected either proportionally or equally. A transient sensitivity analysis was performed to determine the parameters most influential to the population growth rate. Results suggest that increased protection and understanding of young sea turtles found in the Sargasso Sea is essential to the survival of the species. In addition, findings provide insights into the population dynamics of the Atlantic loggerhead turtles and identify conservation measures appropriate in each oil spill case.
1. INTRODUCTION
The loggerhead turtle (Caretta caretta) is one of six endangered sea turtles in the Atlantic Ocean threatened by human activities [1]. One example of human impact on the population is frequent oil spills in the Gulf of Mexico and along the Florida peninsula [1]. On April 20, 2010, the explosion of the Deepwater Horizon oil rig resulted in a major oil spill that threatened the loggerhead population [2]. Understanding the effect of oil spills on the population dynamics is of critical importance for the preservation of the species; however, data regarding the mortality rates of turtles exposed are sparse. While the weathering of specific crude oil compounds has been studied [3,4], it is unknown which of these, if any, are particularly toxic to the loggerhead and other wildlife.
The loggerhead population is declining and mortality of adults and large immatures appears to be a key factor [5-7]. Adult turtles lay eggs on nesting beaches in the Gulf of Mexico, Florida peninsula, and Carolina shores. Hatchling turtles disperse to the Sargasso Sea, and then return to coastal regions after approximately nine years. Once mature, turtles nest on the beaches where they hatched [1].
Existing models of loggerhead turtles focus on the stage classes most sensitive to long-term population growth. Crouse et al. [5] published one of the first models in 1987: a stage-classified matrix parameterized with data collected by Frazer in 1983 [8]. In 1994, Crowder et al. [6] developed a model to analyze the impact of turtle excluder devices (TEDs) on the population of turtles that come in contact with trawl fisheries in the southeastern United States. In 2003, Heppell et al. [7] used newer data to create two matrix models in hopes of bounding the true values for survival parameters and stage durations. We are not aware of any published models of the effect of oil spills on loggerheads. However, following the 1989 Exxon Valdez catastrophe, Reed et al. [9] modeled oil’s effect on migrating fur seals and examined heuristic oil-induced mortality rates ranging from 25% - 100%.
Our research is motivated by the potential impact of the Deepwater Horizon oil spill on loggerhead turtles in the western North Atlantic Ocean. We have developed a system of stage-classified, spatial matrix models whose survival parameters can be modified to simulate oil spills of varying regions and initial toxicities. We did this by creating separate models for each primary nesting region of the Atlantic loggerhead turtle population. Since neritic immature turtles forage outside their nesting region, a localized spill may affect turtles from any nesting region, making the spatial component of our model crucial.
2. MATERIAL AND METHODS
We first modeled the Atlantic loggerhead population without the impact of an oil spill. Since a negligible number of loggerhead turtles nest away from their hatching region [10], we modeled the population from each nesting region with an independent matrix representation. The populations are classified by their stage class and current location.
We focused our study on the three primary nesting regions in the North Atlantic Ocean [11] as well as the Sargasso Sea (denoted S). The North (N) is defined as the northeastern corner of Florida through southern Virginia. Peninsular Florida (F) is the main Florida peninsula (not including the Florida islands). The Northern Gulf of Mexico (G) includes the western panhandle of Florida through the Texas-Mexico border [11].
We used stage classes corresponding to the five major life phases of the loggerhead turtle [7]. All turtles spend their first year as eggs/hatchlings (stage class B) in their hatching region. In the second year, they become oceanic immatures (Y) and migrate to the Sargasso Sea in the Atlantic Ocean. After nine years, turtles disperse to any of the three coastal/nesting regions (G, F, N) [12], where they spend a total of 19 years as first small (I) and then large (L) neritic immatures [7]. After sexual maturation, turtles become adults (A) and return to their hatching region, where we assume they remain indefinitely. Although dispersal during non-breeding years has been suggested [13], the current data are inconclusive.
Based on this life cycle, we created a system of population projection matrices [12,14]. Each matrix Mj corresponding to region j = G, F, N has entries representing the fecundity, mortality, retention, and maturation rates of each stage/spatial class. The population distribution at year t is given in a 9 × 1 vector, Pj(t), containing the populations of each of the nine stage/spatial classes in the life cycle Figure 1. The matrix-vector product Pj(t + 1) = MjPj(t) represents the population distribution at year t + 1:
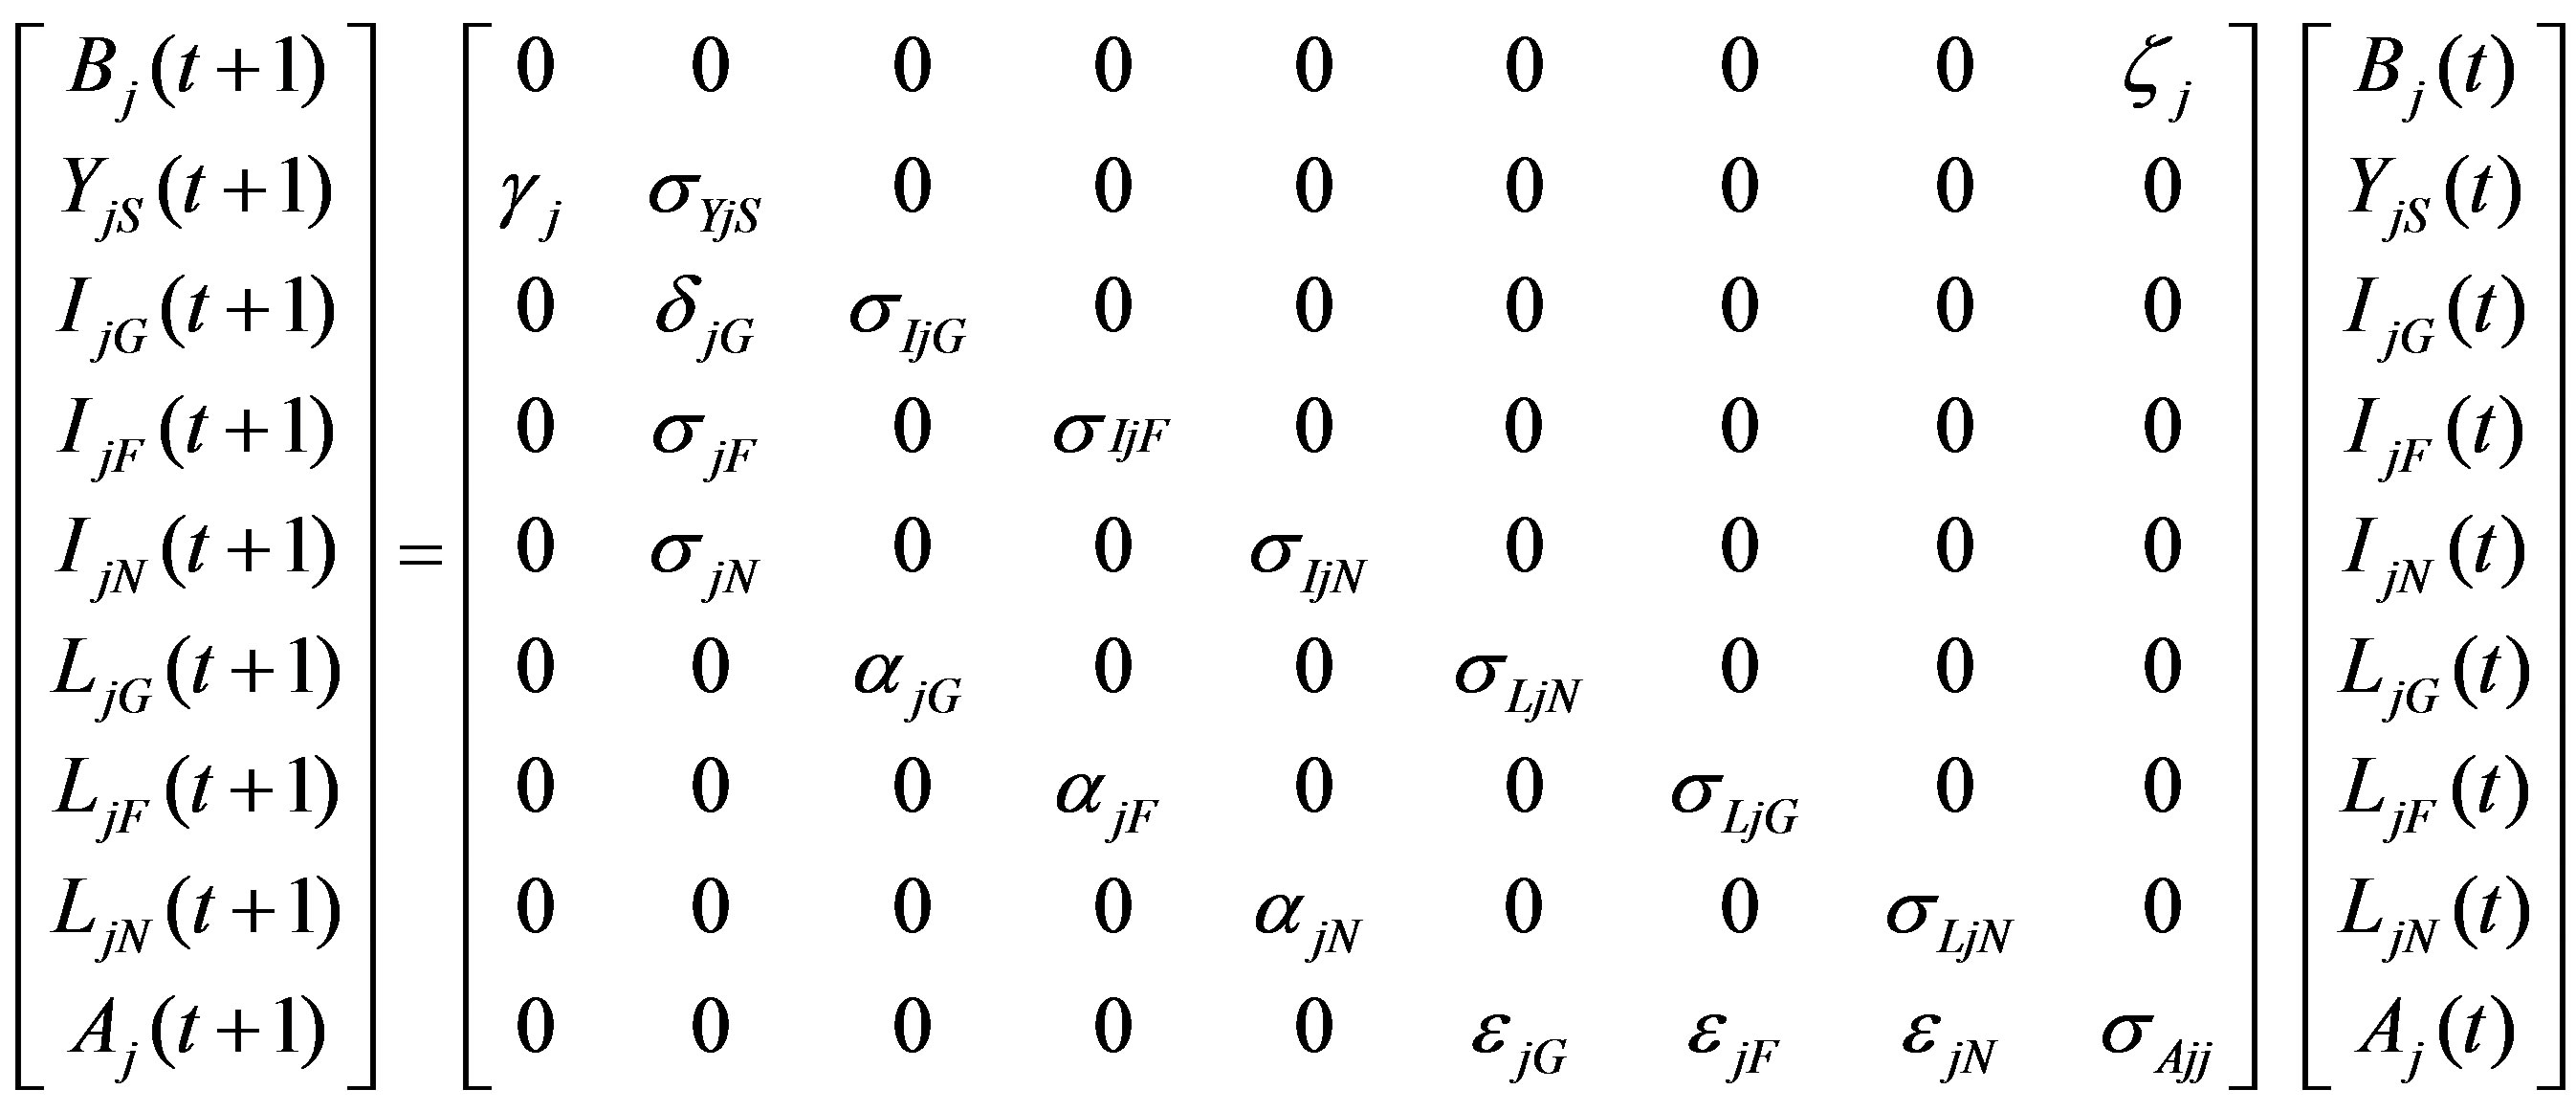

Figure 1. Life cycle of the turtle population from region j (j = G (Gulf), F (Florida), or N (North)). The first subscript of the state variable indicates region of origin; the second, current location. Parameters include fecundity (ζ), retention rates (σ), and maturation rates (γ, δ, α, ε) for hatchlings, oceanic imamtures, small neritic immatures, and large neritic immatures respectively.
As is standard for matrix population models, we modeled only the female population and assumed the male population remains relatively proportional [12] .
2.1. Parameter Estimation
Fecundity (ζj) is a critical parameter because it reflects the fertility of adult females. On average, females breed once every 2.8 years [15] and lay 3 - 5.5 clutches containing 100 - 126 eggs [11]. This gives an annual total of 174 eggs per female, of which, 45% - 70% survive to hatch [11]. The proportion of female hatchlings is temperature dependent, ranging from 0.88 in region F to an average of 0.62 in region N [16]. Each of these factors contributes to fecundity.
There are five survival proportions in our model, one for each stage class. The survival and maturation proportion of hatchlings is γj = 70% [11]. The average annual adult survival proportion is 0.82955 [7].
For stage classes lasting longer than 1 year, we followed [5] to derive the retention and maturation proportions from the survival proportion. Based on these calculations, we obtain the parameter values in Table 1.
Population censuses of loggerheads are limited to annual nest counts, which we use to estimate the number of adults breeding that year. In order to approximate the populations of the other classes, we assumed that the population distribution has stabilized. Using the rate of growth (given by the dominant eigenvalue of each projection matrix), we scaled the stable population distribution vectors (given by the corresponding eigenvector) such that their adult population component matches the most recent data [11]. This yields the initial populations given in Table 2.
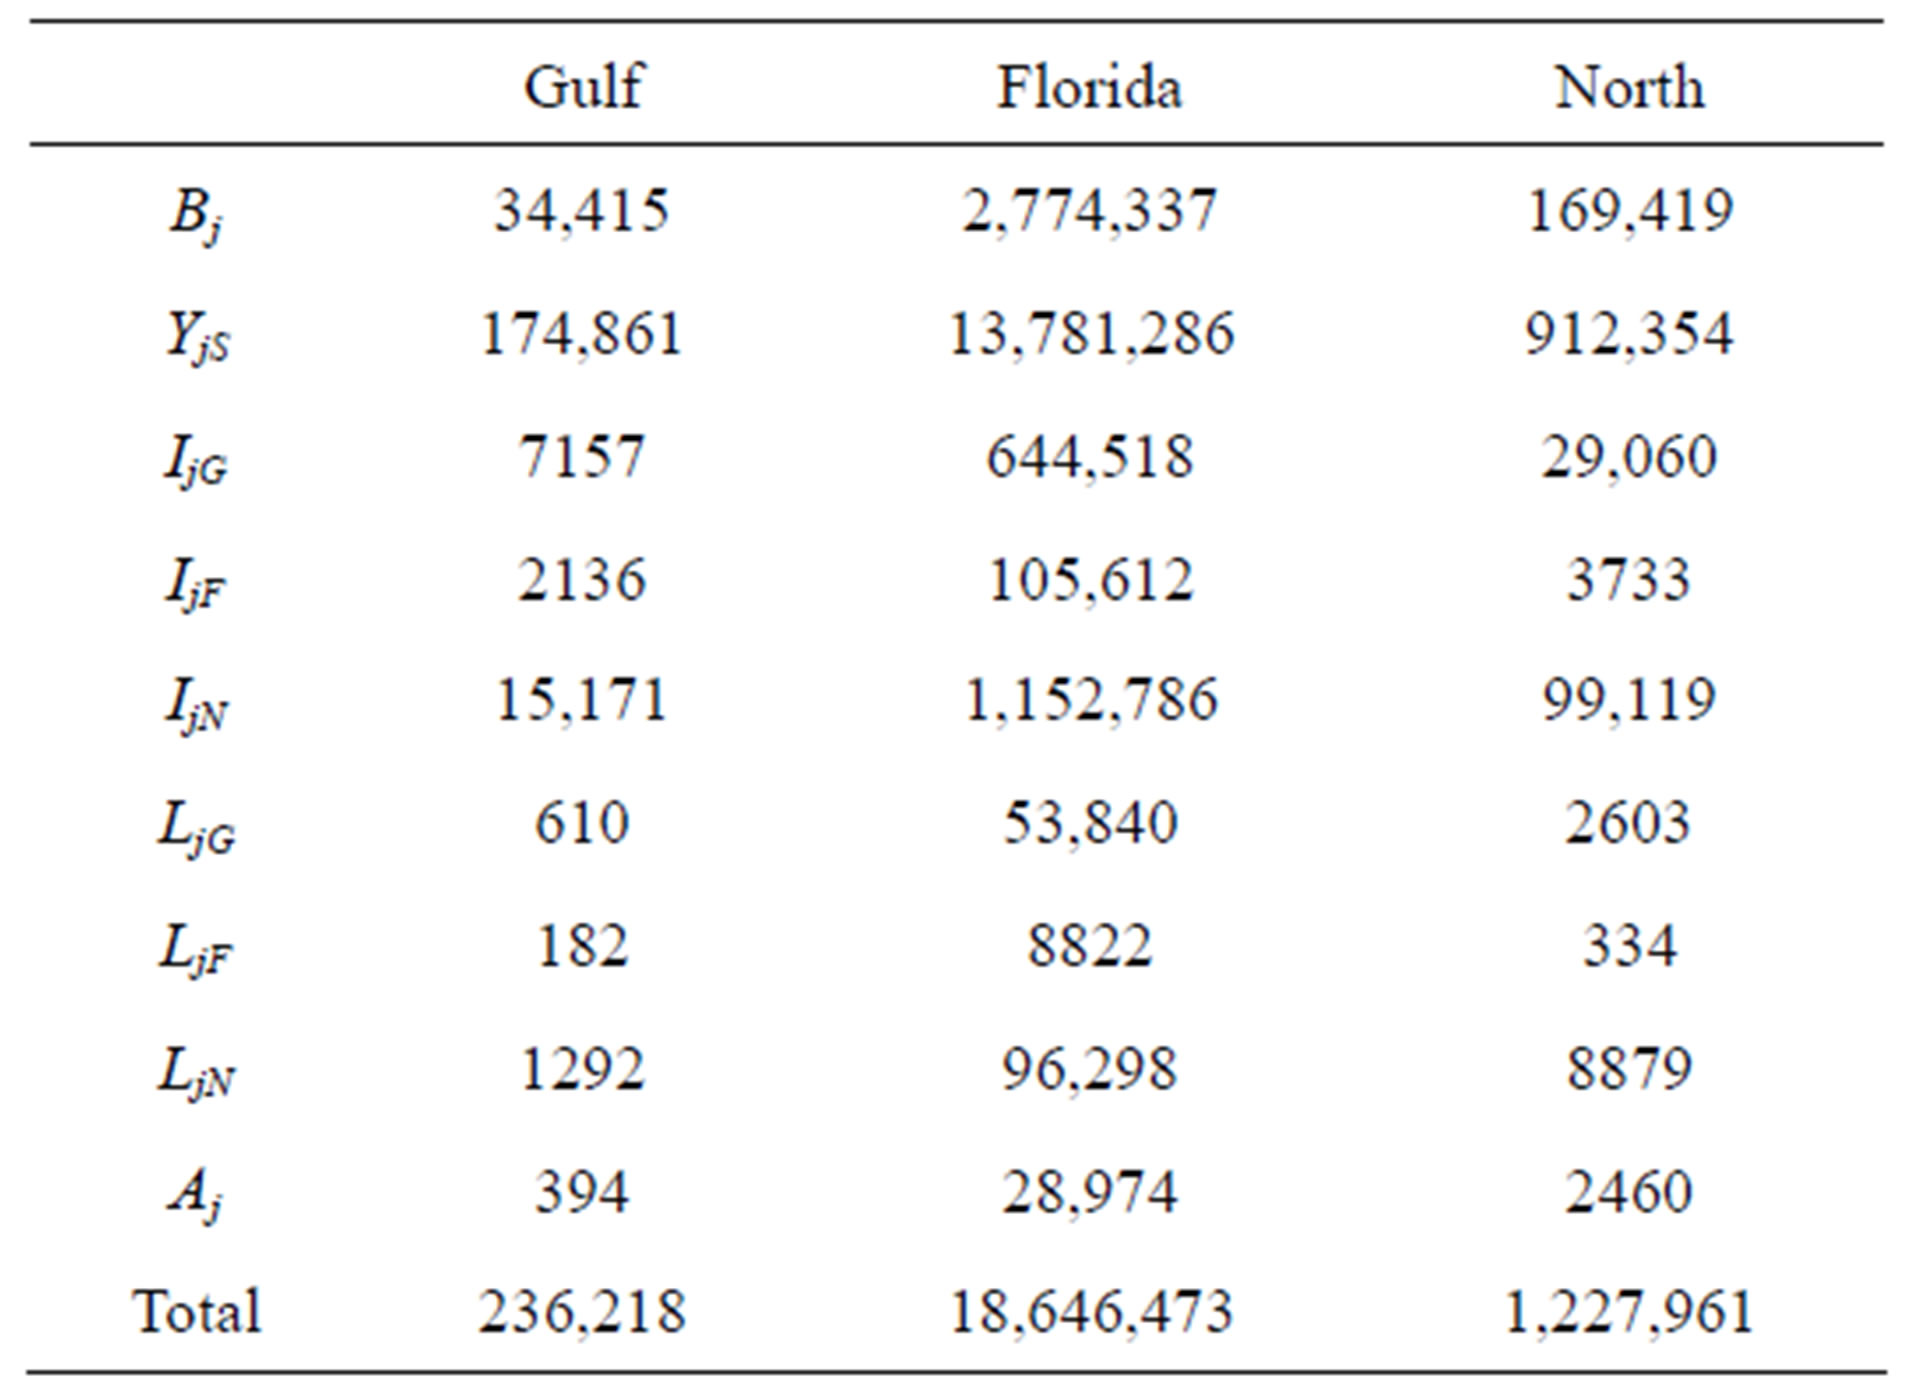
Table 1. Base parameters used in the model.
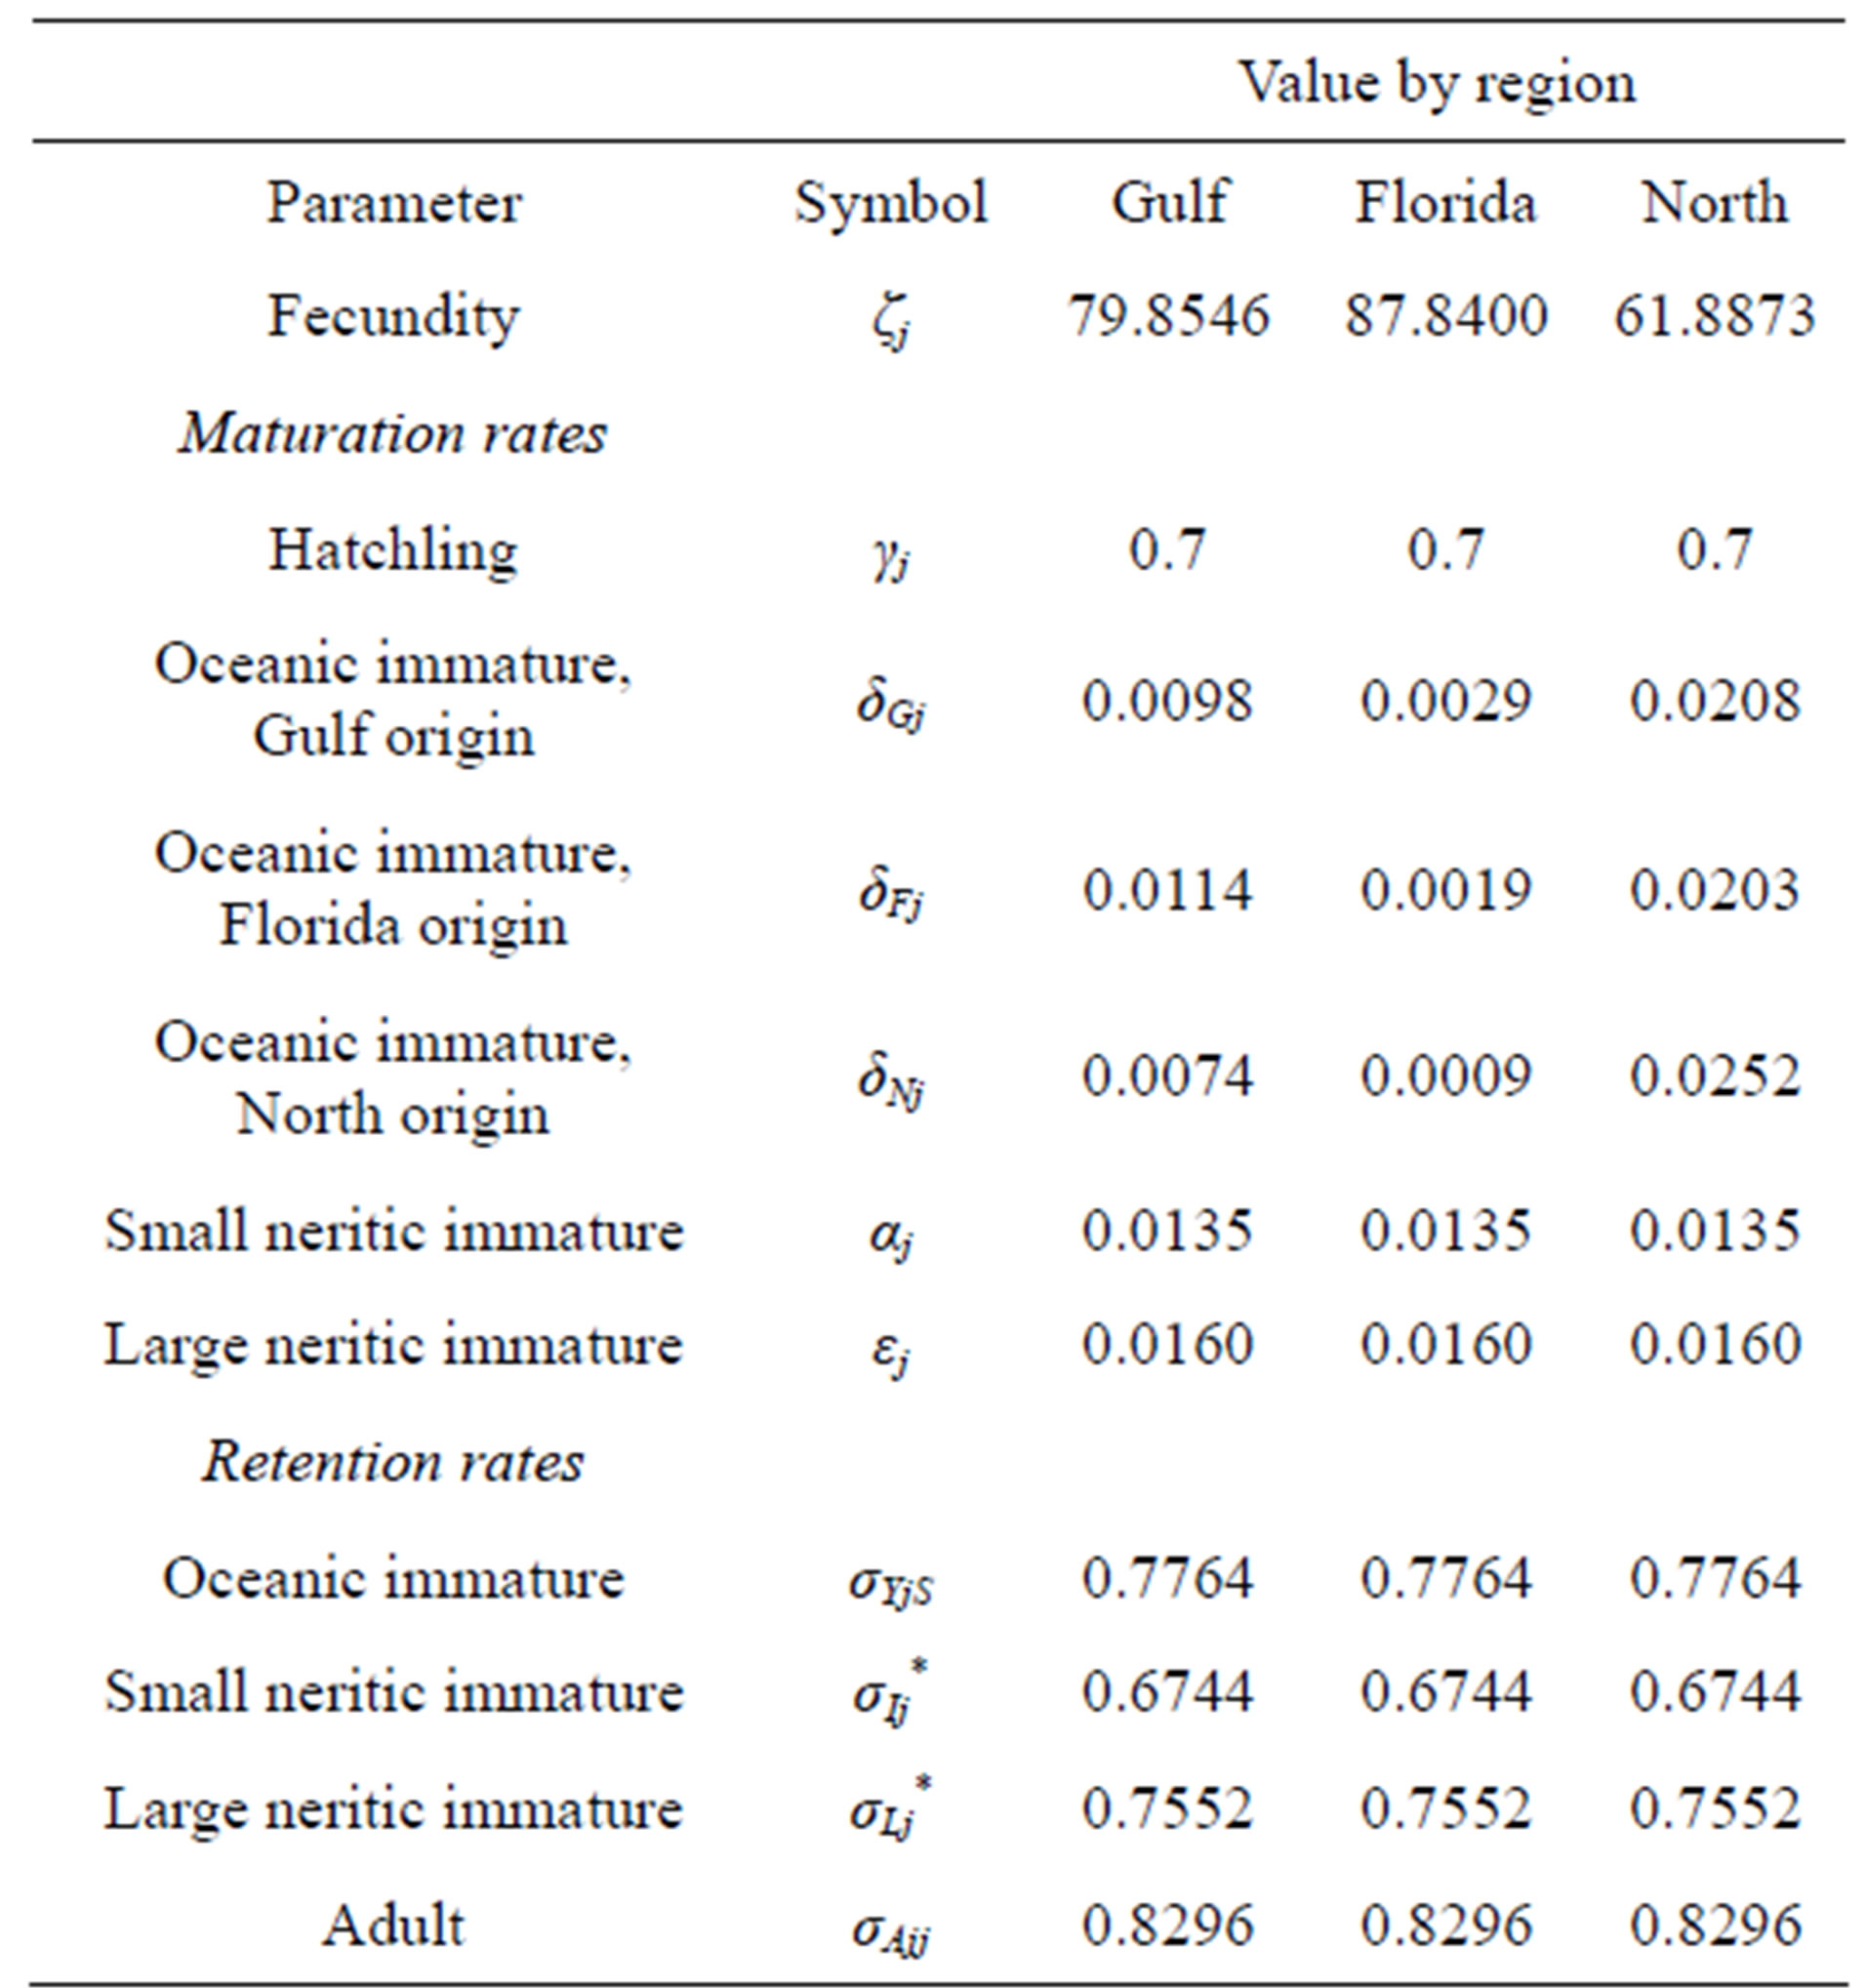
Table 2. Initial populations for each region, assuming a stable state distribution (*Indicate that the retention rate for neritic immatures in regions G; F and N is assumed to be the same).
2.2. Base Simulation
We used the mean values of the data given in ranges to run deterministic simulations of our population model. All populations decay exponentially since their dominant eigenvalues are less than 1 (0.9142 for Gulf, 0.9174 for Florida, 0.9064 for North).
We expect the North’s population to decrease the most in relation to its initial population, with a 5-year decline of 32.7% and a 20-year decline of 84.7%. The Gulf and Florida populations will have decreased by 81.8% and 80.1% respectively by year 20. This is congruent with the criteria for endangered species [17].
2.3. Oil Spill Simulation
To analyze the effects of an oil spill on the three populations, we introduced a spill into each of the three nesting regions. We did not trigger an oil spill in the Sargasso Sea because we are only considering drilling on the continental shelf. Thus, oceanic immature turtles, which are found in the Sargasso Sea, are not affected by the oil.
Due to the lack of data on oil’s toxicity to sea turtles, we used methodology similar to that of Reed et al. [9] and examined heuristic oil toxicities Θ = 25%, 50%, 75% and 100%. We assumed toxicity decays with a half-life of one year, so in every year n ≥ 1, oil toxicity is μn = (Θ)(21 − n). As a consequence, our projection matrices are time-dependent.
It has been suggested that oil has greater effect on younger individuals [1], but this is sufficiently inconclusive so as to require two scenarios. The first case is proportional or early-stage toxicity: only eggs and hatchlings suffer the full impact of the oil. Fecundity is reduced to ζj(1 − μn). After spending one year in oil, the proportion of surviving hatchlings is γj(1 − μn). The second case is equal toxicity: all stage classes (with the exception of oceanic immatures) are equally affected by oil. In this case, each annual survival proportion is reduced by a factor of (1 − μn).
3. RESULTS
The introduction of an oil spill accelerates population decline. To observe the long-term impacts of an oil spill we ran simulations over 20 years and with all combinations of spill region, toxicity, and turtle susceptibility. We illustrated with a Gulf oil spill, due to its relevance to the Deepwater Horizon oil spill, estimating a moderate starting toxicity of 50%. If turtles exhibit proportional susceptibility, the Gulf, Florida, and North populations decrease by 83.7%, 80.8%, and 84.8% respectively by year 20 (Figure 2). This is a 2.3%, 0.9% and 0.1%, respectively, decrease in population compared to baseline
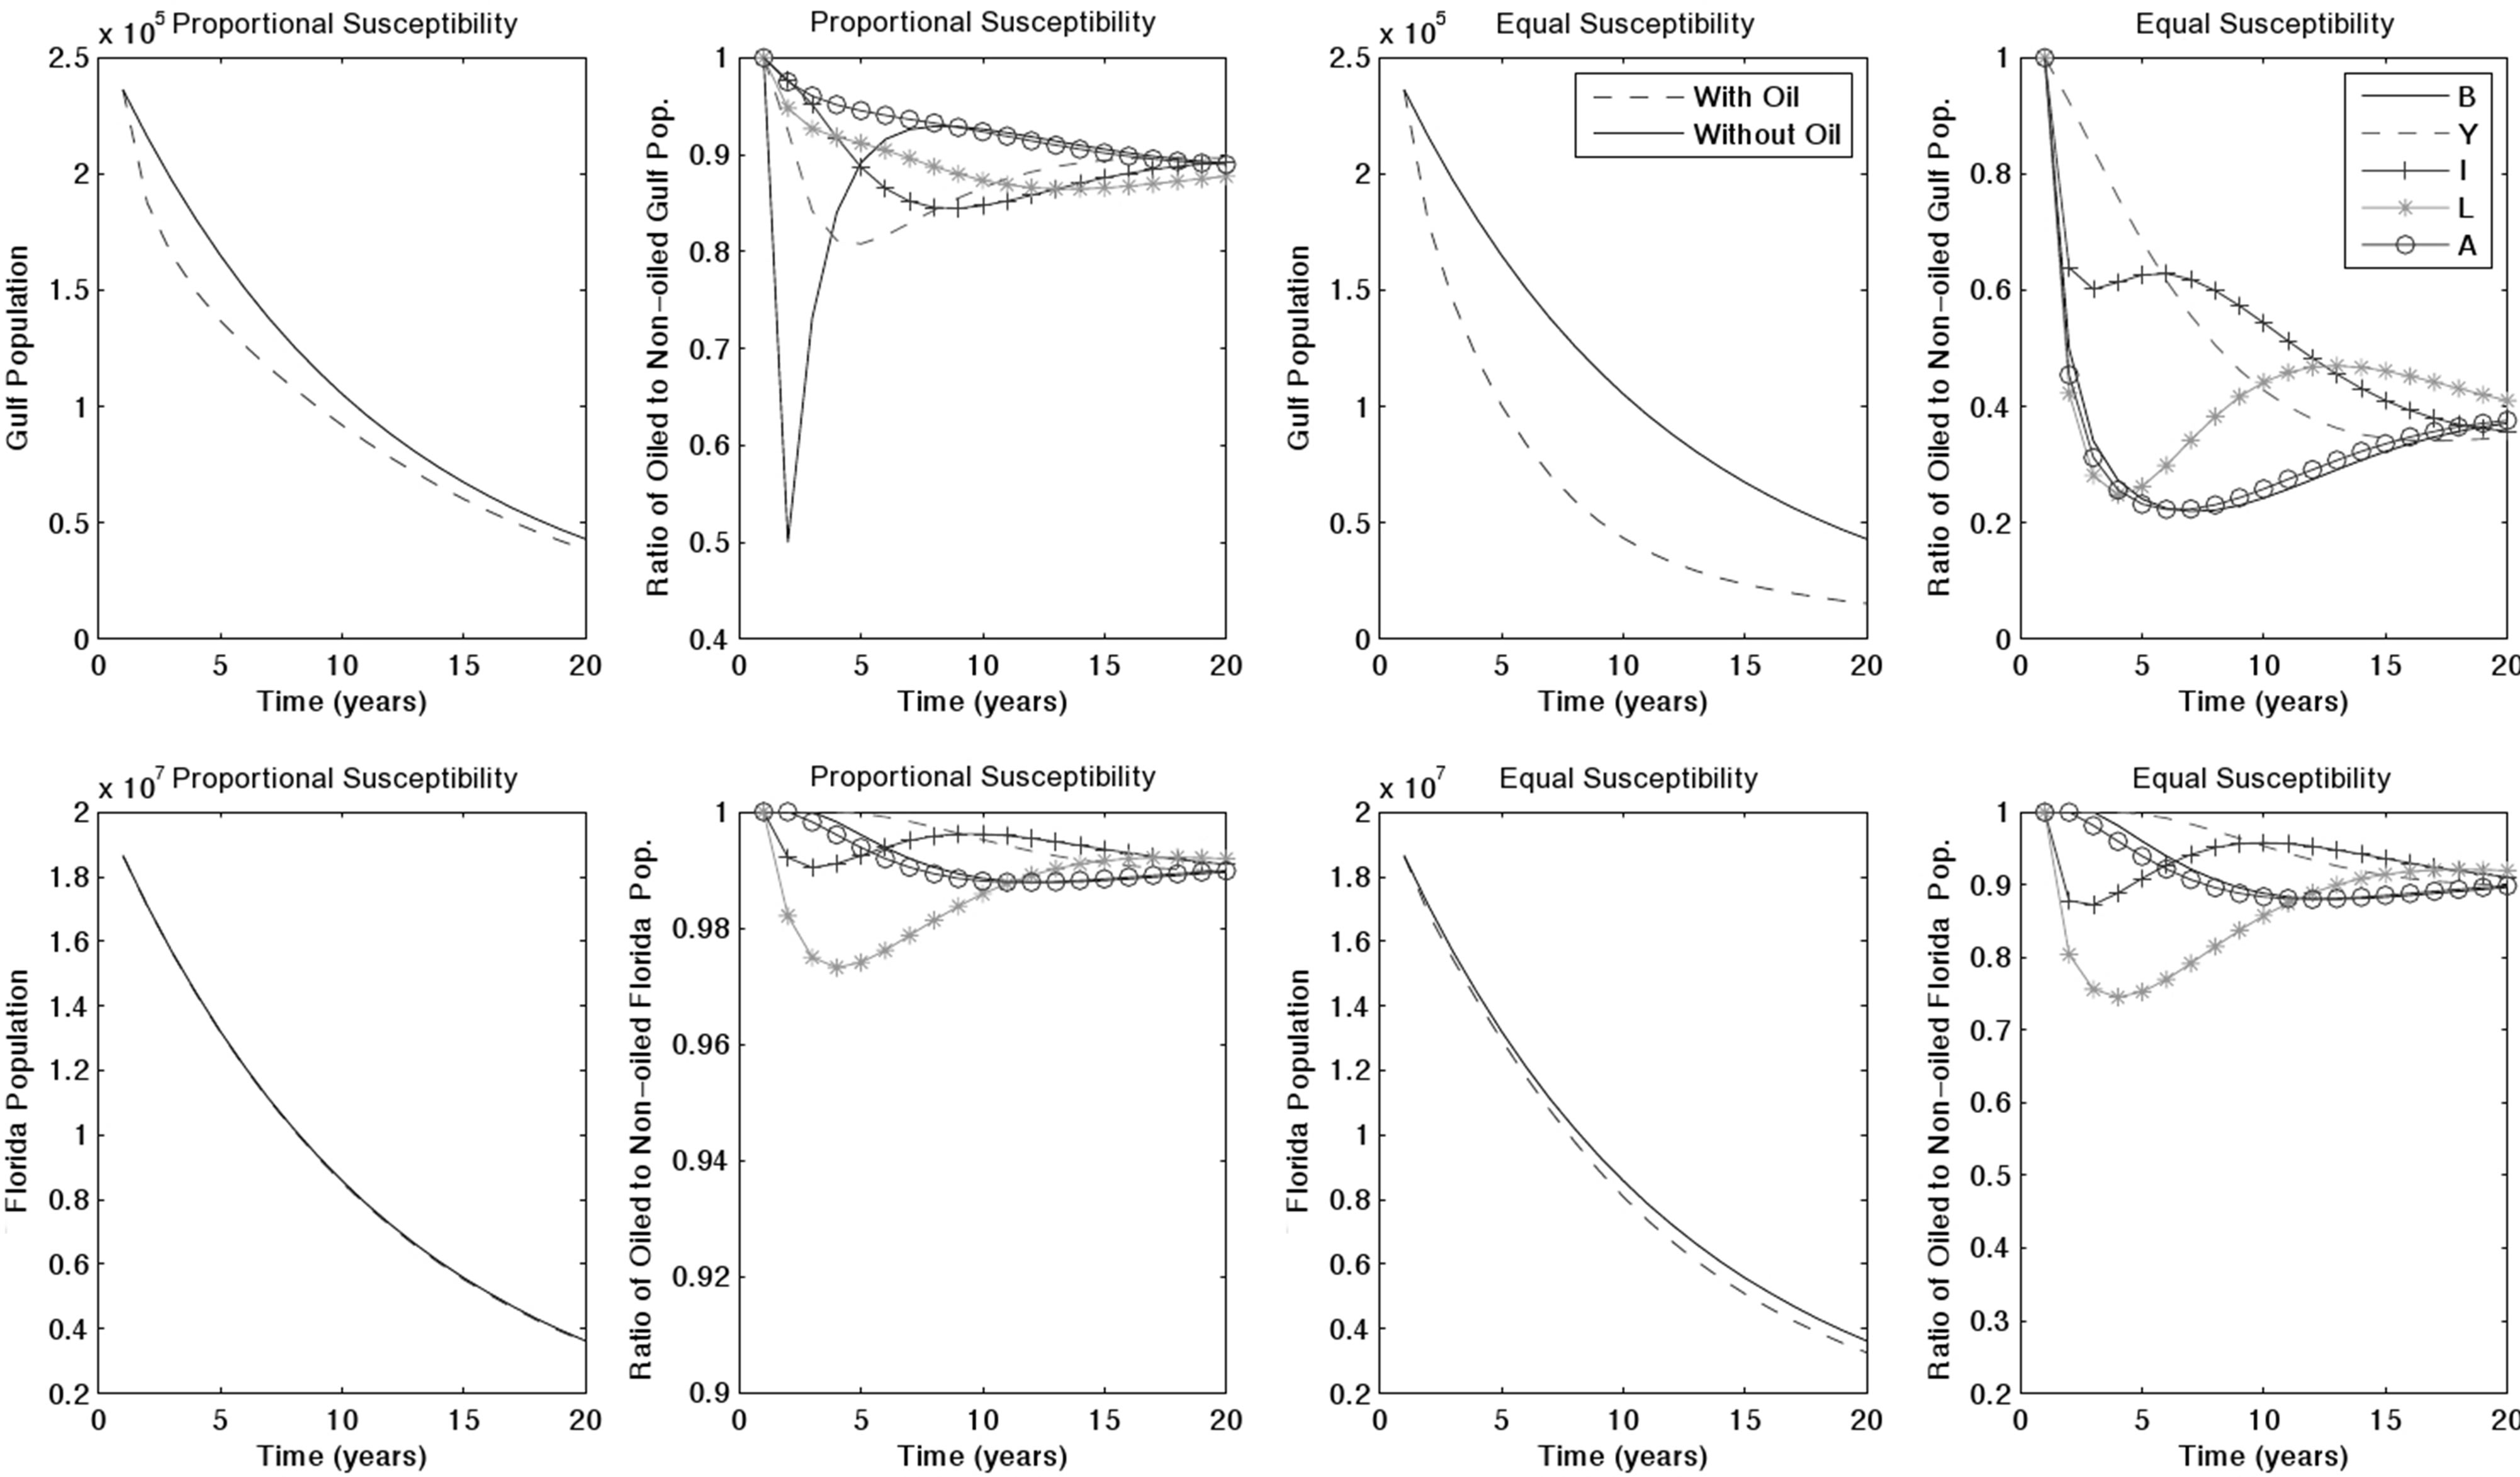
Figure 2. 20-years simulation of a Gulf oil spill with 50% initial toxicity.
simulation results in each region. In the same situation with equal susceptibility, populations decrease by 93.6%, 82.5%, and 85.6%, producing a 12.6%, 2.9%, and 1.1%, respectively, decline compared to baseline.
The most harmful case was a spill in the North, due both to its large native turtle population and to the large numbers of neritic immature turtles that forage in the North before.
Transient Sensitivity Analysis
The simulations provide insight into the impact of an uncontrolled oil spill. To determine the conservation priorities in the aftermath of a spill, we analyze transient sensitivity indices. These values indicate the effect that small perturbations in independent parameters of our model (turtle survival and oil toxicity) have on the shortterm population growth. The most sensitive parameters— those that elicit the largest changes in population growth —are the ones on which conservation should be focused. Transient sensitivity indices for the first five years of our simulation are determined using the process outlined by [18].
The sensitivity results for both susceptibility cases were similar (Figure 3). Growth rate is consistently the most sensitive to oceanic immature survival, which we anticipate is related to their immunity from the oil spill. The next most sensitive parameter is first fecundity, but within 1 - 2 years, becomes large neritic immature and adult survival, whose sensitivity indices continue to increase over time. The sensitivity index of oil toxicity is negative (as it is inversely related to growth rate) and relatively small, with decreasing magnitude over time due to the natural decay of oil.
4. DISCUSSION
The results of our simulations suggest that overall, the decline of the population of the loggerhead sea turtle is not greatly accelerated by a single, localized oil spill. With that stated, there is a long history of oil spills damaging sea turtle habitat [1], which is not considered in our study. Our simulations show small changes relative to baseline; however, the rapid population decline, even without the threat of oil spills, makes every sea turtle valuable. One of the key turtle populations is the oceanic immatures found in the Sargasso Sea, where they are protected from threats in coastal areas. While it may be difficult to improve their chances of survival, a greater understanding of this stage in the life cycle could impact turtle populations.
Conservation efforts should focus on the most sensitive parameters as described by our transient sensitivity indices. Our top priority should be to determine and mitigate potential threats to oceanic immatures. Additional efforts should focus on maintaining fecundity and hatchling survival immediately following an oil spill by protecting breeding females, beaches, and nests. Examples of
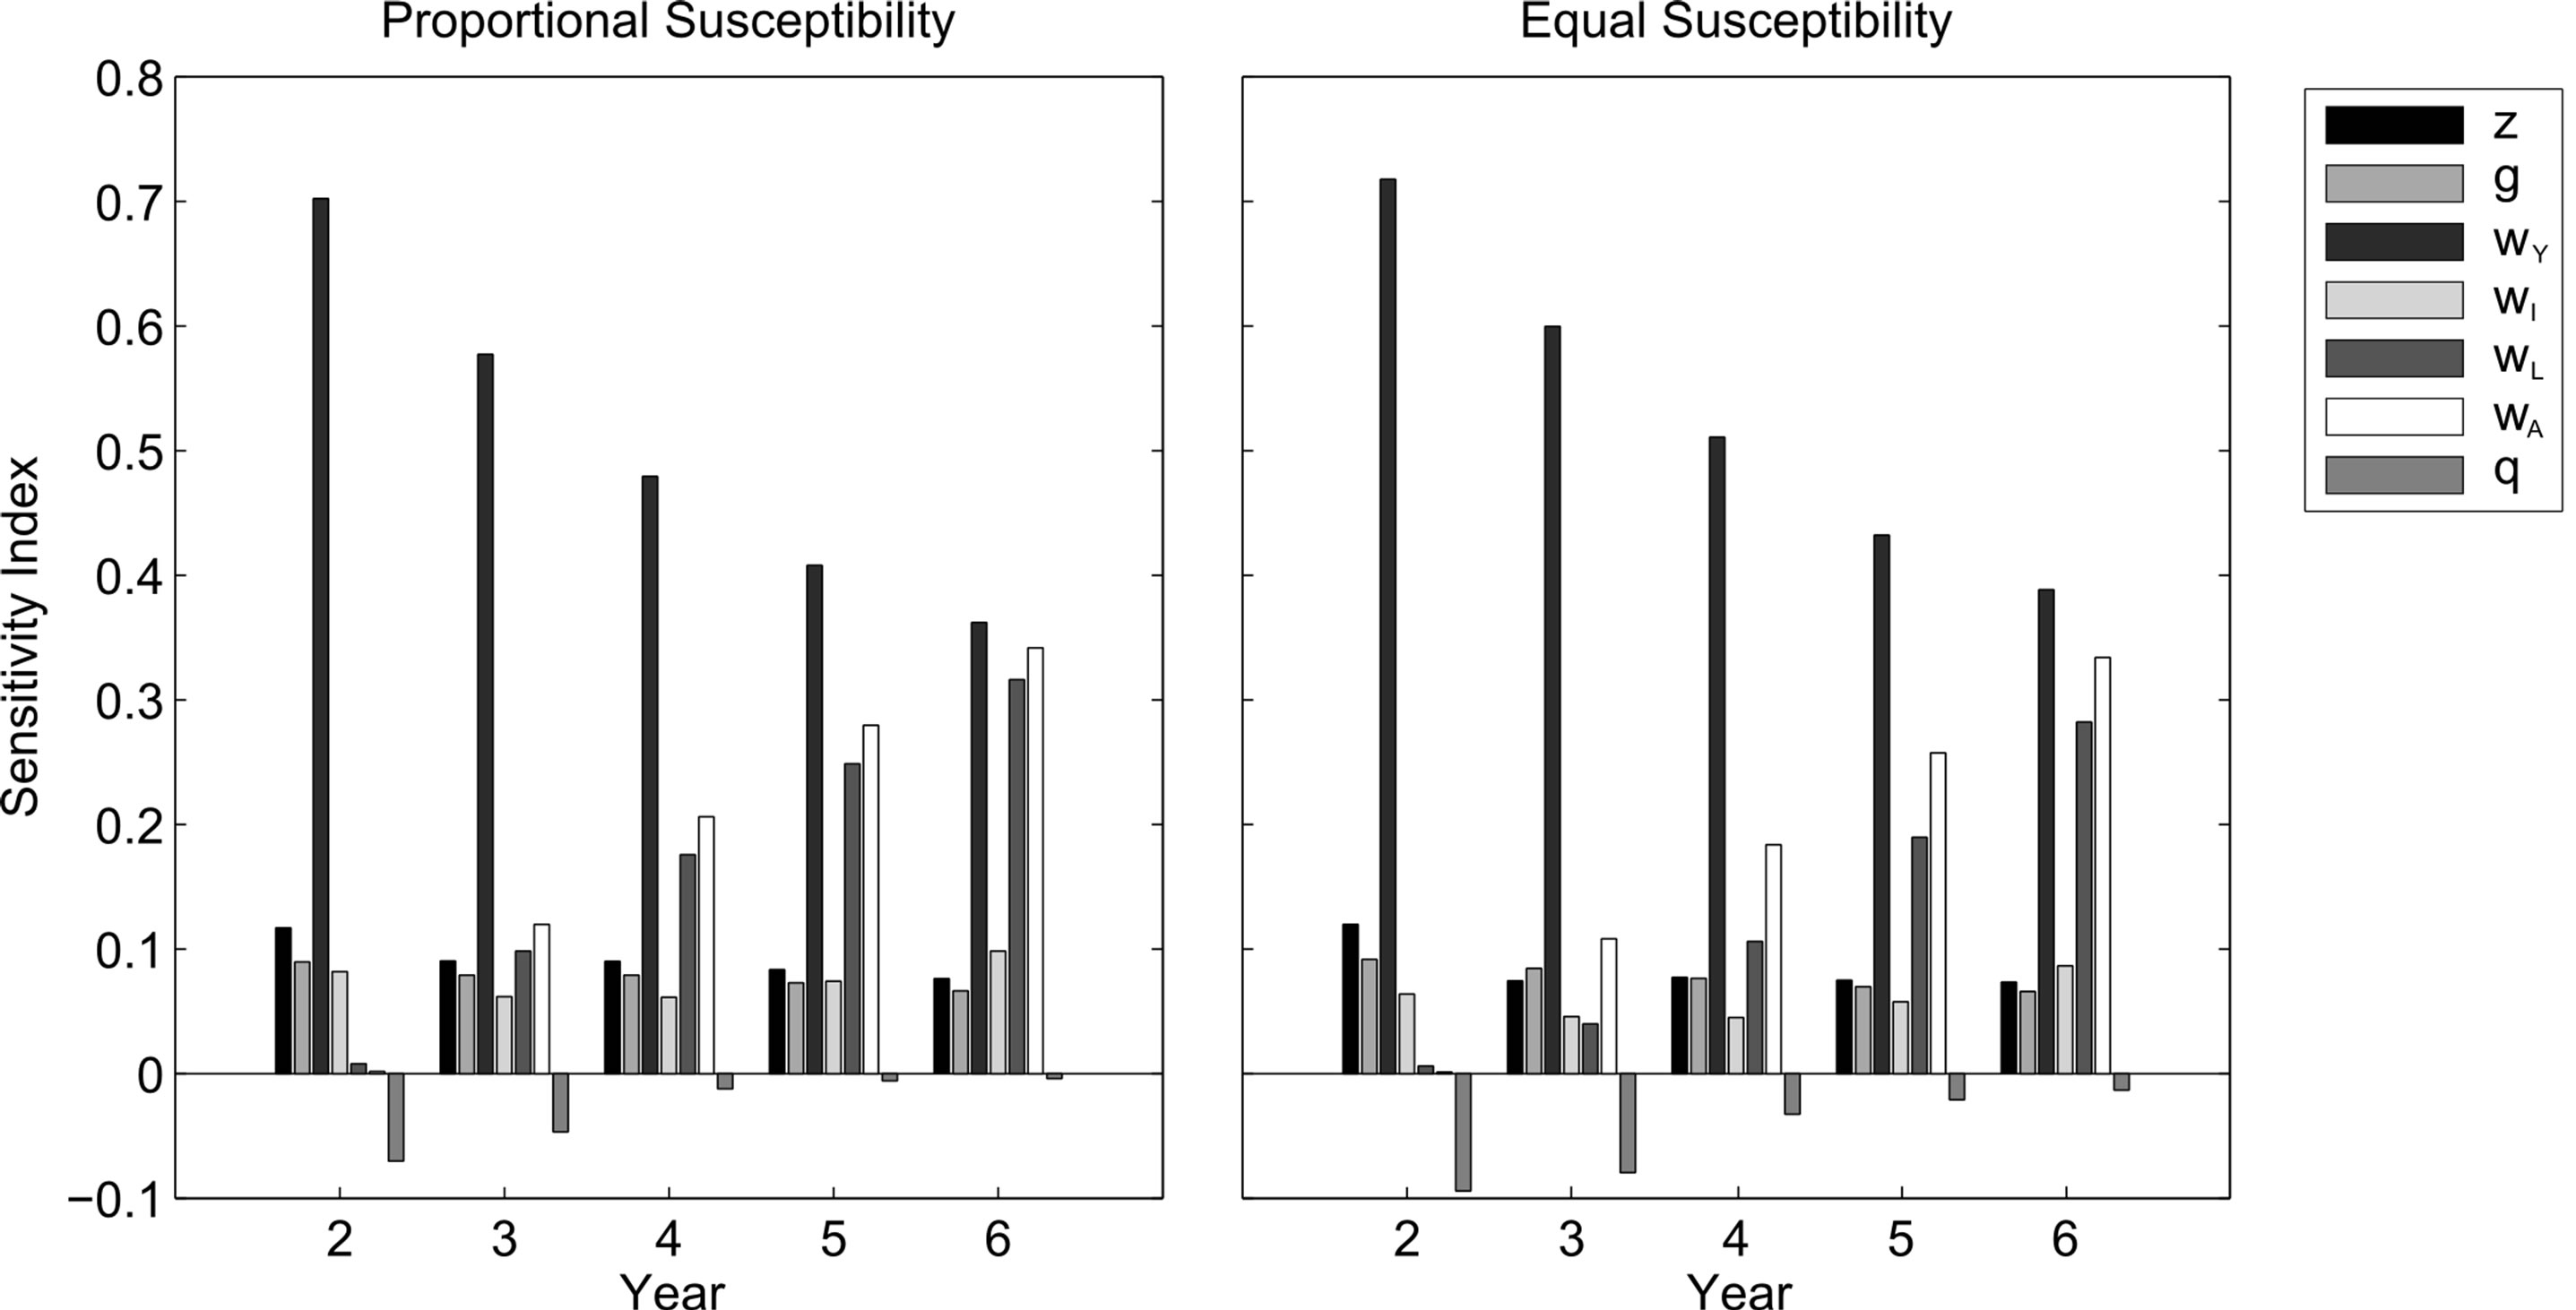
Figure 3. Transient sensitivity indices of the Gulf population after a Gulf oil spill with proportional (left) and equal (right) susceptibility to oil toxicity Θ = 50%. From left to right, bars indicate sensitivity indices of fecundity (ζ), survival rates (ω) for hatchlings, oceanic immatures, small neritic immatures, large neritic immatures, and adults respectively, and oil toxicity (θ).
this include relocating nests away from the spill, closing beaches to the public, using booms to confine the oil slick, and ensuring the removal of turtles from burn zones. In later years, efforts should focus on increasing large neritic immature and adult survival. Beyond enforcing TED use to reduce turtle bycatch, more research is needed to determine how large turtle mortality can be reduced.
5. ACKNOWLEDGEMENTS
This project has been supported by grants from the National Science Foundation (NSF-Grant DMPS-0838705), the National Security Agency (NSA-Grant H98230-09-1-0104), the Alfred P. Sloan Foundation; and the President and Provost Offices at Arizona State University (ASU). The Mathematical and Theoretical Biology Institute (MTBI) now hosted at the Mathematical, Computational and Modeling Science Center at ASU would like to give thanks to everyone involved with the program for the past 15 years.
Additionally, we would like to thank MTBI for their funding and support. We would also like to thank Dr. Baojun Song, Dr. Leon Arriola, Dr. Michael Johnson, Dr. Eric Baack, Benjamin Morin, and Kamal Barley for their assistance and advice with this project. Finally, we wish to thank Carlos Castillo-Chávez for giving us the opportunity to participate in MTBI.
REFERENCES
- Shigenaka, G. (2003) Oils and sea turtle: Biology, planning, and response. Seattle, Washington: Office of Response and Restoration, NOAA Ocean Service.
- Cooper, A. (2011) Year after gulf oil spill, group gives mixed report card for wildlife. CNN News.
- Boehm, P.D., Fiest, D.L., Mackay, D. and Paterson, S. (1982) Physical-chemical weathering of petroleum hydrocarbons from the IXTOC I blowout: chemical measurements and a weathering model. Environmental Science & Technology, 16, 498-505. doi:10.1021/es00102a014
- Riazi, M.R. and Roomi, Y.A. (2008) A model to predict rate of dissolution of toxic compounds into seawater from an oil spill. International Journal of Toxicology, 27, 379- 386. doi:10.1080/10915810802503578
- Crouse, D.T., Crowder, L.B. and Caswell, H. (1987) A stage-based population model for loggerhead sea turtles and implications for conservation. Ecology, 68, 1412- 1423. doi:10.2307/1939225
- Crowder, L.B., Crouse, D.T., Heppell, S.S. and Martin, T.H. (1994) Predicting the impact of turtle excluder devices on loggerhead sea turtle populations. Ecological Applications, 4, 437-445. doi:10.2307/1941948
- Heppell, S.S., Crowder, L.B., Crouse, D.T., Epperly, S.P., Frazer, N.B., Bolten, A.B., et al. (2003) Population models for Atlantic loggerheads: past, present, and future. In: Loggerhead Sea Turtles, Smithsonian Institution Press, Washington DC, 255-273.
- Frazer, N.B. (1983) Demography and life history evolution of the Atlantic loggerhead sea turtle, Caretta caretta (Dissertation). University of Georgia, Athens.
- Reed, M., French, D.P., Calambokidis, J. and Cubbage, J.C. (1989) Simulation modelling of the effects of oil spills on population dynamics of northern fur seals. Ecological Modelling, 49, 49-71. doi:10.1016/0304-3800(89)90043-4
- Bowen, B., Avise, J.C., Richardson, J.I., Meylan, A.B., Margaritoulis, D. and Hopkins-Murphy, S.R. (1993) Population structure of loggerhead turtles (Caretta caretta) in the northwestern Atlantic Ocean and Mediterranean Sea. Conservation Biology, 7, 834-844. doi:10.1046/j.1523-1739.1993.740834.x
- National Marine Fisheries Service and US Fish and Wildlife Service (2008) Recovery plan for the northwest Atlantic population of the loggerhead sea turtle (Caretta caretta). Second Revision. Silver Spring: National Marine Fisheries Service.
- Bowen, B.W., Bass, A.L., Chow, S.-M., Bostrom, M., Bjorndal, K.A., Bolten, A.B., et al. (2004) Natal homing in juvenile loggerhead turtles (Caretta caretta). Molecular Ecology, 13, 3797-3808. doi:10.1111/j.1365-294X.2004.02356.x
- Caswell, H. (2001) Matrix Population Models. 2nd edition, Sinauer Associates, Massachusetts.
- Lefkovitch, L.P. (1965) The study of population growth in organisms grouped by stages. Biometrics, 21, 1-18. doi:10.2307/2528348
- Monk, M.H., Berkson, J. and Rivalan, P. (2010) Estimating demographic parameters for loggerhead sea turtles using mark recapture data and a multistate model. Population Ecology, 53, 165-174. doi:10.1007/s10144-010-0205-x
- Turtle Expert Working Group (2009) An assessment of the loggerhead turtle population in the Western North Atlantic Ocean. NOAA Technical Memorandum NMFSSEFSC-575.
- Marine Turtle Specialist Group (1996) Caretta caretta. www.iucnredlist.org
- Koons, D.N., Grand, J.B., Zinner, B. and Rockwell, R.F. (2005) Transient population dynamics: Relations to life history and initial population state. Ecological Modelling, 185, 283-297. doi:10.1016/j.ecolmodel.2004.12.011