Open Journal of Molecular and Integrative Physiology
Vol.06 No.02(2016), Article ID:67212,15 pages
10.4236/ojmip.2016.62003
Insulin Age-Dependently Modulates Synaptic Transmission and AMPA Receptor Trafficking in Region CA1 of the Rat Hippocampus
Shayna A. Wrighten1, Gerardo G. Piroli2
1Department of Biology, Francis Marion University, Florence, SC, USA
2Department of Pharmacology, Physiology and Neuroscience, University of South Carolina School of Medicine, Columbia, SC, USA

Copyright © 2016 by authors and Scientific Research Publishing Inc.
This work is licensed under the Creative Commons Attribution International License (CC BY).
http://creativecommons.org/licenses/by/4.0/


Received 21 April 2016; accepted 27 May 2016; published 31 May 2016
ABSTRACT
Insulin induces long-term depression (insulin-LTD) in the CA1 region of the rat juvenile hippocampus. This insulin-LTD may be due in part to internalization of the GluA2 subunit of the AMPA receptor (AMPAR) events that haven’t been studied in the mature rat hippocampus. In our studies, we used hippocampal preparations from juvenile (14 - 25 days) and mature (60 - 90 days) rats to assess insulin modulation of CA1 synaptic transmission and AMPAR trafficking and phosphorylation. Using field potential electrophysiology, we observed that insulin induced LTD in the juvenile hippocampus (as previously reported) in the presence and absence of phosphoinositide 3-kinase (PI3K) activity, but produced no significant long-term changes in the mature hippocampus in the presence of PI3K activity. Interestingly, during PI3K inhibition, insulin did produce LTD in the mature hippocampus. Additionally, insulin induced a long-term decrease in plasma membrane expression of the GluA2 and GluA1 subunits of the AMPAR in the juvenile, but not mature hippocampus. Furthermore, there was a long-term decrease in GluA1 phosphorylation at Serine 845 in the juvenile, but not mature hippocampus. These data reveal that insulin modulation of synaptic plasticity and AMPAR modulation within the hippocampus is age-dependent, suggesting that insulin-regulated behaviors may also show age-dependence. These findings are important largely due to the increased use of insulin as a therapeutic throughout the lifespan. Our data suggest that additional work should be done to determine how this use of insulin throughout different stages of life might affect synaptic function and development.
Keywords:
Insulin, Synaptic Plasticity, Synaptic Transmission, Long-Term Depression (LTD)

1. Introduction
Insulin, and its analogues, is widely used to treat endocrine disorders such as diabetes mellitus. As the diabetes epidemic grows and begins to affect people of all ages at a higher rate than in previous years [1] , it is important to understand how use of insulin is affecting individuals across the lifespan both peripherally and centrally. Over time, the importance of insulin in hippocampal memory and learning processes has become better appreciated [2] - [5] . Although much is known about the behavioral effects of insulin on hippocampal-dependent tasks [6] [7] , the molecular effects of insulin in the hippocampus have been largely understudied. In juvenile animals, in vitro field potential recordings have revealed that insulin induces long-term depression (LTD) in various regions of the hippocampus [8] - [11] . Furthermore, the whole cell recording studies have revealed that in mature animals, insulin produces LTD in region CA1 of the hippocampus [12] . The trafficking of α-amino-3-hydroxy-methyl-4- isoxazolepropionic acid receptors (AMPARs) from the plasma membrane to internal compartments is a well- documented event that plays a pivotal role in many forms of stimulus-induced LTD. More specifically, internalization of the GluA2 and GluA1 subunits are believed to play a significant role in the early phases of LTD [13] . GluA2 internalization is also believed to be an underlying mechanism of insulin-LTD in juvenile animals [14] . Although it has been reported that insulin causes a decrease in the surface expression of the GluA2 subunit in hippocampal slices from juvenile rats [9] and in HEK293 cells [12] , insulin-induced effects on GluA2 trafficking have not been investigated in mature rats. Additionally, the interactions between the GluA1 subunit and insulin have not been reported in juvenile or mature rats. Therefore, we investigated the effects of insulin on trafficking of both GluA2 and GluA1 subunits. In addition to AMPAR subunit internalization, stimulus-LTD is associated with decreased phosphorylation of GluA1 at S845 (pGluA1S845) [14] . Although it has been shown that insulin induces phosphorylation of the GluA1 receptor at S830 [15] , the effects of insulin on pGluA1S845 remain unpublished.
In an effort to fully characterize the mechanisms underlying insulin-LTD, we also examined the role of phosphatidylinositol-3-kinase (PI3K) in insulin-LTD. In mice, it has been shown that proper PI3K activity is necessary for stimulus-induced LTD [7] [16] . For example, Kim and colleagues found that stimulus-induced LTD could not be induced in knockout mice lacking the PI3Kγ subunit [16] . Interestingly, Choi et al. showed that in mice with an overexpression of PI3Kγ stimulus-induced LTD was greatly impaired, suggesting a very delicate balance of PI3K activity for the expression of stimulus-LTD. A role for PI3K signaling has also been suggested in insulin-LTD in juvenile rat brain slices [9] . Yet, no studies have examined the role of PI3K in insulin-induced plasticity in the mature hippocampus.
The many synaptic changes that occur between birth and maturation of the brain make it important to assess the effects of insulin throughout the lifespan. Particularly sensitive to synaptic developmental changes is the glutamatergic system. For example, there is an increase in the presence of hippocampal AMPARs [17] - [19] and a change in AMPAR and NMDAR subunit expression with age [19] . More specifically, the flip variant of AMPAR subunits is dominant during development while the flop variant is largely present in the adult brain [18] . There is also an increase in the presence of the GluR2 subunit found in AMPARs during development [18] [19] , and an increased proportion of the NR2A to NR2B subunits in NMDARs of the mature brain [18] [19] . In the hippocampus of the rat it has been shown that synapse-associated protein 102 (SAP-102) decreases with age, with the highest level occurring at post-natal day 2 [20] , and it has been shown that post-synaptic density (PSD)- 93 and PSD-95 increase with development [20] . A higher expression of NR2B at synapses in the developing brain [18] coincides with the high level of SAP-102, and a higher expression of NR2A in the mature brain [18] corresponds with the higher level of the post-synaptic density proteins [20] . These results suggest a developmental change not only in NMDA receptor subunit composition, but also in the co-localization of these subunits with particular membrane-associated proteins [20] . Furthermore, Ye and colleagues showed changes in NMDA receptor kinetics in the developing rat hippocampus [21] . Considering the great importance of the glutamatergic system in synaptic transmission, it is plausible that these types of changes result in differential regulation of synaptic transmission by insulin across development.
The present series of studies provide insight into the underlying mechanisms of insulin on hippocampal function. Knowledge of the age-dependent effects of insulin on synaptic plasticity may transform our view of insulin’s role in learning and memory modulation as well as potential effects of therapeutic insulin on the brain at various stages of life. The increasing use of insulin as a therapeutic across the lifespan propels the need to better understand how insulin affects synaptic transmission at all life stages. For these studies, we hypothesize that hippocampal insulin signaling is age-dependent and that insulin modulates the AMPAR subunits GluA1 and GluA2 in the hippocampus in a manner similar to stimulus-induced LTD.
2. Methods
2.1. Ethical Approval
The University of South Carolina Animal Use and Care Committee approved all experiments and procedures. All procedures were carried out utilizing the most appropriate ethical standards, which were understood by the investigators.
2.2. Animals
The animals used in this study were male Sprague Dawley rats (Charles River, Wilmington, MA). Juvenile animals were 14 - 25 days old and mature animals were 60 - 90 days old. Adult animals were housed 2 - 3 animals per cage, and juvenile animals were housed together with their mom until time of weaning at age 21days. All animals were allowed ad libitum access to food (standard Purina rat chow) and water. Animals were kept in a temperature-controlled environment (22˚C ± 2˚C) on a light dark schedule (lights on at 0700h).
2.3. Hippocampal Slice Preparation
Animals were anesthetized using isoflurane. Once anesthetized, animals were killed via decapitation using a guillotine. Following decapitation, the brain was quickly removed and placed in cold cutting artificial cerebral spinal fluid (cutting aCSF in mM: 125NaCl, 2.7KCl, 1.25NaH2PO4, 10glucose, 7MgSO4, 0.5CaCl2, bubbled with 95%O2/5%CO2). Following a brief incubation in cutting aCSF, transverse 500 µm hippocampal slices were cut in ice-cold cutting aCSF using a vibratome. Following cutting, hippocampal slices were incubated submerged in aCSF (cutting aCSF+ 20 µM D-APV) at room temperature for at least one hour prior to the start of experiments. Due to differences in slice longevity between mature and juvenile animals, some studies contain slightly more juvenile animal slices than that of adults.
2.4. In vitro Insulin Stimulation
In vitro insulin stimulation was performed on hippocampal slices prepared as described above. Following the one hour incubation in cutting aCSF, slices were placed in a submersion-style electrophysiology chamber and constantly perfused with warmed (32˚C ± 2˚C) fresh recording aCSF (2 mL/min, in mM: 125NaCl, 2.7KCl, 1.25NaH2PO4, 10glucose, 1MgSO4, 2.5CaCl2, bubbled with 95%O2/5%CO2). Control (CON) slices were incubated in the submersion-style chamber for 15 minutes and then collected for analysis. All experimental slices were incubated in the chamber with aCSF for 15 minutes followed by aCSF with insulin (500nM) for 15 minutes. Following the end of insulin application, slices were collected for analysis (0) or left in the chamber while insulin was washed off with aCSF for 5, 15 or 40 minutes prior to collection (groups: 5,15,40 respectively). To inhibit insulin activity some slices {LY} were incubated for 15 minutes in aCSF, 10 minutes in aCSF with LY294002 (LY, 50 µM), 15 minutes in aCSF with LY + insulin and 15 minutes of LY + insulin washout. Following the termination of each treatment, slices were collected and homogenized in homogenization buffer (in mM: 320Sucrose, 2EGTA, 2EDTA, 10HEPES, 1% protease inhibitor cocktail, 1%phosphatase inhibitor cocktail) using a hand held pestle. Samples were centrifuged at 500×g for 10 minutes at 4οC. Following the first spin, the supernatant was removed, and the pellet was washed in homogenization buffer and re-centrifuged for 10 minutes at 300×g at 4˚C. The supernatant was removed and added to that collected from the first spin. These fractions were used to measure total membrane (TM) expression of proteins using western blot analysis. For analysis of plasma membrane (PM) fractions, TM was centrifuged at 20,000×g for 30 minutes at 4˚C ± 4˚C; the pellet from this spin was resuspended in 0.5 M of phosphate buffered-saline (PBS) and collected. This protocol provides crude preparations of plasma membrane fractions as described previously by Grillo and colleagues [22] . Protein determinations were carried out in all fractions according to the method of Bradford [23] using BSA as the standard. While not in use, all samples were stored at −70˚C. For each condition, one totwoslices were used per animal, and each animal was subjected to each condition. For example, from one animal one to two slices were used for control, one to two for 0, one to two for 5, etc. Slices were picked for each group using a variable design. More specifically, from animal 1, slices were used in order of treatment {CON, 0, 5.15, 40}, from animal 2 slices were treated in a different order {0, 5, 15, 40, CON} and so on. This design was used to eliminate effects of tissue age post-cutting on any particular treatment group. At least three animals were used for each condition.
2.5. Western Blot Analysis
Western blot analysis was performed as described in previous studies from the lab [24] . Briefly, TM or PM fractions were separated by SDS/PAGE, transferred to nitrocellulose (NC) membranes and blocked for 1 hour at room temperature in tris-buffered saline (TBS) plus 10% non-fat dry milk. NC membranes were then incubated with primary antisera in TBS/5% non-fat dry milk. After one overnight incubation at 4˚C, blots were washed with TBS plus 0.05% Tween 20 (TBST) and incubated with peroxidase-labeled species-specific secondary antibodies for 1 hour at room temperature. NC membranes were then washed with TBST and developed using enhanced chemiluminescence reagents (GE Healthcare, Pittsburgh, PA) as described by the manufacturer. After the initial probing, NC membranes were stripped as previously described [25] and later probed with an antibody for actin (or total Akt for blots probed with pAkt antibodies), for normalization purposes. Computer assisted microdensitometry of autoradiographic images was determined using the MCID image analysis system (Imaging Research, INC., St. Catherines, Canada), as previously described [22] . Grey level/optical density calibrations were performed using a calibrated filmstrip ladder (Imaging Research, INC.).
2.6. Field Excitatory Post-Synaptic Potential Recordings
Field potential recordings were conducted in a submersion-style recording chamber. There was a constant flow of fresh recording aCSF (recording aCSF: 125NaCl, 2.7KCl, 1.25 NaH2PO4, 10 glucose, 1MgSO4, 2.5CaCl2, bubbled with 95%O2/5%CO2, 291 mOsm) throughout the chamber at a rate of 2 mL/minute. The recording aCSF was heated to a temperature of 32˚C ± 2˚C. Once in the chamber, slices were held in place using mini titanium weights. Slices were stimulated at the Schaffer collaterals by a monopolar platinum-iridium stimulating electrode referenced to a ground pellet. Stimuli were 0.1 millisecond, and delivered via a Grass stimulating unit and stimulator isolation unit (Grass Medical Instruments, Quincy MA) recorded through a glass-recording electrode filled with recording aCSF (resistance: 2 - 3 MΩ) placed in region CA1. Responses were recorded using an npi amplifier filtered at 1 kHz. A test stimulus set to evoke approximately 50% of the maximal response was delivered once every 30 seconds. Stimuli were delivered in pairs 10 milliseconds apart. Recordings were carried out using the pClamp 10.0 software as previously described [26] .
2.7. Drugs and Antibodies
Insulin was purchased from Sigma-Aldrich (#I0516, St. Louis, MO) and LY294002 (LY) was purchased from Cell Signaling Technology (Danvers, MA). Insulin (500nM) was dissolved directly into aCSF. LY (50 µM) was first dissolved into DMSO and then dissolved into aCSF. For Western blot analysis, primary antibodies against pAkt, total Akt, and Pp44/42 were obtained from Cell Signaling Technology (Danvers, MA) and antibodies against GluA1, pGluA1S845, and GluA2 were obtained from Millipore Corporation (Billerica, MA). Actin was obtained from Sigma-Aldrich (St. Louis, MO).
2.8. Statistical Analysis
For analysis of electrophysiology data, the rising slope (30% - 90%) of the fEPSP was measured. The data were then normalized to baseline (100%) and animals were averaged together for a representative sample (ie. N=number of animals, opposed to number of slices. Only one slice was used per animal for analysis, or if multiple slices were used from one animal the average of those slices were taken and used in the analysis. To examine differences within a group compared to control, repeated measures ANOVA and post-hoc test were performed on the percent change from baseline. Comparisons were made between baseline (the first 15 minutes of the experiment) and 5 minute increments following baseline, which resulted in 8 time points compared to baseline. Comparisons between groups were made using a repeated measures 2-way ANOVA and post-hoc test. Baseline recordings for LY experiments did not begin until a stable baseline reading was obtained for at least 10 minutes.
Western blots were analyzed using repeated measures ANOVA and post-hoc test. Data are presented as mean ± standard error mean. For comparisons between age groups a repeated measures 2-way ANOVA and post-hoc test were performed. At time points 0 and 40 a planned t-test was performed for all western blot analysis data; these points correlate to the beginning and end of insulin application respectively. LY data were analyzed using a t-test due to a limited sample size, and comparisons were made to time point 15 (this comparison made the washout time of insulin and insulin/LY the same between the groups). Multiple western blot analyses were performed on tissue collected from three experiments conducted the same way (N = number of western blot analysis, not number of animals used in western blot analysis). Tissue was culled from at least three animals for each western blot (as described for the in vitro stimulation procedure). For all tests significance was set at p ≤ 0.05, and all statistical tests were performed in GraphPad PRISM.
3. Results
3.1. Insulin Age-Dependently Modulates Synaptic Plasticity in Region CA1 of the Juvenile and Mature Hippocampus
In agreement with the literature [9] [11] , 500 nM insulin application resulted in LTD of fEPSPs in juvenile animals (p < 0.05, Figure 1(a), Figure 1(c) and Figure 1(e)). In juvenile animals, fEPSP rising slope was significantly different from baseline at analysis points 2-8 (−17.41 ± 3.47, −14.24 ± 3.03, −15.32 ± 4.33, −16.73 ± 5.47, −15.58 ± 3.70, −17.90 ± 3.31, −18.96 ± 5.92). In mature animals, insulin caused a decrease in fEPSP of hippocampal slices (p < 0.05, Figure 1(b), Figure 1(d) and Figure 1(e)). However, unlike in juvenile animals, the insulin-induced depression was not long lasting. In mature animals, there was a significant difference from baseline at analysis point 2 only (−15.55 ± 4.21). The effects of insulin during the first 20 minutes of application (1 - 4), were the same in juvenile and mature animals; however, the effects of insulin during the remainder of the
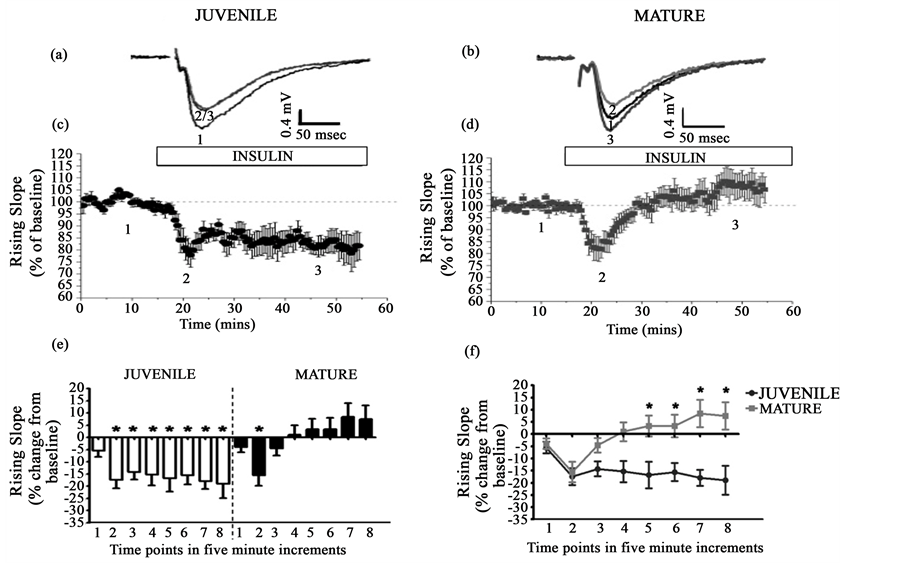
Figure 1. Insulin age-dependently modulated synaptic transmission in juvenile and mature animals in region CA1 of the hippocampus. In region CA1, 40 minute application of 500 nM insulin produced lasting depression in juvenile animals ((a), (c), (e), (f), N = 10) and transient depression in mature animals ((b), (d), (e), (f), N = 9). The effects of insulin on synaptic transmission were age-dependent ((e), (f)). Panels (a) and (b) are representative fEPSP waveforms (indicated by the numbers in (c) and (d)). Panels (c) and (d) show percent of baseline for the respective groups. Panels E and F show the percent change from baseline in 5 minute increments. All figures are shown as mean ± SE. *= significantly different from the corresponding time point within each group (e) or significant time X group interaction (f), p ≤ 0.05.
insulin application showed a time X group interaction (5 - 8, p < 0.05, Figure 1(e)). To ensure that the response to insulin was the same using a 15 minute application as a 40 minute insulin application, we examined the effects of 15 minute of 500 nM insulin on fEPSPs. This paradigm mimicked the time course used for in vitro insulin stimulation. In juvenile animals, insulin induced lasting depression (p < 0.05, data not shown), and in mature animals insulin produced transient depression (p < 0.05, data not shown) producing results similar to that of 40-minute insulin application.
3.2. Insulin-Induced LTD Does Not Require Activation of PI3K in Region CA of the Juvenile or Adult Hippocampus
We next examined the effects of a PI3K inhibitor, LY, on insulin-LTD. In the presence of LY, insulin-induced depression in region CA1 of juvenile animals was not different from insulin applied in the absence of LY (p = 0.2126, Figure 2(a), Figure 2(c) and Figure 2(e)). In mature animals, LY transformed transient depression into lasting depression (p < 0.05, Figure 2(b), Figure 2(d) and Figure 2(f)). The effects of LY on insulin-induced depression were not age-dependent (p = 0.9242, Figure 2(g)).

Figure 2. LY does not inhibit insulin-LTD in juvenile or mature animals. In region CA1, LY did not inhibit insulin-induced synaptic plasticity in juvenile ((a), (c)) or mature ((b), (d)) animals. In the presence of LY, transient depression was converted into lasting depression in mature animals ((b), (d), (f)). In juvenile animals, there was no statistically significant difference between insulin-induced depression in the presence or absence of LY (e). The effects of LY were not age-dependent (g). Panels (a) and (b) are representative fEPSP waveforms (indicated by the numbers in (c) and (d)). Panels (c) and (d) show percent of baseline change for the respective groups. Panels E and F show comparisons between control slices and LY treated slices for juvenile (left, N = 6) and mature (right, N = 6) animals. Panel G shows the comparison of fEPSP rising slope for juvenile (black circles, N = 6) and mature (gray squares, N = 6) animals. All figures are shown as mean ± SE, p ≤ 0.05. Data ((e), (f), (g)) are expressed in 5 minute increments beginning with insulin application (1). In panels (e) and (f), *= significantly different from respective baseline. In panel (g), *= significantly different from the opposite group at the comparable time point.
3.3. Hippocampal Insulin-Induced Phosphorylation of Akt Is Longer Lasting in Mature Compared to Juvenile Animals
We next examined insulin signaling in hippocampal slices from juvenile and mature rats. To indirectly measure insulin-induced PI3K activity, we measured pAkt using an in vitro stimulation process. We found that insulin stimulated an increase in pAkt in both juvenile (p < 0.05) and mature (p < 0.05) hippocampal slices (Figure 3(a) and Figure 3(b)). However, in hippocampal slices from juvenile animals, insulin-induced pAkt was increased only immediately following insulin application {0} (76.46 ± 18.61) and 15 minutes post insulin application {15} (80.81 ± 28.72). Conversely, in the mature hippocampus, insulin caused an increase in pAkt at all tested time points lasting for at least 40 minutes post insulin washout {0, 5, 15, 20} (69.62 ± 20.30, 83.80 ± 15.41, 81.90 ± 27.63, 67.46 ± 20.64). There was no significant interaction between the groups at any tested time point for pAkt as determined by a repeated measures 2-way ANOVA (p = 0.1008). However, the planned t-test revealed that the effects of insulin on pAkt were age-dependent. Specifically, there was a significant difference between pAkt levels in juvenile and mature animals at 40 minutes post insulin {40} (p < 0.05, Figure 3(c)). In both juvenile and mature animals, insulin stimulated pAkt was PI3K-dependent as is evident by the ability of the PI3K inhibitor, LY294002 {LY}, to block the effects of insulin on pAkt (p < 0.05, Figure 3(a) and Figure 3(b)). All groups, except CON, received 15 minutes of insulin application. The group number/title refers to the insulin washout time in minutes.
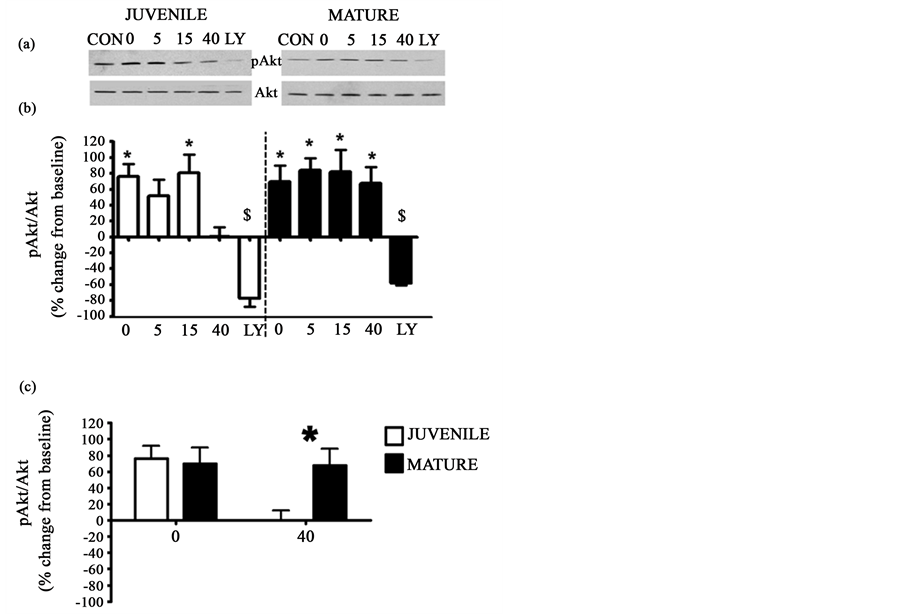
Figure 3. Hippocampal insulin-induced pAkt was age-dependent. In juvenile and mature hippocampal slices insulin induced an increase in pAkt ((a), (b)). In both juvenile and mature animals insulin-induced pAkt was PI3K dependent, as is evident by the ability of LY to block the effects of insulin ((a), (b)). Additionally, the effects of insulin were age-dependent showing a difference between juvenile and mature at the 40 minute time point (c). Panel (a) shows representative western blots of pAkt (top) and Akt (bottom) for juvenile (left, N = 6, LY = 2) and mature (right, N = 5, LY = 3) slices. Panel (b) shows graphical representation of the data expressed as mean ± SE percent change from baseline (*= significantly different from baseline, $ = significantly different from 15). Panel (c) compares the age-dependent differences between juvenile and mature animals at time 40 (*= significantly different from the comparable time point of the opposite group), p ≤ 0.05. Groups (all groups except CON were bathed in 15 minutes of insulin): CON = no insulin treatment, 0 = no insulin washout, 5 = 5 minutes of insulin washout, 15 = 15 minutes of insulin washout, 40 = 40 minutes of insulin washout, LY = pre-treatment with LY and 15 minutes insulin/LY washout. CON treated slices were used as the baseline measure in these analyses.
3.4. Insulin Has Differential Effects on Pp44/42 in the Juvenile and Mature Rat Hippocampus
The next measure of insulin signaling that we evaluated was p44/42, which is a mitogen-activated protein kinase (MAPK) that has been implicated in synaptic plasticity [27] - [29] . In the hippocampal slices from juvenile animals, there was a significant decrease in phosphorylation of p44 (Pp44) at the 40 minute time point {40} (p < 0.05, M = −43.19 ± 7.39 Figure 4(a) and Figure 4(b)). Conversely, in hippocampal slices from mature animals, there was no significant insulin-induced change in Pp44 (p = 0.0809, Figure 4(a) and Figure 4(b)). There was no interaction between insulin-induced Pp44 at any tested time point (p = 0.9993, Figure 4(c)). Furthermore, in mature animals only, Pp42 significantly decreased 15 minutes [15] (p < 0.05, −65.28 ± 4.69) and 40 minutes {40} (−57.67 ± 8.85) following insulin washout (Figure 4(d) and Figure 4(e)). On the contrary, there were no insulin-induced Pp42 changes in juvenile animals (p = 0.6129, Figure 4(d) and Figure 4(e)). Decreased Pp42 in mature animals was not blocked by LY {LY} (p = 0.3139, Figure 4(d) and Figure 4(e)). There was no time X group interaction of insulin on Pp44/42 (p = 0.6155, Figure 4(f)). All groups, except CON, received 15 minutes of insulin application. The group number/title refers to the insulin washout time in minutes.
3.5. Insulin Age-Dependently Decreases Plasma Membrane Levels of the GluA2 Subunit
We next compared insulin-induced GluA2 trafficking in juvenile and mature hippocampal slices over time. We observed a decrease in the levels of PM (plasma membrane). GluA2 in juvenile hippocampal preparations (p < 0.05); the insulin-induced GluA2 decrease lasted for at least 40 minutes after insulin washout in juvenile preparations (−43.35 ± 12.29, −38.09 ± 9.32, −29.23 ± 13.95, −42.08 ± 8.99, Figure 5(a) and Figure 5(b)). Conversely, in hippocampal slices from mature animals, there were no overall changes in the PM expression of

Figure 4. Insulin induced a decrease in Pp44 in juvenileanimalsand a decrease in Pp42 in matureanimals. In juvenile hippocampal slices there was an insulin-induced decrease in Pp44 at the 40 minute time point ((a), (b)). There was no change in mature slices ((a), (b)). Conversely, in mature hippocampal slices there was an insulin-induced decrease in Pp42 beginning at 15 min following insulin ((d), (e)). There was no change in juvenile slices ((d), (e)). The effects were not age-dependent for Pp44/42 ((c) and (f)). Panels (a) and (d) show representative western blots of Pp44 (top) and loading control (bottom) for juvenile (left, N = 6) and mature (right, N = 4) as well as Pp42 (top) and loading control (bottom) for juvenile (left, N = 5) and mature (right, N = 3). Panels (b) and (e) show graphical representation of the data expressed as mean ± SE percent change from baseline (*= significantly different from baseline). Panels C and F compare the age-dependent differences between juvenile and mature animals. Groups (all groups except CON were bathed in 15 minutes of insulin): CON = no insulin treatment, 0 = no insulin washout, 5 = 5 minutes of insulin washout, 15 = 15 minutes of insulin washout, 40 = 40 minutes of insulin washout, LY=pre-treatment with LY and 15 minutes insulin/LY washout. CON treated slices were used as the baseline measure in these analyses.
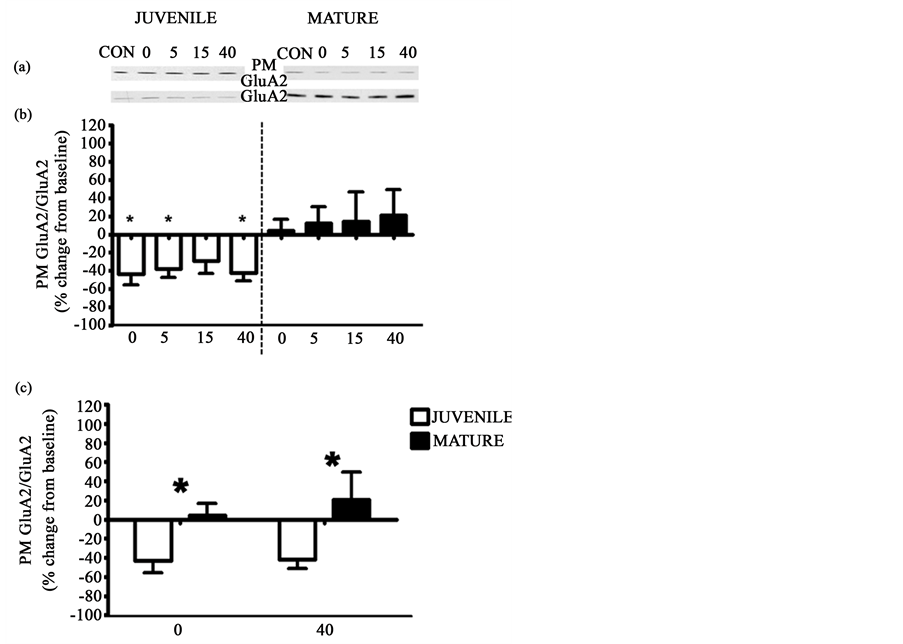
Figure 5. Hippocampal insulin-induced decrease in the PM GluA2 subunit was age-dependent. In juvenile hippocampal slices insulin induced a decrease in PM expression of the GluA2 subunit ((a), (b)). There was no insulin-induced change in PM GluA2 expression in mature hippocampal slices ((a), (b)). Additionally, there was a significant age-dependent difference at the 0 and 40 minute time points (c). Panel (a) shows representative western blots of PM GluA2 (top) and total levels of GluA2 (bottom) for juvenile (left, N = 5) and mature (right, N = 6) slices. Panel (b) shows graphical representation of the data expressed as mean ± SE percent change from baseline (*= significantly different from baseline). Panel (c) compares the age-dependent differences (*= significantly different from the comparable time point of the opposite group), p ≤ 0.05. Groups (all groups except CON were bathed in 15 minutes of insulin): CON = no insulin treatment, 0 = no insulin washout, 5 = 5 minutes of insulin washout, 15 = 15 minutes of insulin washout, 40 = 40 minutes of insulin washout. CON treated slices were used as the baseline measure in these analyses.
GluA2 following insulin administration (p = 0.9143, Figure 5(a) and Figure 5(b)). Additionally, there was no time X group interaction between juvenile and mature animals (p = 0.2311); however, at the 0 and 40 minute time point there was a significant difference between juvenile and mature animals as revealed by a planned t-test (p< 0.05, p< 0.05 Figure 5(c)). All groups, except CON, received 15 minutes of insulin application. The group number/title refers to the insulin washout time in minutes.
3.6. Insulin Age-Dependently Decreases Plasma Membrane Levels of the GluA1 Subunit
We next examined the effects of insulin on the PM expression of the GluA1 subunit. In juvenile animals there was a decrease in PM GluA1 expression (p < 0.05, Figure 6(a) and Figure 6(b)). More specifically, PM GluA1 expression decreased immediately following insulin stimulation {0} and lasted for at least 40 minutes post insulin {40} (−46.79 ± 17.58, −46.78 ± 15.63, −66.84 ± 7.81, −46.00 ± 10.21). In hippocampal slices from mature rats, there was a transient decrease of the PM expression of GluA1 occurring at time points 0 and 5 (p < 0.05 Figure 6(a) and Figure 6(b)). There was a time X group interaction 15 minutes following insulin (p < 0.05, Figure 6(c)). All groups, except CON, received 15 minutes of insulin application. The group number/title refers to the insulin washout time in minutes.

Figure 6. Insulin induced an age-dependent decrease in PM GluA1 expression in hippocampal slices. In juvenile and mature hippocampal slices insulin induced a decrease in PM expression of the GluA1 subunit ((a), (b)). In juvenile animals insulin-induced PM GluA1 decrease lasted for at least 40 minutes post insulin. Conversely, in mature hippocampal slices the insulin-induced decrease in PM GluA1 was transient. There was a significant interaction between juvenile and mature animals at 15 minutes following insulin application (c). Panel (a) shows representative western blots of PM GluA1 (top) and total levels of GluA1 (bottom) for juvenile (left, N = 6) and mature (right, N = 4). Panel (b) shows graphical representation of the data expressed as mean ± SE percent change from baseline (*= significantly different from baseline). Panel C compares the age-dependent differences (*= significantly different from the comparable time point of the opposite group), p ≤ 0.05. Groups (all groups except CON were bathed in 15 minutes of insulin): CON = no insulin treatment, 0 = no insulin washout, 5 = 5 minutes of insulin washout, 15 = 15 minutes of insulin washout, 40 = 40 minutes of insulin washout. CON treated slices were used as the baseline measure in these analyses.
3.7. Insulin Age-Dependently Causes a Decrease in the Phosphorylation of GluA1S845
It has been shown previously that pGluA1S845 is decreased following stimulus-induced LTD [14] . Accordingly, we examined hippocampal pGluA1S845 expression following insulin stimulation in juvenile and mature rats. Insulin administration caused a decrease in pGluA1S845 in juvenile hippocampal slices; this decrease was evident immediately following insulin stimulation {0} and lasted for at least 40 minutes following insulin washout {40} (p < 0.05, −35.40 ± 12.80, −39.85 ± 10.58, −74.45 ± 1.02, −69.71 ± 3.03, Figure 7(a) and Figure 7(b)). In hippocampal slices from mature rats, there was a decrease in pGluA1S845 levels immediately following insulin application {0} (p < 0.05, Figure 7(a) and Figure 7(b)), which returned to baseline by 40 minutes after insulin washout {40}. There was a time X group interaction of insulin on pGluA1S845 levels at the 15 and 40 minute time points (p < 0.05, Figure 7(c)). All groups, except CON, received 15 minutes of insulin application. The group number/title refers to the insulin washout time in minutes.
4. Discussion
This study is the first to compare the effects of insulin on juvenile and mature hippocampal synaptic transmission using field potential electrophysiology. The data collected in these studies reveal crucial mechanistic information regarding insulin-induced synaptic plasticity. Our data show that hippocampal insulin-induced synap-

Figure 7. Insulin induced an age-dependent decrease in pGluA1S845. In juvenile and mature hippocampal slices insulin induced a decrease in the expression of pGluA1S845 ((a), (b)). There was a significant interaction between juvenile and mature animals at 15 and 40 minutes following insulin application (c). Panel A shows representative western blots of pGluA1S845 (top) and total levels of GluA1 (bottom) for juvenile (left, N = 6) and mature (right, N = 5). Panel (b) shows graphical representation of the data expressed as mean ± SE percent change from baseline (*= significantly different from baseline). Panel (c) compares the age-dependent differences (*= significantly different from the comparable time point of the opposite group), p ≤ 0.05. Groups (all groups except CON were bathed in 15 minutes of insulin): CON = no insulin treatment, 0 = no insulin washout, 5 = 5 minutes of insulin washout, 15 = 15 minutes of insulin washout, 40 = 40 minutes of insulin washout. CON treated slices were used as the baseline measure in these analyses.
tic plasticity and insulin receptor signaling have age-dependent components. Particular mechanisms underlying these findings may parallel the mechanistic age-dependence of stimulus-LTD [19] [30] , which may, at least in part, be due to developmental changes in the glutamatergic system [19] .
Contrary to previous studies [12] , we failed to find lasting insulin-LTD in the CA1 region of adult rats. Technical differences between the work of Man and colleagues and our studies may provide some explanation for this discrepancy. For example, in the study by Man et al., insulin was applied for ten minutes only compared to forty minutes in our studies [12] . Additionally, bicuculline, a GABAA receptor antagonist, was applied throughout the experiment; however, in the present set of studies there was no use of GABA receptor inhibitors. The exclusion of bicuculline allowed us to examine the interplay between insulin and both the glutamatergic and GABAergic systems. Examining these relationships is important, as insulin has been shown to interact with many systems, including the GABAergic system. More specifically, in the rat cerebellum, insulin causes a GABA-dependent depression of synaptic transmission [31] . Additionally, in HEK293 and neuronal cells, insulin recruits GABAA receptors to the cell surface [32] . Additional study differences include the technique used; the whole cell recording was used in the study by Man et al., and field potential recordings were used in the current study [12] . It is possible that this difference in technique could account for the discrepancy in our findings and those of Man and colleagues. Moreover, based on the reported weights of the rats used in the study by Man et al. it is likely that the animals used in that study were younger than the age range of mature rats used in our studies [12] . Based on unpublished data, in a small sample size from our lab some animals, especially those of a more advanced age, show synaptic potentiation in response to insulin application. Since our group of animals appears to have been older, we may have observed a more heterogeneous insulin response than Man, resulting in different results.
In juvenile and mature animals, insulin-LTD occurred in the presence of LY suggesting that the insulin signaling driving force for insulin-LTD occurs via signaling molecules independent of, upstream of, or inversely related to activity of PI3K. Other researchers [2] [8] - [10] have found that the effects of insulin-LTD in juvenile hippocampi require the PI3K pathway. However, in the article by van der Heide and colleagues as well as Huang and others (2004) the PI3K inhibitor LY294002 seemed to not completely block insulin-LTD throughout the entire experiment. Our experimental design varies a bit from both of these previously published works. For instance, van der Heide and colleagues performed their electrophysiological recordings in the presence of bicuculline, which we did not. Furthermore, Huang and others (2004) applied insulin for only ten minutes in their studies opposed to forty minutes as was done in the study by van der Heide and colleagues [2] and our work.
Neither of these groups looked at the effects of insulin on synaptic transmission in the adult hippocampus. Interestingly, in mature animals, insulin applied in the presence of LY resulted in the transformation of insulin- induced transient depression into long-term depression. Several speculations may be made about LY’s effects on insulin-induced synaptic plasticity. One possibility is that PI3K activity underlies processes that oppose depression. Therefore, when PI3K activity is inhibited, insulin-LTD occurs with little to no opposition, thus allowing for a depression greater than that that occurs when PI3K is active. In juvenile animals, LY had no significant effect on the lasting effects of insulin, but showed a pattern of LTD enhancement at some points, which would support the aforementioned speculation. Intriguingly, in juvenile animals, insulin-LTD in the presence of LY was the greatest at a time point similar to maximal insulin-induced pAkt response. These correlations may suggest that PI3K also opposes depression in juvenile animals in delicate ways. These findings suggest that PI3K activation had similar effects in mature and juvenile animals. However, because of differences in insulin-in- duced PI3K activity between juvenile and mature animals, the effects of LY on insulin-LTD are more pronounced in the hippocampus of mature animals.
An alternate interpretation of the LY data is that there are both LY-dependent and -independent processes involved in insulin-induced depression. More specifically, it is plausible that in the presence of insulin, PI3K-in- dependent processes initiate insulin-induced synaptic plasticity. However, as the activity of the insulin receptor signaling cascade continues to function, PI3K-dependent processes become more important. This hypothesis suggests that insulin-induced synaptic plasticity occurs in multiple phases, an early PI3K-independent phase and a late PI3K-dependent phase, or that there are multiple processes occurring simultaneously utilizing different signaling pathways. PI3K-indedpendent and PI3K-dependent pathways could be acting in concert with one another; however, for unexplained reasons, throughout insulin application a particular pathway may dominate, thereby masking the outcomes of the other pathway. It is likely that these effects of insulin on synaptic transmission occur via modulation of AMPARs.
In juvenile animals, insulin caused a decrease in the PM levels of GluA2 and GluA1 subunits. The insulin- induced decrease in fEPSP rising slope, as well as the PM levels of GluA2 and GluA1, lasted at least 40 minutes after insulin application, which was not the case in mature animals. These data suggest that insulin-LTD may occur as the result of GluA2 and/or GluA1 internalization, which would provide some parallel between the mechanisms underlying stimulus-LTD and insulin-LTD.
It has previously been established that pGluA1 is important to a number of aspects of GluA1 functioning [33] , including potentiation of the amplitude of the glutamate current and regulation of the open channel probability of the receptor [34] . Data from our studies showed a decrease in the level of pGluA1S845 that followed a pattern similar to the observed decrease in GluA1. These data imply that insulin-LTD may occur as the result of decreased AMPAR activity due to a combination of factors. The fact that insulin induced a decrease in the total levels of GluA2 and GluA1 subunits present on the PM suggests an overall reduction in AMPAR number on the cell surface. Furthermore, although not tested in this work, a decrease in the level of pGluA1S845 may suggest that of the GluA1 containing receptors on the surface there is a decrease in the amplitude of the current as well as a shift in the open channel probability. In mature animals, insulin-induced changes in the PM level of the GluA2 subunit suggest that trafficking of the GluA2 subunit does not likely underlie the temporary insulin-in- duced depression in fEPSPs. However, the pattern of surface expression of the GluA1 subunit and total levels of pGluA1S845 show a time course similar to the insulin-induced depression in mature animals, and therefore may be a contributor to insulin’s transient effects on fEPSPs. Perhaps the lack of insulin effect on the GluA2 subunit in mature animals contributes to insulin-induced depression not being maintained in mature animals. Collectively, these data suggest that insulin has age-dependent effects on AMPAR subunit modulation.
An additional explanation for the mechanistic age-dependent effects of insulin may rely on MAPK activity. The MAPK experiments showed that insulin stimulation caused a decrease in Pp44 in juvenile but not mature hippocampal slices. These data also revealed that insulin led to a decrease in Pp42 in mature animals that was not observed in juvenile animals. It is presumed that the observed decrease in the total levels of Pp42 is the result of Pp42 being translocated to the nucleus. Following phosphorylation, MAP kinases can be translocated to the nucleus where they have the ability to interact with other transcription factors to ultimately affect gene regulation [35] . If indeed insulin is affecting gene transcription via Pp42, these data suggest that insulin may have different genetic effects in juvenile and mature animals. The effects of insulin on Pp42, which has been implicated in LTP [28] in mature animals, may provide insight into the age-dependent effects of insulin on synaptic transmission.
In summary, our data suggest that insulin-LTD is a complex multi-component process, in both juvenile and mature animals, that involves multiple insulin signaling molecules and glutamate receptor actions. We propose that the difference between insulin-induced synaptic plasticity in juvenile and mature animals is due primarily to age-dependent differences in insulin signaling, although the underlying mechanisms of insulin-induced synaptic plasticity show some parallels despite animal age. It is plausible that the same processes occur in both juvenile and mature animals, but that the level of insulin signaling activity differs across the lifespan, which, in turn, modulates the effects of insulin on synaptic transmission at different stages of life. The present study reveals the importance of understanding the effects of insulin on synaptic transmission, both endogenous and therapeutically applied, at different stages in life.
Acknowledgements
We thank the Alfred P. Sloan Foundation for funding towards this work. We also thank Dr. Lawrence Reagan, Dr. David Mott and Dr. Claudia Grillo for technical assistance and support on this work; and Dr. Tamara Spence and Dr. Leah Reznikov for support in the preparation of this manuscript.
Cite this paper
Shayna A. Wrighten,Gerardo G. Piroli, (2016) Insulin Age-Dependently Modulates Synaptic Transmission and AMPA Receptor Trafficking in Region CA1 of the Rat Hippocampus. Open Journal of Molecular and Integrative Physiology,06,19-33. doi: 10.4236/ojmip.2016.62003
References
- 1. Menke, A., Casagrande, S., Geiss, L. and Cowie, C.C. (2015) Prevalence of and Trends in Diabetes among Adults in the United States, 1988-2012. The Journal of the American Medical Association (JAMA), 314, 1021-1029.
http://dx.doi.org/10.1001/jama.2015.10029 - 2. van der Heide, L.P., Ramakers, G.M.J. and Smidt, M.P. (2006) Insulin Signaling in the Central Nervous System: Learning to Survive. Progress in Neurobiology, 79, 205-221.
http://dx.doi.org/10.1016/j.pneurobio.2006.06.003 - 3. Wang, F., Song, Y., Yin, J., Liu, Z., Mo, X., Wang, D., Gao, L. and Jing, Y. (2014) Spatial Memory Impairment Is Associated with Hippocampal Insulin Signals in Ovariectomized Rats. PLoS ONE, 9, e104450.
http://dx.doi.org/10.1016/j.pneurobio.2006.06.003 - 4. Winocour, G., Greenwood, C., Piroli, G., Grillo, C., Reznikov, L., Reagan, L. and McEwen, B. (2005) Memory Impairment in Obese Zucker Rats: An Investigation of Cognitive Function in an Animal Model of Insulin Resistance and Obesity. Behavioral Neuroscience, 119, 1389-1395.
http://dx.doi.org/10.1037/0735-7044.119.5.1389 - 5. Zhao, W.Q., Chen, H., Quon, M.J. and Alkon, D.J. (2004) Insulin and the Insulin Receptor in Experimental Models of Learning and Memory. European Journal of Pharmacology, 490, 71-81.
http://dx.doi.org/10.1016/j.ejphar.2004.02.045 - 6. Stern, S.A., Chen, D.Y. and Alberini, C.M. (2014) The Effect of Insulin and Insulin-Like Growth Factors on Hippocampas- and Amygdala-Dependent Long-Term Memory Formation. Learning Memory, 21, 556-563.
http://dx.doi.org/10.1101/lm.029348.112 - 7. Choi, J.H., Park, P., Baek, G.C., Sim, S.E., Kang, S., Lee, Y., Ahn, S.H., Lim, C.S., Lee, Y.S., Collingridge, G.L. and Kaang, B.K. (2014) Effects of PI3Kγ Overexpression in the Hippocampus on Synaptic Plasticity and Spatial Learning. Molecular Brain, 7, 78.
http://dx.doi.org/10.1186/s13041-014-0078-6 - 8. Huang, C.C., You, J.L., Lee, C.C. and Hsu, K.S. (2003) Insulin Induces a Novel Form of Postsynaptic Mossy Fiber Long-Term Depression in the Hippocampus. Molecular and Cellular Neuroscience, 24, 831-841.
http://dx.doi.org/10.1016/S1044-7431(03)00238-0 - 9. Huang, C.C., Lee, C.C. and Hsu, K.S. (2004) An Investigation into Signal Transduction Mechanisms Involved in Insulin-Induced Long-Term Depression in the CA1 Region of the Hippocampus. Journal of Neurochemistry, 89, 217-231.
http://dx.doi.org/10.1111/j.1471-4159.2003.02307.x - 10. Huang, C.C., Lee, C.C. and Hsu, K.S. (2010) The Role of Insulin Receptor Signaling in Synaptic Plasticity and Cognitive Function. Chang. Gung. Med. J, 33, 115-125.
- 11. van der Heide, L.P., Kamal, A., Artola, A., Gispen, W.H. and Ramakers, G.M. (2005) Insulin Modulates Hippocampal Activity-Dependent Synaptic Plasticity in a N-methyl-d-aspartate Receptor and Phosphatidyl-inositol-3-kinase-de pendent Manner. Journal of Neurochemistry, 94, 1158-1166.
http://dx.doi.org/10.1111/j.1471-4159.2005.03269.x - 12. Man, H.Y., Lin, J.W., Ju, W.H., Ahmadian, G., Liu, L., Becker, L.E., Sheng, M. and Wang, Y.T. (2000) Regulation of AMPA Receptor-Mediated Synaptic Transmission by Clathrin-Dependent Receptor Internalization. Neuron, 25, 649-662.
http://dx.doi.org/10.1016/S0896-6273(00)81067-3 - 13. Malenka, R.C. (2003) Synaptic Plasticity and AMPA Receptor Trafficking. Annals of the New York Academy of Sciences, 1003, 1-11.
http://dx.doi.org/10.1196/annals.1300.001 - 14. Malenka, R.C. and Bear, M.F. (2004) LTP and LTD: An Embarrassment of Riches. Neuron, 44, 5-21.
http://dx.doi.org/10.1016/j.neuron.2004.09.012 - 15. Adzovic, L. and Domenici, L. (2014) Insulin Induces Phosphorylation of the APMPA Receptor Subunit GluR1, Reversed by ZIP and Over-Expression of Protein Kinase M Zeta, Reversed by Amyloid Beta. Journal of Neurochemistry, 131, 582-587.
http://dx.doi.org/10.1111/jnc.12947 - 16. Kim, I.J., Lee, H.R., Sim, S.E., Baek, J., Yu, N.K., Choi, J.H., Ko, H.G., Lee, Y.S., Park, S.W., Kwak, C., Ahn, S.H., Choi, S.Y., Kim, H., Kim, K.H., Backx, P.H., Bradley, C.A., Kim, E., Jang, D.J., Lee, K., Kim, S.J., Zhuo, M., Collingridge, G.L. and Kaang, B.K. (2011) PI3Kγ Is Required for NMDA Receptor-Dependent Long-Term Depression and Behavioral Flexibility. Nature Neuroscience, 14, 1447-1454.
http://dx.doi.org/10.1038/nn.2937 - 17. Standley, S., Tocco, G., Tourigny, M.-F., Massicotte, G., Thompson, R.F. and Baudry, M. (1995) Developmental Changes in α-Amino-3-Hydroxy-5-Methyl-4-Isoxazole Propionate Receptor Properties and Expression in the Rat Hippocampal Formation. Neuroscience, 67, 881-892.
http://dx.doi.org/10.1016/0306-4522(95)00075-T - 18. Molnar, E., Pickard, L. and Duckworth, J.K. (2002) Developmental Changes in Ionotropic Glutamate Receptors: Lessons from Hippocampal Synapses. The Neuroscientist, 8, 143-153.
http://dx.doi.org/10.1177/107385840200800210 - 19. Lohmann, C. and Kessels, H.W. (2014) The Developmental Stages of Synaptic Plasticity. Journal of Physiology, 592, 13-31.
http://dx.doi.org/10.1113/jphysiol.2012.235119 - 20. Sans, N., Petralia, R.S., Wang, Y., Blahos II, J., Hell, J.W. and Wenthold, R.J. (2000) A Developmental Change in NMDA Receptor-Associated Proteins at Hippocampal Synapses. Journal of Neuroscience, 20, 1260-1271.
- 21. Ye, G., Yi, S., Gamkrelidze, G., Pasternak, J.F. and Trommer, B.L. (2005) AMPA and NMDA Receptor-Mediated Currents in developing Dentate Gyrus Granule Cells. Developmental Brain Research, 155, 26-32.
http://dx.doi.org/10.1016/j.devbrainres.2004.12.002 - 22. Grillo, C.A., Piroli, G.G., Hendry, R.M. and Reagan, L.P. (2009) Insulin-Stimulated Translocation of GLUT4 to the Plasma Membrane in Rat Hippocampus is PI3-Kinase Dependent. Brain Research, 1296, 35-45.
http://dx.doi.org/10.1016/j.brainres.2009.08.005 - 23. Bradford, M.A. (1976) A Rapid and Sensitive Method for the Quantification of Microgram Quantities of Protein Utilizing the Principle of Protein-Dye Binding. Analytical Biochemistry, 72, 248-254.
http://dx.doi.org/10.1016/0003-2697(76)90527-3 - 24. Grillo, C.A., Tamashiro, K.L., Piroli, G.G., Melhorn, S., Gass, J.T., Newsom, R.J., Reznikov, L.R., Smith, A., Wilson, S.P., Sakai, R.R. and Reagan, L.P. (2007) Lentivirus-Mediated Downregulation of Hypothalamic Insulin Receptor Expression. Physiology & Behavior, 92, 691-701.
http://dx.doi.org/10.1016/j.physbeh.2007.05.043 - 25. Piroli, G.G., Manuel, A.M., Walla, M.D., Jepson, M.J., Brock, J.W., Rajesh, M.P., Tanis, R.M., Cotham, W.E. and Frizzell, N. (2014) Identification of Protein Succination as a Novel Modification of Tubulin. Biochemical Journal, 462, 231-245.
http://dx.doi.org/10.1042/BJ20131581 - 26. Iyegnar, S.S. and Mott, D.D. (2008) Neuregulin Blocks Synaptic Strengthening after Epileptiform Activity in the Rat Hippocampus. Brain Research, 1208, 67-73.
http://dx.doi.org/10.1016/j.brainres.2008.02.045 - 27. Asrar, S., Zhou, Z., Ren, W. and Jia, Z. (2009) Ca(2+) Permeable AMPA Receptor Induced Long-Term Potentiation Requires PI3/MAP Kinases but Not Ca/CaM-Dependent Kinase II. PLoS ONE, 4, e4339.
http://dx.doi.org/10.1371/journal.pone.0004339 - 28. English, J.D. and Sweatt, J.D. (1996) Activation of p42 Mitogen-Activated Protein Kinase in Hippocampal Long Term Potentiation. Journal of Biological Chemical, 271, 24329-24332.
http://dx.doi.org/10.1074/jbc.271.40.24329 - 29. Opazo, P., Watabe, A.M., Grant, S.G. and O’Dell, T.J. (2003) Phosphatidylinositol 3-Kinase Regulates the Induction of Long-Term Potentiation through Extracellular Signal-Related Kinase-Independent Mechanisms. Journal of Neuroscience, 23, 3679-3688.
- 30. Nosyreva, E.D. and Huber, K.M. (2005) Developmental Switch in Synaptic Mechanisms of Hippocampal Metabotropic Glutamate Receptor-Dependent Long-Term Depression. Journal of Neuroscience, 25, 2992-3001.
http://dx.doi.org/10.1523/JNEUROSCI.3652-04.2005 - 31. Kovacs, P. and Hajnal, A. (2009) In Vivo Electrophysiological Effects of Insulin in the Rat Brain. Neuropeptides, 43, 283-293.
http://dx.doi.org/10.1016/j.npep.2009.05.006 - 32. Wan, Q., Xiong, Z.G., Man, H.Y., Ackerley, C.A., Braunton, J., Lu, W.Y., Becker, L.E., MacDonald, J.F. and Wang, Y.T. (1997) Recruitment of Functional GABA(A) Receptors to Postsynaptic Domains by Insulin. Nature, 388, 686-690.
http://dx.doi.org/10.1038/41792 - 33. Malinow, R. and Malenka, R.C. (2002) AMPA Receptor Trafficking and Synaptic Plasticity. Annual Review of Neuroscience, 25, 103-126.
http://dx.doi.org/10.1146/annurev.neuro.25.112701.142758 - 34. Song, I. and Huganir, R.L. (2002) Regulation of AMPA Receptors during Synaptic Plasticity. Trends in Neuroscience, 25, 578-588.
http://dx.doi.org/10.1016/S0166-2236(02)02270-1 - 35. Robinson, M.J. and Cobb, M.H. (1997) Mitogen-Activated Protein Kinase Pathways. Current Opinion in Cell Biology, 9, 180-186.
http://dx.doi.org/10.1016/S0955-0674(97)80061-0