Advances in Biological Chemistry
Vol. 2 No. 1 (2012) , Article ID: 17271 , 9 pages DOI:10.4236/abc.2012.21001
Anomeric specificity of D-glucose metabolism study in rat and human erythrocytes
![]()
Laboratory of Experimental Hormonology, Université Libre de Bruxelles, Brussels, Belgium
Email: malaisse@ulb.ac.be
Received 28 December 2011; revised 30 January 2012; accepted 7 February 2012
Keywords: D-Glucose Metabolism; Anomeric Specificity; Rat Erythrocytes; Human Erythrocytes
ABSTRACT
The anomeric specificity of D-glucose metabolism in erythrocytes has been since 1985 the matter of extensive investigations reported in about ten publications. The present report aims at providing an integrated review of the major findings on this issue.
1. INTRODUCTION
The metabolism of D-glucose in intact cells displays anomeric specificity. This was first demonstrated in rat pancreatic islets [1-3], and later observed in tumoral insulin-producing cells [3], lymphocytic leukemic cells [4], rat adipocytes [5], rat brain cells [6], rat hemidiaphragm [7] and rat hepatocytes [8-10]. The outstanding exception refers to the rat lens, in which the lack of anomeric specificity was proposed to be attributable to a low turnover rate of glucose-6-phosphate, allowing for the interconversion of glucose-6-phosphate anomers [11]. The relative extent and even algebraic sign of the difference between α- and ß-D-glucose metabolism differs, however, as a function of such factors as temperature, hexose concentration, concerned metabolic pathway and cell types. In such a perspective, the present review aims at drawing attention to the anomeric specificity of D-glucose phosphorylation, utilization and oxidation in both rat and human erythrocytes.
2. RAT ERYTHROCYTES
In a first series of experiments performed at 30˚C with D-glucose at anomeric equilibrium, the kinetics of D- [U-14C]glucose phosphorylation by rat erythrocyte homogenates yielded over a wide range of D-glucose concentrations (50 µM to 20 mM) a single straight line in a double reciprocal plot, with a Michaelis constant (Km) and maximal velocity (Vmax) close to 0.06 mM and 47 nmol/ 60 min per mg hemoglobin, respectively [12]. When D-glucose-6-phosphate (initial concentration: 1.0 mM) was added to the assay mixture, the phosphorylation of D-[U-14C] glucose was severely inhibited, the residual rate of phosphorylation representing no more than 5.3 ± 0.7% (n = 21) of the paired control value. Over 40 min incubation at 8˚C, the ß/α ratio for the phosphorylation of the Dglucose anomers, tested in the 10.0 µM to 1.0 mM range, averaged 1.61 ± 0.09 (n = 21), a mean value significantly higher (p < 0.001) than unity. The concentration of Dglucose anomers at which the reaction velocity represented 50% of the mean values reached at the highest Dglucose concentrations (0.25 and 1.0 mM) appeared somewhat lower in the case of α-D-glucose (about 33 µM) than in the case of ß-D-glucose (about 41 µM), suggesting a lower Km for the α-anomer as compared to ß-anomer [12].
A more detailed study of the anomeric specificity of rat erythrocyte hexokinase then confirmed that the α/ß ratio in maximal velocity, as derived from measurements made at 8˚C in the presence of 1.0 mM D-glucose, is close to 0.66. Based on the effects of unlabelled α- or ß- D-glucose upon the phosphorylation of D-[U-14C] glucose at anomeric equilibrium, as measured at 8˚C, the α/ ß ratio for Km values was close to 0.485, indicating a greater affinity for the α-anomer than for the ß-anomer [13].
The anomeric specificity of D-glucose metabolism in intact rat erythrocytes was first documented in 1985 [12]. Thus, at both 4.0 and 7.0 mM D-glucose, the output of lactic acid from erythrocytes incubated for 60 min at 8˚C was higher in the presence of α-D-glucose than ß-D-glucose. After correction for the basal value recorded in the absence of D-glucose (1.49 ± 0.16 nmol/mg hemoglobin; n = 56), the increment in lactic acid output attributable to ß-D-glucose (4.0 mM) averaged 39.3% ± 4.2% (n = 41) of the mean corresponding value found in the presence of α-D-glucose (100.0% ± 5.4%; n = 42). Such a difference was less marked at a higher concentration of D-glucose (7.0 mM), the ß-D-glucose-induced increment in lactic acid output averaging 73.7% ± 5.8% (n = 35) of the mean corresponding value measured in the presence of α-D-glucose (100.0% ± 10.4%; n = 36). The anomeric difference in lactic acid output was significant at both 4.0 mM (p < 0.001) and 7.0 mM (p < 0.05) D-glucose. In parallel experiments conducted in rat erythrocytes incubated for 60 min at 7˚C [4], the conversion of D-[5-3H] glucose to 3HOH was also found to be higher in the presence of α-D-glucose than ß-D-glucose, whether at 1.0, 4.0 or 7.0 mM, the results recorded with ß-D-glucose averaging at these three D-glucose concentrations respectively 85.9% ± 2.5% (n = 40), 85.3% ± 2.4% (n = 39) and 92.7% ± 4.6% (n = 35) of the mean corresponding values found with α-D-glucose, i.e. 100.0% ± 3.2% (n = 40), 100.0% ± 2.1% (n = 40) and 100.0% ± 2.7% (n = 40). The anomeric difference was thus more marked for lactic acid output than for D-[5-3H]glucose utilization.
In conclusion, results in mirror image were obtained for the phosphorylation of D-glucose by rat erythrocyte homogenates, on one hand, with a higher reaction velocity recorded with the ß- rather than α-anomer of D-glucose, and the metabolism of the D-glucose anomers in intact erythrocytes, on the other hand, with a higher D-[5-3H] glucose utilization and higher glucose-induced increments in lactic acid output with α- than ß-D-glucose. Taken as a whole, these studies conducted in cells not expressing glucokinase indicate that the anomeric specificity of glycolysis in intact cells does not necessarily depend on the anomeric preference of D-glucose phosphorylation in cell homogenates.
A further investigation on the metabolism of D-glucose anomers in rat erythrocytes aimed at a comparison between control animals and streptozotocin-induced diabetic rats [14]. Five days after the intravenous administration of streptozotocin (80 - 90 mg/kg body weight), the diabetic rats were severely hyperglycemic (plasma glucose concentration: 23.3 ± 1.3 mM versus a control value of 7.3 ± 0.5 mM; n = 5 - 6). The erythrocytes were incubated over 45 min at 8˚C in the presence of tracer amounts of D-[U-14C]glucose or D-[5-3H]glucose at anomeric equilibrium and either freshly dissolved unlabelled α- or ß-D-glucose (7.0 mM). The absolute value for 14CO2 production from D-[U-14C]glucose in the presence of ß-D-glucose was not significantly different in control rats (46.2 ± 1.6 fmol/min per µl blood; n = 24) and diabetic rats (55.2 ± 8.9 fmol/min per µl blood; n = 21). The absolute value for 3HOH production from D-[5-3H]glucose in the presence of ß-D-glucose was lower (p < 0.005), however, in diabetic animals (742 ± 77 fmol/min per µl blood; n = 33) than in control rats (980 ± 64 fmol/min per µl blood; n = 35). The 14CO2/3HOH ratio was thus higher (p < 0.05) in diabetic animals (7.44 ± 1.36%; df = 52) than in control rats (47.1 ± 0.40%; df = 57). Whether in control rats or diabetic animals, both the output of 14CO2 and production of 3HOH were lower (p < 0.05 or less) in the presence of α-D-glucose than in the presence of ß-D-glucose (Table 1). The relative extent of such anomeric differences was not significantly different (p > 0.2 or more) in control and diabetic rats. These experiments were conducted in the perspective of distinguishing between the accumulation of glycogen and nonenzymatic glycation of cytosolic proteins as a possible determinant of the so-called anomeric malaise observed in diabetic subjects, rats and rabbits [15-19]. The selection of erythrocytes for such a purpose was motivated by the two following considerations. First, in diabetes, virtually no glycogen accumulation in erythrocytes [20,21]. Second, erythrocytes represent a well-known target for the non-enzymatic glycation of cytosolic proteins [22], as also occurs in other cell types characterized by a closeto-equilibrium partition of D-glucose concentrations across the plasma membrane, e.g. in hepatocytes [23] and pancreatic islet B-cells [24]. The present findings afford several pieces of information. First, they confirm a prior observation recorded at 37˚C, instead of 8˚C, and indicating that the generation of 3HOH from D-[5-3H] glucose and, as a matter of fact, also from D-[2-3H]glucose is lower in erythrocytes from diabetic rats than in erythrocytes from control animals, averaging respectively over 60 min incubation in the diabetic and control rats 857.4 ± 89.3 and 1302.6 ± 110.8 pmol/µl blood in the case of D-[5-3H]glucose and 540.7 ± 70.6 and 998.3 ± 82.2 pmol/µl blood in the case of D-[2-3H]glucose (n = 6 in all cases) [25]. Second, the present findings indicate that, under the present experimental conditions, unlabelled α- D-glucose decreases more efficiently than unlabelled ß- D-glucose both the oxidation of D-[U-14C]glucose and utilization of D-[5-3H]glucose, used at anomeric equilibrium in tracer amounts, in fair agreement with the data obtained when comparing the metabolic fate of the Dglucose anomers in prior experiments (see above). Third, they reveal that, in the latter respect, no significant difference was found between erythrocytes prepared from either control animals or diabetic rats. In other words, the
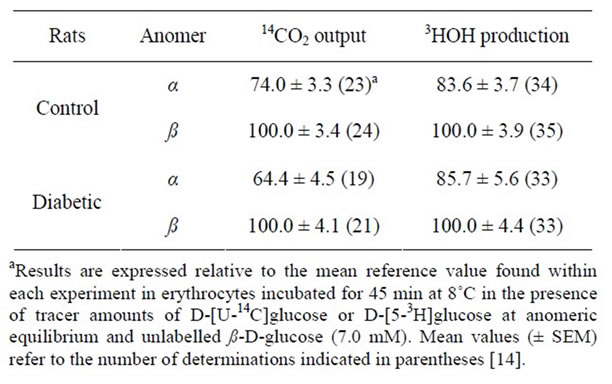
Table 1. Anomeric specificity of D-glucose metabolism in rat erythrocytes.
anomeric specificity of D-glucose metabolism, whether in the glycolytic pathway or pentose phosphate pathway, is not altered in erythrocytes obtained from diabetic rats. Since diabetes increases the non-enzymatic glycation of cytosolic proteins in erythrocytes, the latter finding argues against the view that such a glycation process may lead to perturbation of the anomeric specificity of hexose metabolism. Two further sets of observations support such a proposal. First, a decrease in both D-[2-3H]glucose and D-[5-3H]glucose (7.0 mM) at anomeric equilibrium was also observed over 60 min incubation at 37˚C in erythrocytes from rats rendered hyperglycemic (13.1 ± 1.3 mM versus a control value of 6.2 ± 0.2 mM; n = 5 - 6) after only 48 hours administration of diazoxide [26], under which condition no sizeable change in the glycation of cytosolic protein is observed, whether in erythrocytes or hepatocytes [27]. Second, the catalytic properties of glycated phosphoglucoisomerase, in terms of anomeric specificity, as well as specific activity, isotopic discrimination and intramolecular hydrogen transfer, fail to differ significantly from those found in a control preparation of the enzyme [28].
The last set of experiments conducted in erythrocytes from normal rats aimed at exploring the possible enzymeto-enzyme channeling of glycolytic intermediates [29]. For such a purpose, the erythrocytes were incubated for 60 min at 4˚C 1) in the presence of 2.8 or 8.3 mM Dglucose at anomeric equilibrium mixed with tracer amounts of equilibrated D-[2-3H]glucose or D-[5-3H]glucose or 2) in the presence of freshly dissolved α- or ß-D-glucose (also 2.8 or 8.3 mM) mixed with the corresponding tritiated anomers. In the erythrocytes exposed at 4˚C to Dglucose at anomeric equilibrium, the generation of 3HOH from D-[5-3H]glucose was about one order of magnitude lower than that recorded at 37˚C, with a Q10 close to 2.2. At 4˚C and at anomeric equilibrium, a rise in D-glucose concentration from 2.8 to 8.3 mM increased, modestly but significantly, the generation of 3HOH from the tritiated hexoses. Under these experimental conditions, the generation of 3HOH from D-[2-3H]glucose averaged, at 2.8 and 8.3 mM respectively, 83.4% ± 3.1% (n = 21) and 91.3% ± 4.2% (n = 21) of the mean values found within the same experiment(s) at the same hexose concentration for the generation of 3HOH from D-[5-3H]glucose (Figure 1). The D-[2-3H]glucose/[5-3H]glucose ratio for 3HOH generation was thus lower at 2.8 mM D-glucose, in which case it differed significantly from unity (p < 0.005), than at 8.3 mM D-glucose, in which case it failed to be significantly lower than unity (p > 0.1). These findings represent a first indication that relative to its phosphory-
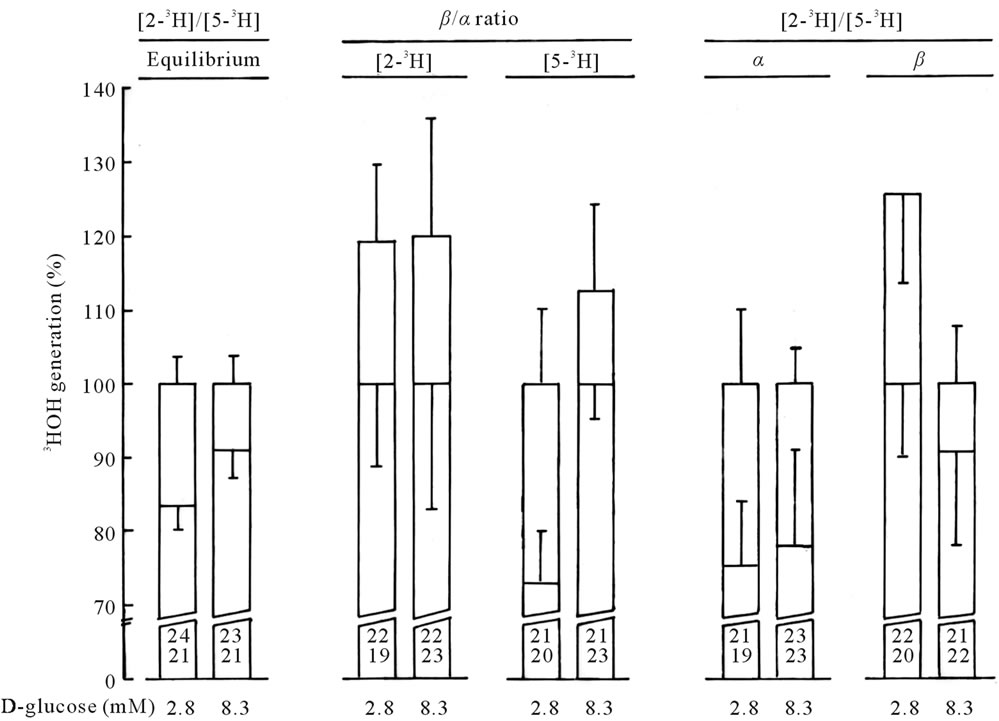
Figure 1. The figure depicts, from left to right, the generation of 3HOH 1) from D-[2-3H]glucose relative to that from D-[5-3H]glucose in erythrocytes exposed to equilibrated D-glucose; 2) from ß-D- [2-3H]glucose relative to that from α-D-[2-3H]glucose and from ß-D-[5-3H]glucose relative to that from α-D-[5-3H]glucose; and 3) from α- and ß-D-[2-3H]glucose relative to that from α- and ß-D-[5-3H]glucose. Mean values (± SEM) obtained in each case at two concentrations of the hexose (2.8 and 8.3 mM) are derived from the number of observations indicated at the bottom of each column [34].
lation rate, the channeling of α-D-glucose 6-phosphate between hexokinase and phosphog-lucoisomerase was somehow decreased in response to a rise in hexose concentration. Such a channeling is indeed mainly responsible for the lower generation of 3HOH from D-[2-3H]glucose, as compared to D-[5-3H]glucose [30,31].
In the presence of the pure anomers, the rise in Dglucose concentration from 2.8 to 8.3 mM increased the generation of 3HOH from either the α- or ß-anomers of tritiated D-glucose. However, the rise in hexose concentration increased to a greater relative extent the generation of 3HOH from tritiated ß-D-glucose, as compared to α-D-glucose. Such a situation is consistent with the lower Km of hexokinase for the α-anomer, as distinct from ß-anomer, of D-glucose in rat erythrocyte homogenates [12,13]. At 2.8 mM, the ß/α ratio for 3HOH generation from the [5-3H]anomers averaged 73.2% ± 10.2% (df = 37; p < 0.02 versus unity). At 8.3 mM, however, the ß/α ratio for 3HOH generation from the [5-3H]anomers was no more significantly different from unity (p > 0.2), averaging 114.4% ± 11.2% (df = 40) as illustrated in Figure 1. These findings are in fair agreement with a prior observation concerning the increment in lactic acid output above basal value [12] and are consistent with the knowledge that, at high concentrations of D-glucose, the higher maximal velocity of ß-D-glucose phosphorylation by hexokinase compensates for the lower affinity of the enzyme for the ß-anomer [13]. At variance with the results obtained with the D-[5-3H]glucose anomers, the ß/α ratio for 3HOH generation from D-[2-3H]glucose anomers was not significantly different from unity, whether at 2.8 or 8.3 mM, with mean respective values of 117.4% ± 17.6% (df = 37) and 120.4% ± 27.4% (df = 41), as documented in Figure 1. Thus, such a ratio was significantly higher (p < 0.05) than the ß/α ratio for 3HOH generation from the D-[5-3H]anomers at 2.8 mM, but not so at 8.3 mM (p > 0.8). Since a higher ß/α ratio for 3HOH generation from D-[2-3H]glucose, as compared to 3HOH generation from D-[5-3H]glucose, represents a characteristic feature of the enzyme-to-enzyme channeling of α- D-glucose 6-phosphate between hexokinase isoenzyme(s) and phosphoglucoisomerase [31], the latter finding again suggests that the rise in hexose concentration adversely affected such a channeling process in rat erythrocytes. At both 2.8 and 8.3 mM, the generation of 3HOH from α-D- [2-3H]glucose was lower than that from α-D-[5-3H]glucose, with an overall mean [2-3H]/[5-3H] ratio of 77.2 ± 9.2% (df = 78; p < 0.02). A different situation prevailed in the erythrocytes exposed to ß-D-glucose, in which case the [23H]/[5-3H] ratio for 3HOH generation was no more significantly different from unity, whether at 2.8 or 8.3 mM, with an overall mean value of 109.2% ± 11.9% (df = 77; p > 0.4). These results confirm that a low value for the [2-3H]/[5-3H] ratio for 3HOH generation represents a typical feature of α-D-glucose metabolism, once again in agreement with the concept that the postulated channeling process between hexokinase and phosphoglucoisomerase concerns α-D-glucose 6-phosphate rather than ß-D-glucose 6-phosphate, as expected from the intrinsic properties of phosphoglucoisomerase [32].
In conclusion, the present results, when compared to those recently collected in rat pancreatic islets [33,34], document that the channeling of α-D-glucose 6-phosphate from its site of generation to phosphoglucoisomerase is affected in opposite manner by a rise in hexose concentration in rat erythrocytes versus rat pancreatic islets. Such contrasting situations support the view that the regulation of the enzyme-to-enzyme tunneling process tightly depends on the identity of the hexokinase isoenzyme (low-Km hexokinase versus high Km glucokinase) mainly responsible for the phosphorylation of Dglucose in distinct cell types.
3. HUMAN ERYTHROCYTES
Further experiments were conducted in human erythrocytes and revealed individual variability in the anomeric specificity of D-glucose phosphorylation and catabolism. Three series of experiments were conducted on the anomeric specificity of D-glucose phosphorylation by human erythrocyte homogenates. In the first series, conducted in two normal subjects, the α/ß ratio for the Km, as judged from the effect of unlabelled α- or ß-D-glucose (75 µM) upon the phosphorylation of D-[5-3H]glucose (25 µM) at anomeric equilibrium over 30 min incubation at 10˚C averaged, in these two subjects 0.424 ± 0.011 and 0.468 ± 0.016, indicating a greater affinity for α- than ß-D-glucose [35]. The α/ß ratio in maximal velocity, as judged from the phosphorylation of the anomers (1.0 mM) mixed with a tracer amount of the corresponding α- and ß-anomer of either D-[U-14C]glucose or D-[5-3H]glucose yielded mean respective values of 0.751 ± 0.030 and 0.741 ± 0.018 in the first subject, and 0.716 ± 0.026 and 0.745 ± 0.009 in the second subject, indicating a higher maximal velocity of human erythrocyte hexokinase with ß-D-glucose than with α-D-glucose.
In the second series, conducted in 13 normal subjects, the α/ß ratio for the Km, also judged from the effects of unlabelled α- or ß-D-glucose (40 and 90 µM) upon the phosphorylation of D-[U-14C]glucose (10 µM) at anomeric equilibrium over 5 min incubation at 22˚C, averaged in the presence of 40 or 90 µM unlabelled D-glucose anomer 57.4% ± 5.5% (n = 13), thus confirming the higher affinity for α-D-glucose than ß-D-glucose. It should be underlined, however, that in one subject such an α/ß ratio amounted to 116.1% as distinct (p < 0.001) from 52.5% ± 2.7% in the other 12 normal subjects [36]. Moreover, in another of the last 12 subjects, the absolute values of the Km for both α- and ß-D-glucose were far above the upper limit of the range of values otherwise recorded in these normal subjects. In the two subjects with either an unexpectedly high α/ß ratio for the Km or abnormally high absolute Km values, the α/ß ratio in maximal velocity, as measured over 5 min incubation at 22˚C in the presence of 1.0 mM α- or ß-D-glucose, also unexpectedly yielded high values (104.6% and 125.6%), as distinct (p < 0.001) from 86.7% ± 2.5% in the other eleven normal subjects. The latter mean value is not significantly different (p > 0.05) from that recorded in our first series of experiments (73.8% ± 0.8%; n = 2). As a matter of fact, in the second series of experiments, individual values of 77.2%, 77.5% and 79.8% were recorded, so that the values found in the first series of experiments remain well above the lower limit of the 95% confidence interval for individual values as measured in the eleven normal subjects mentioned above. Incidentally, one of the two subjects displaying in the second series of experiments a high α/ß ratio (104.6%) in maximal velocity also remained within the limits of the just mentioned 95% confidence interval. It should be stressed that the latter subject also displayed a normal α/ß ratio in Km (48.9%). In conclusion, despite far-from-negligible individual variations, only one out of 13 subjects yielded truly abnormally values of the α/ß ratio for both Km (116.1%) and Vmax (125.6%). This exceptional situation is reminiscent of the observation made in a normal female subject who, at variance with fifteen other normal subjects examined in the same study, identified ß-D-glucose as sweeter than α-D-glucose on five distinct occasions over a period of one year [37].
The third series of experiments concerned 32 diabetic patients (13 males and 19 females) with a mean age of 58 ± 2 years, a mean body mass index of 30.0 ± 1.2 kg/m2, mean plasma D-glucose and C-peptide concentrations of respectively 10.3 ± 0.6 mM and 2.0 ± 0.2 ng/ml, and a mean HbA1c percentage of 11.2% ± 0.4% [38]. The Km for each anomer was judged from the effects of unlabelled α- or ß-D-glucose (40 and 90 µM) upon the phosphorylation of D-[-U-14C]glucose (10 µM) at anomeric equilibrium over 5 min incubation at 22˚C. Likewise, the maximal velocity for α- and ß-D-glucose was measured over 5 min incubated at 22˚C at a 1.0 mM concentration of the concerned anomer. In all subjects, the Michaelis constant was lower with α- than ß-D-glucose, the α/ß ratio for Km averaging 59.2% ± 2.4%. Also in all subjects, the maximal velocity was higher with ß-D-glucose than α-D-glucose with a mean α/ß ratio averaging 81.8% ± 1.2%. The latter two values are not different from those recorded in the 14 normal subjects examined in the two first series of experiments.
Two sets of experiments dealing with the anomeric specificity of D-glucose metabolism in intact cells were conducted in human erythrocytes. The first of these studies provided several new pieces of information [39]. First, they revealed that the metabolism of D-glucose displays anomeric specificity in human erythrocytes. Second, they indicated that, at a close-to-physiological concentration of D-glucose (4.0 mM), the utilization of D-[5-3H]glucose, as measured over 60 min incubation at 9˚C, is, as a rule, higher with pure ß- than α-D-glucose. This represents a mirror image of that found with rat erythrocytes [4,12] and, hence supports the concept that the anomeric specificity of hexose metabolism underwent a phylogenetic evolution [40,41]. Third, the experimental data indicated that, even under standardized conditions, the anomeric specificity of D-glucose metabolism in human erythrocytes displays significant individual variations. For instance, in erythrocytes obtained from 11 normal subjects and 2 diabetic individuals, the α/ß ratio for 3H2O production from D-[5-3H]glucose (4.0 mM), measured over 60 min incubation at 9˚C, ranged between the extreme values of 0.760 and 1.025, with an overall mean value of 0.899 ± 0.022 (n = 23; p < 0.001 as compared to unity). It should be underlined that all these measurements were performed in the presence of 4.0 mM D-glucose, at which concentration the utilization of equilibrated D-glucose over 60 min incubation at 9˚C is close to its maximal value. Incidentally, the first indication of individual variations emerged from the following findings. In a first subject (A), the utilization of pure α-D-[5-3H]glucose (0.1 mM) over 60 min incubation at 9˚C did not exceed that of ß-D-[5-3H]glucose. In three other subjects (B to D), however, the mean value for 3HOH production from α-D-[5-3H]glucose (60.7 ± 1.7 pmol/µl blood; n = 24) used at the same low concentration (0.1 mM), exceeded (p < 0.005) the mean value found with ß-D-[5-3H]glucose (52.3 ± 2.0 pmol/µl blood; n = 24). In these subjects (A to D), the total production of 3HOH from equilibrated D-glucose (0.1 mM) was not significantly different from that found with pure ß-D- [5-3H]glucose, whilst the relative contribution of the α- anomer to the total production of 3HOH by erythrocytes exposed for 60 min at 9˚C to 0.1 mM D-glucose at anomeric equilibrium exceeded that expected from its relative value (36.2%) in both subject A (42.0% ± 1.0%; n = 32) and subjects B to D (42.2% ± 1.7%; n = 24).
Last, information was obtained on the influence of several environmental factors on the anomeric specificity of D-glucose metabolism. All relevant experiments were conducted with erythrocytes of subject A. It was first observed that over 6 min incubation at 37˚C in the presence of equilibrated D-glucose (0.1 mM), the relative contribution of α-D-glucose to the total generation of 3HOH from D-[5-3H]glucose (39.7% ± 1.3%; n = 16) exceeded (p < 0.02) that expected from its relative abundance. Moreover, over 6 min incubation at 37˚C in the presence of 7.0 mM α- or ß-D-glucose, the generation of 3HOH from D-[5-3H]glucose was significantly higher (p < 0.001) with ß-D-glucose (134.8 ± 2.4 pmol/µl blood; n = 16) than with α-D-glucose (99.8 ± 4.5 pmol/µl blood; n = 16). These findings document that, even at a physiological temperature (37˚C), the metabolism of D-glucose displays anomeric specificity. Second, both over 6 min incubation at 37˚C and over 60 min incubation at 9˚C, a rise in D-glucose concentration from 0.1 to 7.0 mM at 37˚C or from 0.1 to 1.0 and 7.0 mM at 9˚C resulted in a progressive decrease from a preference for α-D-glucose to a preference for ß-D-glucose as judged, for instance, by the relative contribution of α-D-glucose to the total generation of 3HOH from D-[5-3H]glucose at anomeric equilibrium from 39.7% ± 1.3% to 35.8% ± 0.6% (n = 16 in all cases) at 37˚C and from 42.0 ± 1.0% (n = 32) to 39.6% ± 2.1% (n = 24) and 38.2% ± 0.9% (n = 24) at 9˚C. Likewise, the ß/α ratio for the utilization of the pure anomers progressively increased at 37˚C from 97.4% ± 3.7% (df = 30) to 135.1% ± 6.6% (df = 30) when the concentration of D-glucose was increased from 0.1 to 7.0 m. Also at 9˚C, whilst no anomeric difference in the production of 3HOH was observed in the presence of the pure anomers tested at a 0.1 mM concentration, the ß- anomer was more efficiently metabolized than the α-anomer (p < 0.05) at a 7.0 mM concentration. These findings are in fair agreement with those expected from the abovementioned anomeric behaviour of hexokinase in human erythrocyte homogenates. Such an analogy coincides with the relatively low fractional turnover rate of the erythrocyte pool of D-glucose 6-phosphate, which does not exceed at 9˚C in the presence of 7.0 mM equilibrated D-glucose 0.13 ± 0.01 min–1 [11,39]. Third, over 60 min incubation at 9˚C, the production of 14CO2 from D-[U-14C] glucose (0.1 mM) was higher with pure α-D-glucose than ß-D-glucose, this coinciding with a relative concentration of the α-anomer to the generation of 14CO2 from equilibrated D-[U-14C]glucose (also 0.1 mM) averaging 50.0% ± 4.2% (n = 24) in large excess (p < 0.005) of its relative abundance. Incidentally, over 60 min incubation at 9˚C in the presence of equilibrated D-glucose (0.1 mM), the oxidation of D-[U-14C]glucose, i.e. 0.41 ± 0.02 pmol/µl blood (n = 24) was two orders to magnitude lower than the utilization of D-[5-3H]glucose, i.e. 67.9 ± 1.2 pmol/µl blood (n = 32).
Figure 2 illustrates the positive correlation (r = 0.8584; n = 7; p < 0.05) between the relative contribution of the ß-anomer to the metabolism of equilibrated D-glucose and the corresponding α/ß ratio for the metabolism of pure anomers. The mean results illustrates in this figure corresponds to all the data collected in subject A and B to D and were thus obtained at two temperature (9˚C and 37˚C), at increasing concentrations of D-glucose (0.1, 1.0 and 7.0 mM), in erythrocytes removed from distinct sub-
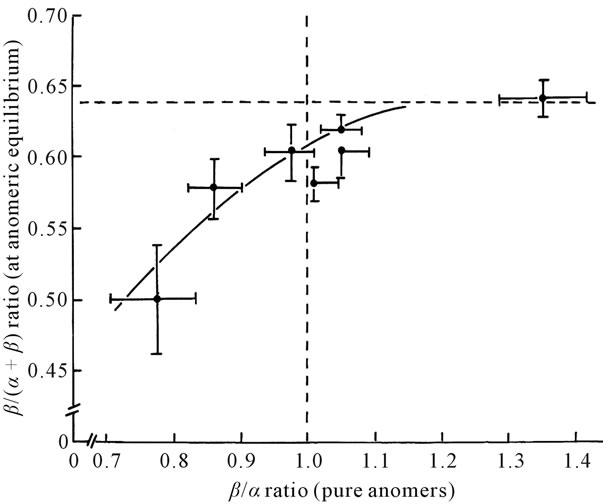
Figure 2. Relationship between mean values (± SEM) for the relative contribution of ß-D-glucose to the overall metabolism of equilibrated D-glucose and the corresponding ß/α ratio for the metabolism of pure anomers [39]. The dotted vertical line refers to a situation in which no difference is observed in the metabolism of the pure anomers. The dotted horizontal line refers to the situation in which the relative contribution of ß-Dglucose to the overall metabolism of equilibrated D-glucose is identical to the abundancy of the ß-anomer (i.e. 0.638).
jects, and for two distinct metabolic parameters (3HOH and 14CO2 production). Despite such a heterogeneity in experimental conditions, there appeared to exist a single relationship between the two variables under consideration.
The second set of experiments dealing with the anomeric specificity of D-glucose metabolism in intact human erythrocytes concerned the oxidation of 14C-labelled D-glucose [35]. It was first documented that the oxidation of D-[U-14C]glucose at anomeric equilibrium over 60 min incubation at 10˚C increased as a function of the extracellular concentration of the hexose (0.07, 0.2 and 5.6 mM) from 43.6 ± 2.2 (n = 9) to 210.3 ± 12.1 (n = 18) fmol/µl. An inhibitor of aldose reductase significantly decreased 14CO2 output, the relative extent of such an inhibitory effect being comparable at low (0.07 - 0.2 mM) D-glucose concentration (21.1% ± 5.0%; df = 29; p < 0.001) and normal (5.6 mM) D-glucose concentration (21.5% ± 9.8%; df = 34; p < 0.01). Incidentally, the oxidation of D-[U-14C]glucose (5.6 mM) was about 6 - 7 times lower at 10˚C than at 37˚C, in which case it amounted to 1.17 ± 0.03 pmol/µl per 60 min (n = 17).
In pilot experiments performed with D-[U-14C]glucose (5.6 mM) at anomeric equilibrium, menadione (20 µM) was found to cause, over 60 min incubation at 10˚C, a 15-fold increase in 14CO2 output, the ratio of test/control values averaging 15.3 ± 1.2 (df = 15). Menadione (20 µM) failed, however, to affect the production of 3HOH from D-[5-3H]glucose. Thus, over 60 min incubation at 10˚C in the presence of either 0.2 or 5.6 mM D-[U-14C]glucose, the production of 3HOH in the presence of menadione averaged 98.2% ± 1.9% of the corresponding mean control values (100.0% ± 2.9%; n = 17 in both cases) found in the absence of menadione. Incidentally, at 10˚C, the production of 3HOH from D-[5-3H] glucose was about 600 - 700 times higher than the oxidation of D-[U-14C]glucose. In the light of these findings, the erythrocytes were incubated for 60 min at 10˚C with either α- or ß-D-[U-14C]glucose (0.2 and 5.6 mM) in the absence or presence of menadione. In the absence of menadione, the oxidation of the D-[U-14C]glucose anomers increased about 7 - 8 times as the hexose concentration was raised from 0.2 to 5.6 mM. In the absence of menadione α-D-[U-14C]glucose was more efficiently oxidized than ß-D-[-U-14C]glucose (α/ß ratio: 1.21 ± 0.06; df = 34; p < 0.005) when the hexose was present at a low extracellular concentration (0.1 mM). Such a difference faded out, however, at higher D-glucose concentrations, in which case the α/ß ratio in 14CO2 output averaged 0.89 ± 0.06 (df = 63; p > 0.05 versus unity). The results obtained in the presence of menadione (20 µM) are summarized in Table 2. Once again, the α-anomer was oxidized more efficiently than the ß-anomer at a low concentration of D-glucose (0.2 mM), whereas the opposite situation prevailed at a higher D-glucose concentration (5.6 mM). These anomeric differences were documented either by the absolute values for 14CO2 output from erythrocytes exposed to menadione (p < 0.01) or by the ratio in 14CO2 output in the presence/absence of menadione (p < 0.001). In contrast to the results recorded in the absence of menadione, the absolute value for D-[U-14C] glucose oxidation in the presence of menadione appeared little affected by the extracellular concentration of the hexose (Table 2).
These findings suggest that at least three factors may condition the anomeric specificity of D-[U-14C]glucose oxidation in human erythrocytes, namely the anomeric difference in D-glucose phosphorylation, the apparent preference of aldose reductase for α-D-glucose and the ß- stereospecificity of glucose 6-phosphate dehydrogenase. As already mentioned, the participation of human erythrocyte hexokinase, with higher maximal velocity but lower affinity for ß-D-glucose than α-D-glucose, may be favoured by the relatively low fractional turnover rate of the D-glucose 6-phosphate pool. The results obtained in the presence of the aldose reductase inhibitor are consistent with a coupling between the sorbitol and pentose phosphate pathways. Indeed, aldose reductase behaves apparently as an α-stereospecific enzyme [42,43]. Last, the results recorded in the presence of me nadione, which allows for the efficient reoxidation of NADPH, again point to a far-from-negligible role for the intrinsic pro-
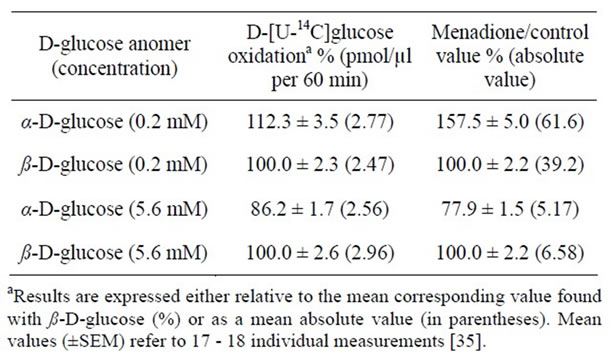
Table 2. D-[U-14C]glucose oxidation by human erythrocytes incubated for 60 min at 10˚C in the presence of menadione (20 µM).
perties of hexokinase in the anomeric difference of D-[U- 14C]glucose oxidation.
4. CONCLUSION
The findings reviewed in this report document that the anomeric specificity of D-glucose metabolism in either rat or human erythrocytes participates in the fine regulation of this hexose oxidation and utilization in cells for which D-glucose represents the major nutrient.
5. ACKNOWLEDGEMENTS
I am grateful to C. Demesmaeker for secretarial help.
REFERENCES
- Malaisse, W.J., Sener, A., Koser, M. and Herchuelz, A. (1976) The stimulus-secretion coupling of glucose-induced insulin release. XXIV. The metabolism of aand ß- D-glucose in isolated islets. Journal of Biological Chemistry, 251, 5936-5943.
- Malaisse, W.J., Sener, A., Koser, M. and Herchuelz, A. (1976) Identification of the a-stereospecific glucosensor in the pancreatic B-cell. FEBS Letters, 65, 131-134. doi.10.1016/0014-5793(76)80463-2
- Malaisse, W.J., Giroix, M.-H. and Sener, A. (1985) Anomeric specificity of glucose metabolism in the pentose cycle. Journal of Biological Chemistry, 260, 14630-14632.
- Malaisse, W.J., Giroix, M.-H., Dufrane, S.P., MalaisseLagae, F. and Sener, A. (1985) Environmental modulation of the anomeric specificity of glucose metabolism in normal and tumoral cells. Biochimica et Biophysica Acta, 847, 48-52. doi.10.1016/0167-4889(85)90151-X
- Malaisse-Lagae, F. and Malaisse, W.J. (1986) Anomeric specificity of D-glucose metabolism in adipocytes. European Journal of Biochemistry, 158, 663-666. doi.10.1111/j.1432-1033.1986.tb09804.x
- Malaisse, W.J. and Malaisse-Lagae, F. (1987) Anomeric specificity of D-glucose metabolism in rat brain cells. Brain Research, 419, 147-155. doi.10.1016/0006-8993(87)90578-6
- Zhang, Y., Courtois, P., Sener, A. and Malaisse, W.J. (2004) Anomeric specificity of D-[U-14C] glucose incorporation into glycogen in rat hemidiaphragms. Biochimie, 86, 913-918. doi.10.1016/j.biochi.2004.09.026
- Malaisse, W.J. (1986) Anomeric specificity of D-glucose utilization in rat hepatocytes. IRCS Medical Science, 14, 609-610.
- Zähner, D., Rasschaert, J. and Malaisse, W.J. (1987) Anomeric specificity of liver glycogenolysis. Biochimica et Biophysica Acta, 926, 115-118. doi.10.1016/0304-4165(87)90226-1
- Malaisse, W.J. and Willem, R. (2004) Anomeric specificity of D-glucose production by rat hepatocytes. Molecular and Cellular Biochemistry, 266, 145-150. doi.10.1023/B:MCBI.0000049152.06259.4b
- Sterling, I., Sener, A. and Malaisse, W.J. (1988) Metabolism of D-glucose anomers in rat lens. Ophthalmic Research, 20, 245-256. doi.10.1159/000266654
- Malaisse, W.J., Giroix, M.-H., Dufrane, S.P., MalaisseLagae, F. and Sener, A. (1985) Anomeric specificity of glucose metabolism in a non glucokinase-containing cell. Biochemistry International, 10, 233-240.
- Giroix, M.-H., Dufrane, S.P., Sener, A. and Malaisse, W.J. (1986) Anomeric specificity of mammalian hexokinase. Archives Internationales de Physiologie et de Biochimie, 94, 161-172. doi.10.3109/13813458609071413
- Malaisse, W.J. (1990) Anomeric specificity of D-glucose metabolism in erythrocytes from diabetic rats. Medical Science Research, 18, 287-288.
- Rovira, A., Garrotte, F.J., Valverde, I. and Malaisse, W.J. (1987) Anomeric specificity of glucose-induced insulin release in normal and diabetic subjects. Diabetes Research, 5, 119-124.
- Leclercq-Meyer, V., Marchand, J. and Malaisse, W.J. (1987) Alteration of the insulin secretory response to D-glucose anomers in diabetic BB rats. Medical Science Research, 15, 1535-1536.
- Malaisse, W.J., Malaisse-Lagae, F. and Leclercq-Meyer, V. (1988) Anomeric specificity of hexose metabolism in health and disease. Netherlands Journal of Medicine, 33, 247- 256.
- Niki, A., Niki, H., Niki, I. and Kunoh, Y. (1988) Insulin release by glucose anomers in a rat model of non-insulindependent diabetes. Diabetologia, 31, 65-67.
- Fichaux, F., Marchand, J., Yaylali, B., Leclercq-Meyer, V., Catala, J. and Malaisse, W.J. (1991) Altered anomeric specificity of glucose-induced insulin release in rabbits with duct-ligated pancreas. International Journal of Pancreatology, 8, 151-167.
- Wagner, R. (1946) The estimation of glycogen in whole blood and white blood cells. Archives of Biochemistry, 11, 249-258.
- Segers, O., Somers, G., Sener, A. and Malaisse, W.J. (1990) Blood glycogen and metabolic control in diabetes mellitus. Diabetic Medicine, 7, 207-210. doi.10.1111/j.1464-5491.1990.tb01371.x
- Brun, H.F., Gabbay, K.H. and Gallop, P.M. (1978) The glycosylation of hemoglobin: Relevance to diabetes mellitus. Science, 200, 21-27. doi.10.1126/science.635569
- Zähner, D., Ramirez, R. and Malaisse, W.J. (1990) Nonenzymatic glycation of liver cytosolic proteins in diabetic rats. Medical Science Research, 18, 33-34.
- Malaisse, W.J. (1990) Physiology and pathology of the pancreatic B-cell glucose-sensor device. The Morgagni Prize Lecture. In: Crepaldi, G., Tiengo, A. and Enzi, G., Eds., Diabetes, obesity and hyperlipidemias, Elsevier Science Publishers, Amsterdam, 3-22.
- Malaisse, W.J. (1990) Altered ratio between D-[2-3H] glucose and D-[5-3H]glucose utilisation by erythrocytes of diabetic rats. Medical Science Research, 18, 219-220.
- Malaisse, W.J. and De Vos, A. (1990) Diabetes-induced alteration in D-[2-3H]glucose detritiation by erythrocytes: intrinsic or environmental perturbation of phosphor-glucoisomerase? Medical Science Research, 18, 305-306.
- Zähner, D., Ramirez, R. and Malaisse, W.J. (1990) Kinetic behaviour of liver glucokinase in diabetes. III. Possible role of insulinopenia. Diabetes Research, 14, 117- 122.
- Zähner, D., Liemans, V., Malaisse-Lagae, F. and Malaisse, W.J. (1989) Non-enzymatic glycation of phosphoglucoisomerase. Diabetes Research, 12, 165-169.
- Zhang, Y., Jijakli, H., Courtois, P., Sener, A. and Malaisse, W.J. (2004) Metabolism of tritiated D-glucose anomers in rat erythrocytes. Molecular and Cellular Biochemistry, 259, 101-104. doi.10.1023/B:MCBI.0000021361.19813.c0
- Malaisse, W.J. and Bodur, H. (1991) Hexose metabolism in pancreatic islets. Enzyme-to-enzyme tunnelling of hexose 6-phosphates. International Journal of Biochemistry, 23, 1471-1481. doi.10.1016/0020-711X(91)90290-4
- Malaisse, W.J., Zhang, Y., Jijakli, H., Courtois, P. and Sener, A. (2004) Enzyme-to-enzyme channelling in the early steps of glycolysis in rat pancreatic islets. International Journal of Biochemistry and Cell Biology, 36, 1510- 1520. doi.10.1016/j.biocel.2003.12.013
- Willem, R., Biesemans, M., Hallenga, K., Lippens, G., Malaisse-Lagae, F. and Malaisse, W.J. (1992) Dual anomeric specificity and dual anomerase activity of phosphorglucoisomerase quantified by two-dimensional phase sensitive 13C EXSY NMR. Journal of Biological Chemistry, 267, 210-217.
- Malaisse, W.J., Zhang, Y., Jijakli, H., Courtois, P. and Sener, A. (2004) Metabolism of D-glucose anomers in rat pancreatic islets exposed to equilibrated D-glucose. Hormone and Metabolic Research, 36, 281-285.
- Zhang, Y., Jijakli, H., Courtois, P., Sener, A. and Malaisse, W.J. (2005) Impaired enzyme-to-enzyme channelling between hexokinase isoenzyme(s) and phosphoglucoisomerase in rat pancreatic islets incubated at a low concentration of D-glucose. Cell Biochemistry and Function, 23, 15-21. doi.10.1002/cbf.1122
- Malaisse-Lagae, F. and Malaisse, W.J. (1987) Anomeric specificity of D-glucose phosphorylation and oxidation in human erythrocytes. International Journal of Biochemistry, 19, 733-736. doi.10.1016/0020-711X(87)90090-5
- Vanonderbergen, A., Sener, A. and Malaisse, W.J. (1998) Anomeric specificity of D-glucose phosphorylation in human erythrocyte homogenates. Diabetes Research, 33, 193- 200.
- Malaisse-Lagae, F. and Malaisse, W.J. (1986) Abnormal identification of the sweet taste of D-glucose anomers. Diabetologia, 29, 344-345. doi.10.1007/BF00452076
- Vanonderbergen, A., Sener, A. and Malaisse, W.J. (1997) Anomeric specificity of D-glucose phosphorylation in erythrocytes of diabetic subjects. Diabetes Research, 32, 183-188.
- Malaisse-Lagae, F., Sterling, I., Sener, A. and Malaisse, W.J. (1988) Anomeric specificity of D-glucose metabolism in human erythrocytes. Clinica et Chimica Acta, 173, 223-232. doi.10.1016/0009-8981(88)90327-0
- Malaisse, W.J., Malaisse-Lagae, F. and Sener, A. (1983) Anomeric specificity of hexose metabolism in pancreatic islets. Physiological Reviews, 63, 321-327.
- Malaisse-Lagae, F., Giroix, M.-H., Sener, A. and Malaisse, W.J. (1986) Temperature dependency of the anomeric specificity of yeast and bovine hexokinases. Biological Chemistry Hoppe-Seyler, 367, 411-416. doi.10.1515/bchm3.1986.367.1.411
- Inagaki, K., Miwa, I. and Okuda, J. (1982) Affinity purification and glucose specificity of aldose reductase from bovine lens. Archives of Biochemistry and Biophysics, 216, 337-344. doi.10.1016/0003-9861(82)90219-3
- Dufrane, S.P., Malaisse, W.J. and Sener, A. (1983) Aldose reductase activity in pancreatic islets. Diabetologia, 25, 152.