Open Journal of Preventive Medicine
Vol.05 No.11(2015), Article ID:61196,8 pages
10.4236/ojpm.2015.511049
Injury Induced Mortality in Iran from 2006 to 2010
Hossein Kazemeini1, Ardeshire Khosravi1, Seyed Jaber Mousavi2*, Aminda Amanolahi1, Saeede Aghamohammadi1
1Center for Health Network Management, Ministry of Health and Medical Education, Tehran, Iran
2Department of Community Medicine, Faculty of Medicine, Mazandaran University of Medical Sciences, Sari, Iran

Copyright © 2015 by authors and Scientific Research Publishing Inc.
This work is licensed under the Creative Commons Attribution International License (CC BY).
http://creativecommons.org/licenses/by/4.0/


Received 5 September 2015; accepted 15 November 2015; published 18 November 2015
ABSTRACT
Introduction: To adequately measure population health, a health information system is essential. The main rationale for collecting routine data on population health is to provide information and evidence for designing and assessing health programs and to ensure that their objectives are being met. Accidents are one of the most predictable issues that constitute a major social and economic burden amongst communities, particularly in developing countries such as Iran. Methods: Among the available data provided by health information system, data on mortality are commonly used not only as health indicators but also as socioeconomic development indices. In Iran, two organizations, the National Organization for Civil Registration (NOCR) and the Ministry of Health and Medical Education (MOH&ME) currently operate death registration systems. In this research, a cross-section of accident-cause of mortality data from the Ministry of Health and Medical Education in the year 2004 to 2010 was employed. Results: The highest rate of injury caused deaths was due to road traffic accidents in all these years and in both sexes. Traffic accidents were first in the ranking of unintentional accidents, the next ranking were burns, sudden intoxication with drugs and toxicants and fall in order. The proportion of deaths due to accidents in relation to the total number of deaths due to unintentional injuries was 69.9 in 2006, 66.3 in 2007, 66.3 in 2008, 68.2 in 2009 and 65.5 in 2010. Discussion: From 2006 to 2010, two thirds of injury-caused deaths were related to transport accidents. Although no significant changes are observable in 5 years, we can observe a gradual decrease in death. Conclusion: As we can see in this research, the first rank in injuries is related to road traffic accidents. This should be as a priority for various organizations and policy makers should find an appropriate and logical solution to resolve this problem.
Keywords:
Mortality, Iran, From 2006 to 2010

1. Introduction
To adequately measure population health, a health information system is essential [1] . The main rationale for collecting routine data on population health is to provide information and evidence for designing and assessing health programs and to ensure that their objectives are being met [2] [3] . Such data might also be used to generate or support observations about population health transition [2] . Among the available data generated by health information systems, data on mortality are the most commonly used, not only as indicators of health development, but also as broader measures of socioeconomic development. Most, if not all countries possess legislation for vital registration systems to collect mortality data to generate various summary measures of population health.
The cause of death data have been used as a tool for monitoring health promotion in the community and for determining health priorities for several years [1] . Injuries and accidents are one of the most predictable issues that constitute a major social and economic burden amongst communities, particularly in developing countries such as Iran [2] . More specifically however to Iran, only second to cardiovascular diseases, a major cause of death is related to injuries and poisoning. A study from 1979 to 2001 demonstrated that injuries have been the second cause of death in Iran following cardiovascular diseases. Between 1979 and 1986, death due to injuries has increased from 16.9 percent to 19.9 percent. There are many factors involved which may have contributed to this sudden rise, but more outstandingly is the war between Iran and Iraq. After war the death due to injuries decreased and then increased from 1997 to 1999. The reason for this increase in this period can be attributed to industrialization and increasing cars that are a strong factor for increasing deaths due to injuries. It seems that as the cause of death due to some injuries is not registered; the estimated number of death is less than the real one [1] . It is estimated that death caused by cancer, cardiovascular diseases and accidents will be 56 percent from 67 million deaths till 2030 [3] . In this research paper, accident-caused mortality was investigated between the time periods 2006 to 2010.
2. Methods
Among the available data provided by health information systems, data on mortality are commonly used not only as health indicators but also as socioeconomic development indices, health workers at each health facility are responsible for identifying deaths among the population. In this research, a cross-section of accident-cause of mortality in the year 2006 to 2010 was employed. Unintentional accidents were classified in 13 groups and 95 subgroups, while age groups were then classified in 6 groups.
Based on data flow of death registration systems in Iran, two organizations are producing data on mortality. The National Organization for Civil Registration (NOCR) is responsible for registration of birth, marriage, divorce and death .Based on this institutional mandate, the organization usually reports these four vital events. However, studies shows that data on mortality have not enough quality particularly information on causes of death. Hence, ministry of health and medical education (deputy for public health) lunched a system to report the causes of death by obtaining information from various sources at district level such as: NOCR, health houses, health centers and cemetery. Based on this system data on causes of death are collected and classified in detail ICD code.
In order to record the data in duplicate, variable control data is recorded with other data, inconsistent codes of group and age in years were amended.
The data are not full of information such as age and sex evaluated and the fact that these variables are important to analysis the empty cases identified and analysis by using redistribution was amended that was based on Global Burden of Disease study methods [4] .
As one of the most important steps in data analysis of the injury cause of death, it is to evaluate the quality of information. For this purpose, unlikely causes of injury and also ill-defined and garbage codes were reviewed and modified. In this study, population data by age and sex were obtained from Statistical Center of Iran (SCI) to calculate cause-specific-mortality rates from accidents. Accidents were categorized in 13 main groups and mortality rates were compared by age, sex and year.
3. Results
As shown in Table 1 and Table 2, the highest rate and number of injury caused deaths was due to vehicle and traffic accidents in all these years and in both sexes. The vehicle and traffic accidents caused death rate (number)

Table 1. Mortality rate (per 100,000) due to injuries by sex in all ages, Iran, 2006-2010.
Table 2. Number of deaths due to injuries by sex in all ages, Iran, 2006-2010.
in men from 2006 to 2010 was 74.352 (21,536), 61.899 (16,641), 57.861 (15,728), 58.533 (16,111) and 56.365 (15,730) per 100,000 people respectively. Vehicle and traffic accidents caused death rate (number) in women from 2006 to 2010 was 17.992 (5057), 15.317 (4009), 14.777 (3916), 14.915 (4008) and 13.913 (3795) per 100,000 people respectively Hence, the proportion of death due to vehicle and traffic accidents compare to other injury related causes are higher and also in men are higher than women.
The second injury cause of death in women was due to burn over these years. The second injury cause of death in men was due to sudden intoxication with drugs in 2006 and 2007 but in 2009 and 2010 was due to fall and in 2008 was due to mechanical forces. The least injury caused death in these years was due to Deprivation or overexertion in both sexes but in 2010 in women and 2009 in men the least injury caused death was due to exposure to animate mechanical forces.
The proportion of deaths due to accidents out of total number of deaths due to unintentional injuries was 69.9% in 2006, 66.3% in 2007, 66.3% in 2008, 68.2 in 2009 and 65.5% in 2010. As shown in Table 3, the highest proportion of deaths due to accidents was in 2006.
As shown in Table 4, we can see the comparison of number of deaths caused by accidents in five year age groups. The highest number is in age group 15 - 49 years with 17,421 in 2006, 13,313 in 2007, 12,608 in 2008, 12,766 in 2009 and 12,380 in 2010. The least number is in age group under 1 with 185 in 2006, 168 in 2007, 184 in 2008, 160 in 2009 and 176 in 2010. Table 5 shows the comparison of percent of deaths caused by accidents in five year age groups. The highest rate is in age group 50 - 69 with 75.2 percent in 2006, 71.2 percent in 2007, 72.3 percent in 2008, 74.1 percent in 2009 and 70.9 percent in 2010 and least rate in age group under 1 with 33.5 percent in 2006, 35.5 percent in 2007, 39.1 in 2008, 36.9 in 2009 and 39.9 percent in 2010.
Different Causes of Unintentional death in years 2006, 2007, 2008, 2009 and 2010 respectively and vehicle and traffic accidents deaths have the highest proportion in both sexes as shown in Figures 1-5.
Table 3. Number and Percentage of deaths due to traffic accidents, Iran, 2006-2010.
Table 4. Number of deaths due to traffic accidents by age groups, Iran, 2006-2010.
Table 5. Percentage of deaths due to traffic accidents by age groups, Iran, 2006-2010.
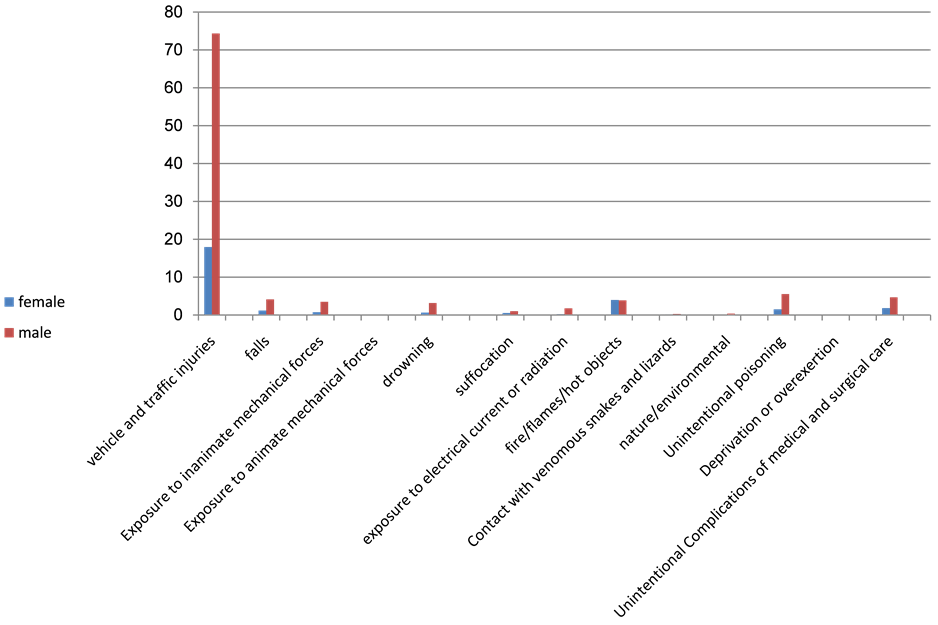
Figure 1. Mortality rate (per 100,000) due to unintentional injuries, Iran, 2006.
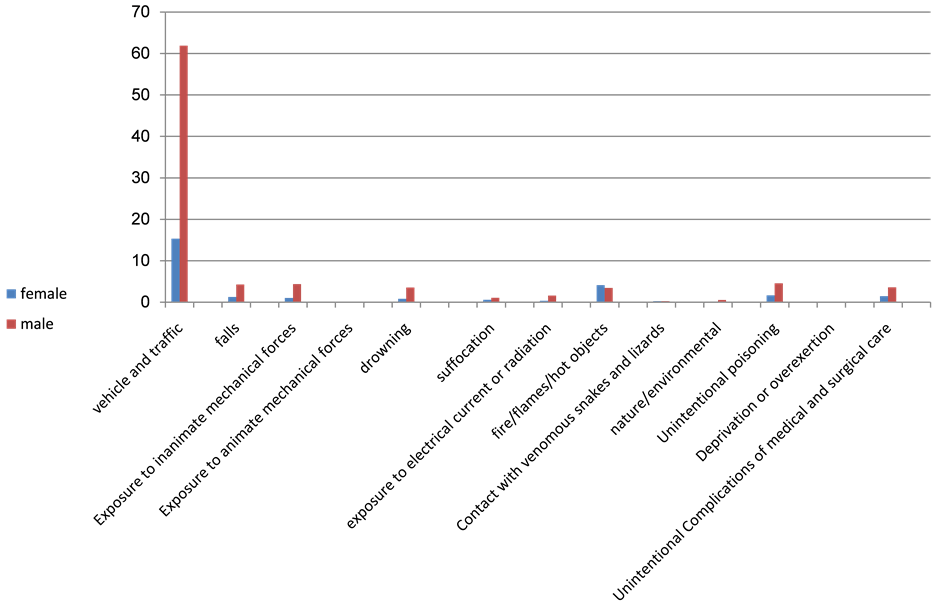
Figure 2. Mortality rate (per 100,000) due to unintentional injuries, Iran, 2007.
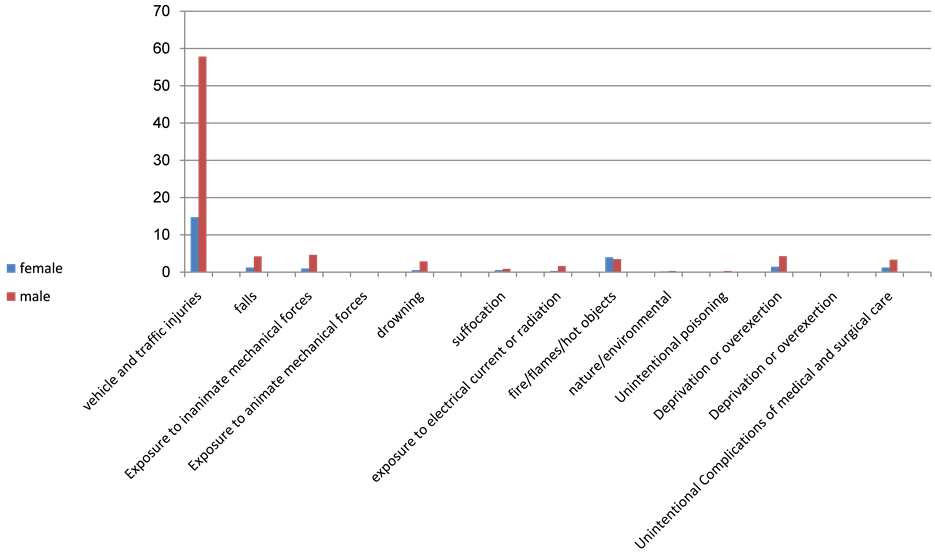
Figure 3. Mortality rate (per 100,000) due to unintentional injuries, Iran, 2008.
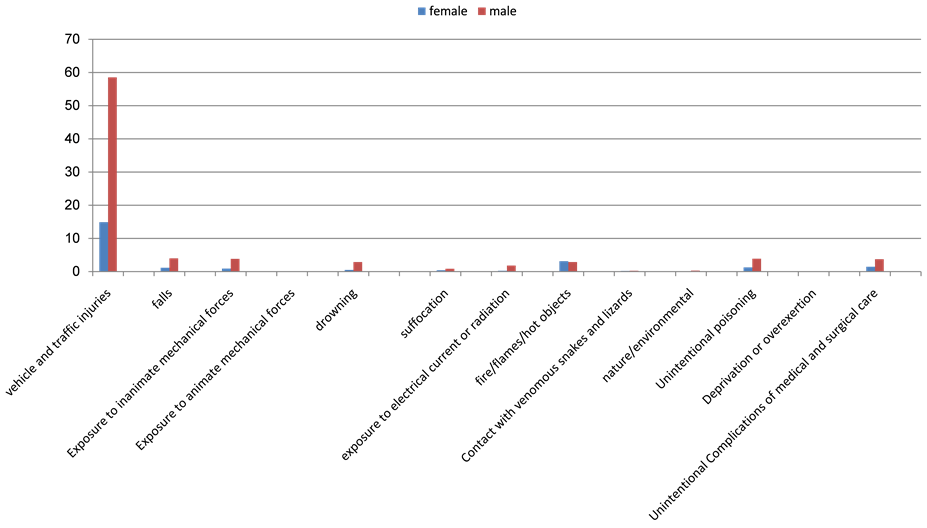
Figure 4. Mortality rate (per 100,000) due to unintentional injuries, Iran, 2009.
4. Discussion
This study provides comprehensive comparative estimates of injury caused deaths from 2006 to 2010 in the Islamic Republic of Iran. It showed that two thirds of injury-caused deaths are related to transport accidents. Although no significant changes are observable in 5 years, nonetheless we can observe a gradual decrease in
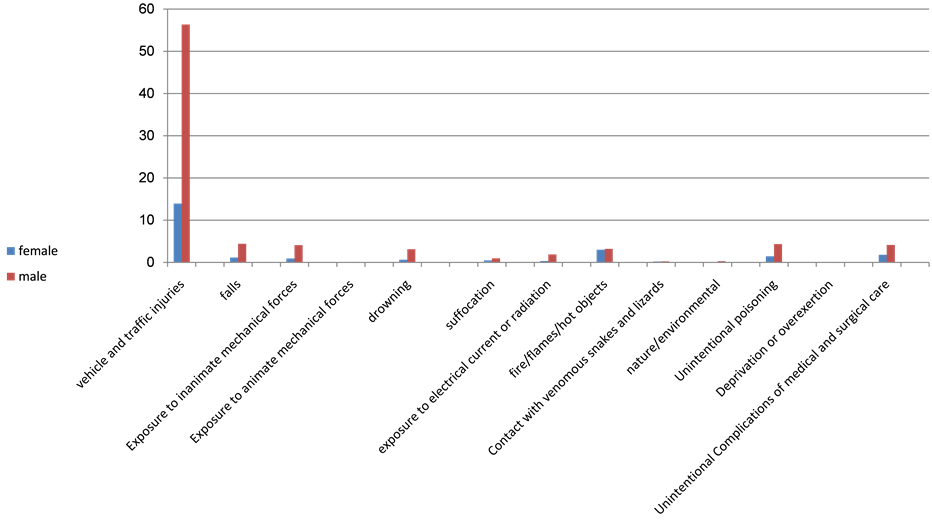
Figure 5. Mortality rate (per 100,000) due to unintentional injuries, Iran, 2010.
deaths. The most number of deaths in age groups are in age group 15 - 49 years in all of the years studied from 2006 to 2010. However, the highest per cent of injury-caused deaths are associated with the age group 50 - 69. According to a study conducted by Fanian, the highest rate of mortality was associated with the age group of 16 - 20 years [5] . Similarly, a study conducted by Sanaee-zadeh et al. found that in Tehran this rate was highest in the age group of 21 - 30 years [6] . A study carried out by Khademi observed that 47.2 percent of deaths involved individuals younger than 30 years of age [7] . This observation is similarly conveyed internationally such as in the US, where recent surveys suggest that young people experienced the highest mortality rate [8] . Similarly, a Nigerian study suggested that about 53 percent of traffic-injury deaths involved individuals less than 30 year of age [9] . A study in China suggests that the highest mortality rate was experienced among the 18 - 30 years age group [10] . In another survey the second highest cause of mortality in age group 15 - 60 was traffic accidents [11] . In 2005 transport accidents deaths in Iran were 30,721 cases which was the highest rate in the world. About 78 percent of total number of unintentional deaths was for men and 22 per cent for women. 19 percent of transport-injury deaths were related to women and 81 percent for men for the reason being that men in Iran are more involved in transportation affairs. Fanian’s survey indicated that 81.3 per cent of deaths were related to men and only 16.9 per cent to women, thus being compatible with our country survey [5] . Khademi’s survey attributed 73.4 per cent of traffic injuries deaths to men [7] . In WHO report in 2003, transport-accident deaths in men were 3 times more than women [5] . In this survey the first cause of injury-induced death was found to have been due to transportation. In US, transport accident death is the first cause of death in unintentional deaths and leads to 115 deaths daily. WHO declared that the victims of most accident deaths in America and Europe were drivers but in developing countries the highest rate were bicyclists and side walk pedestrians [12] . A 5-year survey in Iran demonstrated that the highest deaths are associated with drivers, thus demonstrating Iran’s similarities to other developed countries in this respect [13] . In our study, the highest rate of transport injury deaths involved people in vehicles. In Fanian et al., studies in the Isfahan province revealed that the highest rate was due to 16 - 20 age motor cyclists and the least was due to bicycle drivers [5] . In Khademi, a study revealed that 43.2 percent of deaths involved people in vehicles [7] . A study in Trinidad suggested that the highest rate of death involved pedestrians on side-walks [14] .
5. Conclusion
As we can see in this research, the first rank in injuries is related to transport accidents. Because of high deaths due to transport injuries and as long as young and active people are engaged in it, we should find an appropriate and logical solution to resolve this problem. It seems that car industries and other organizations should improve their quality standards and traffic problems in order to prevent deaths due to these accidents.
6. Ethical Considerations
Ethical issues including plagiarism, informed consent, misconduct, data fabrication and/or falsification, double publication and/or submission, redundancy, etc. have been completely observed by the authors.
Cite this paper
Hossein Kazemeini,Ardeshire Khosravi,Seyed Jaber Mousavi,Aminda Amanolahi,Saeede Aghamohammadi, (2015) Injury Induced Mortality in Iran from 2006 to 2010. Open Journal of Preventive Medicine,05,441-448. doi: 10.4236/ojpm.2015.511049
References
- 1. Yavari, P., Abdi, A.R. and Mehrabi, Y. (2003) Epidemiology of Death Causes and Its Change Trends from 1979 till 2001. Hakim Medical Journal, 6, 7-14.
- 2. Soltani, G.R., Ahmadi, B., Porreza, A. and Rahimi, A. (2009) An Epidemiological Study and Determination of Causes of Traffic Accident-Related Death in Yazd District in 2009. The Journal of Shahid Sadoughi University of Medical Sciences, 21, 831-839.
- 3. Amani, F., Kazem Nezhad, A., Habibi, R. and Haji Zadeh, R. (2010) Trend of Main Cause Mortality Changes in Iran from 1971 to 2009. Journal of Gorgan University of Medical Sciences, 12, 85-90.
- 4. Naghavi, M., Wang, H., Lozano, R., Davis, A., Liang, X., Zhou, M., Vollset, S.E. and Bohensky, M.A. (2015) Global, Regional, and National Age-Sex Specific All-Cause and Cause-Specific Mortality for 240 Causes of Death, 1990-2013: A Systematic Analysis for the Global Burden of Disease Study 2013. Lancet, 385, 117-171.
http://dx.doi.org/10.1016/S0140-6736(14)61682-2 - 5. Fanian, H., Ghadi Pasha, M., Ghodosi, A., Abedi, M.H., et al. (2007) Epidemiologic Study of Traffic Accidents in Isfahan Province in 2002 to 2003. Iranian Journal of Forensic Medicine, 13, 87-91.
- 6. Sanaei-Zadeh, H., Vahabi, R., Nazparvar, B. and Amoei, M. (2002) An Epidemiological Study and Determination of Causes of Traffic Accident-Related Death in Tehran, Iran (during 2000-2001). Journal of Clinical Forensic Medicine, 9, 74-77.
http://dx.doi.org/10.1054/jcfm.2002.0547 - 7. Khademi, A. and Moradi, S. (2009) Statistical Analysis of Traffic Accident Victims in the Beginning of 2008. Iranian Journal of Forensic Medicine, 28, 1-28.
- 8. Peden, M. and Toroyan, T. (2005) Counting Road Traffic Deaths and Injuries: Poor Data Should Not Detract from Doing Something. Annals of Emergency Medicine, 46, 158-160.
http://dx.doi.org/10.1016/j.annemergmed.2005.04.017 - 9. Seleye-Fubara, D. and Ekere, A.U. (2003) Pedestrian Deaths Resulting from Road Traffic Accidents Seen at University of Port Harcourt Teaching Hospital: Six Year Review. Nigerian Journal of Medicine, 12, 103-105.
- 10. Zhou, J.H., Zhao, X.C., Wang, Z.G., Zhu, P.F., Jian, H.G., Liu, D.W., Zhou, J.L. and Lin, L. (2003) The Analysis of Epidemiological Characteristics of Road Traffic Crashes in a Mountain City in Western China. Chinese Journal of Traumatology, 6, 355-358.
- 11. Mohan, D. (2008) Road Traffic Injuries: A Stocktaking. Best Practice & Research Clinical Rheumatology, 22, 725-739.
http://dx.doi.org/10.1016/j.berh.2008.05.004 - 12. Kapp, C. (2003) WHO Acts on Road Safety to Reverse Accident Trends. Lancet, 362, 1125.
http://dx.doi.org/10.1016/S0140-6736(03)14501-1 - 13. Bhalla, K., Naghavi, M., Shahraz, S., Bartels, D. and Murray, C.J. (2009) Building National Estimates of the Burden of Road Traffic Injuries in Developing Countries from all Available Data Sources: Iran. Injury Prevention, 15, 150-156.
http://dx.doi.org/10.1136/ip.2008.020826 - 14. Bernard, S.T. and Matthews, W.A. (2003) Contemporary Analysis of Road Traffic Crashes, Fatalities and Injuries in Trinidad and Tobago. Injury Control and Safety Promotion, 10, 21-27.
http://dx.doi.org/10.1076/icsp.10.1.21.14104
NOTES

*Corresponding author.