Open Journal of Physical Chemistry
Vol.3 No.1(2013), Article ID:27877,6 pages DOI:10.4236/ojpc.2013.31001
Effect of Surfactant Concentration on Aqueous LiBr Solution Absorption Rate
College of Engineering and Technology, AUM—American University of the Middle East, Egaila, Kuwait
Email: elsafty@hotmail.com
Received October 4, 2012; revised November 6, 2012; accepted December 8, 2012
Keywords: Absorption; Surfactant; Electrolyte Conductivity; Binary Solutions
ABSTRACT
It is well known that small amounts of surfactants, such as 1-Octanol, in the aqueous solution can increase the absorption rate significantly. In this paper, experimental data were obtained for absorption of water vapour into an aqueous LiBr solution with different concentrations of 1-Octanol. An experimental rig was specifically designed and developed in this work in order to investigate the effect of surfactant (1-Octanol) on the enhancement of the heat and mass transfer in the absorption process, in addition to, the investigation of the impact of the use of magnetic stirrer inside the absorber. The experimental rig for this study was based on the refrigeration mode of the intermittent vapour absorption system. In order to study the heat and mass transfer in water-lithium bromide vapour absorption air conditioning systems, it was necessary to monitor the concentration of the solution continuously. As a consequence, two procedures for obtaining the LiBr solution concentration were used. The first method was based on the measurement of the density and temperature of the solution, while the second was based on its electrolyte conductivity and the temperature. The experimental results showed that the surfactant concentration has a significant effect on the absorption rate; this is called the Marangoni instability. It has been concluded that, in order to clarify the absorption enhancement phenomenon, it is necessary to understand the physicochemical aspects of the absorption process and the effect of surfactants on the enhancement of such process. Additionally, it has been concluded that new approaches are needed to explain the observed behaviour.
1. Introduction
From the beginning of the 19th century, absorption cooling systems attracted increasing interest, since it is possible to recover energy by using waste heat and thermal solar energy with these systems for cooling applications. Absorption chillers differ from the more prevalent compression chillers in the way that the cooling effect is driven by heat energy rather than mechanical energy. Vapour absorption systems have been less popular than vapour compression systems because of higher cost and lower efficiency.
It is well known that the vapour absorption rate into the absorbent solution is the key process to improve the thermal coefficient of performance (COP) of vapour absorption air conditioning systems. The enhancement of the absorption process leads to reducing the heat exchanger size of the absorber.
For the continuous control of any absorption system, it is important to monitor the properties of the binary solution at different points in the cycle and under different refrigeration loads.
Various techniques are available to measure the concentration of the binary water/lithium bromide solution. The most commonly used method is the titration method [1], which can give a high accuracy when the procedure is performed by an experienced and careful researcher. The drawback of this method is that it tends to be time consuming, as it requires drawing a sample from the system solution.
The continuous measurement of concentration using radioactive tracer detectors or mass spectrometers is very expensive [2].
This study describes an accurate procedure for obtaining the concentration of the aqueous lithium bromide solution based on the measurement of electrolyte conductivity.
The study also presents an experimental investigation to study the effect of the surfactant concentration on the absorption rate.
2. Measurement Techniques
The working ranges for vapour absorption systems based on water/lithium bromide are (40% - 65%) for the concentration of the lithium bromide in the binary solution and (20˚C - 100˚C) for the temperature of the solution. These are the ranges investigated in this study. The concentration samples of the binary solutions are prepared in a glass beaker and immersed in a constant temperature water bath. A commercially available conductivity meter with a built-in temperature probe is then used to measure the density and conductivity of the solution [3].
2.1. Sample Preparation
Lithium Bromide is a white cubic crystal or crystalline powder. It is apt to decompose in the moist air, dissolve into water, alcohol or glycol, and able to dissolve into ether or pentanol to become colourless aqueous solution or pale yellow transparent liquid.
As the lithium bromide is extremely hygroscopic [4], it is important to follow a working procedure to ensure that no moisture from the atmosphere is absorbed unintentionally when preparing the measuring sample. The samples were prepared from a pure dry lithium bromide powder and deionised water. A digital mass balance was used to measure the masses of the lithium bromide and the deionised water before mixing.
2.2. Temperature Measurement and Control
The reaction of the lithium bromide powder and water is exothermic; this produces a significant rise in the temperature of the solution (20˚C to 60˚C). The temperature of the solution was controlled by a thermostatically regulated water bath to the desired value [3].
The temperature of the solution was measured using the conductivity meter with the built-in temperature probe.
2.3. Conductivity Measurement
For a cell of a uniform cross section (A), with electrodes at either end separated by distance (l), the conductivity (K) is related to the conductance (G), by Equation (1) and has the units Micro-Siemens (W−1∙m−1 or Sm−1) [5].
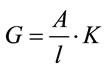 (1)
(1)
2.4. Apparatus
In principal, the measurement of the conductivity could be carried out in a cell, with rectangular electrodes of known area A m2 positioned l m apart. However, in practice a number of complicated corrections would have to be made for getting the exact value of the conductivity. Rather than doing this for all measurements, use is now made of definitive conductivity measurements for certain standard solutions carried out under very carefully controlled conditions in specially designed cells.
An extensive and thorough survey of the market led the author to conclude that Omega bench-top CDB-420 conductivity-meters were the most suitable. Conductivity span ranges from 0 to 19.99 S with resolution 0.01 S and accuracy ±0.5%, the temperature range is −10˚C to 105˚C with accuracy ±0.5˚C. It is also concluded that the epoxy conductivity cell model CDE-430-10-EP with constant (K = 10) and built-in temperature probe is the most suitable probe to link with the conductivity meter.
2.5. Calibration
A sample of known electrolyte conductivity (e.g. 0.745 g/litre Potassium Chloride solution) has been used to calibrate the instrument. Dissolving 0.745 grams of dried Analar Grade Potassium Chloride (KCl) into 1 litre of deionised water. The solution has been placed into a water bath set to 25˚C. When the temperature of the calibration standard solution has reached steady state, the electrode has been placed in the solution and left for 5 - 10 minutes. The range of 0 - 2000 m Siemens on the conductivity meter has been selected, and then the instrument reading has been adjusted to 1413 m Siemens.
3. Data Correlation and Empirical Modelling
The experimental data presented in Table 1 shows that for a constant concentration, the conductivity (m Siemens) decreases with temperature (˚C) for concentrations up to 55% LiBr. For concentrations higher than 55%, the conductivity increases as the temperature increases.
In order to develop an empirical model of the concentration as a function of temperature and conductivity of the aqueous lithium bromide solution, numerical curve fits have been produced for the experimental points of conductivity versus temperature at particular concentrations. The best-fit equations are logarithmic of the form
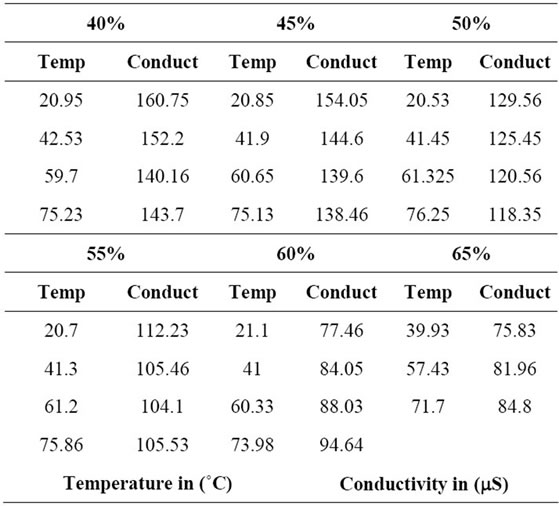
Table 1. Electrolyte Conductivity for different concentrations.
given by Equation (2).
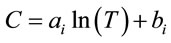 (2)
(2)
The values of the constants ai and bi are given in Table 2 for different concentration Xi%.
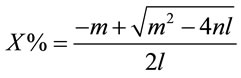
An equation is then constructed using the above results and equation to produce a relationship giving the concentration of the lithium bromide solution {X%} as a function of temperature {T, ˚C} and electrolyte conductivity {C, mS}. This is presented in Equations (3)-(6).
 (3)
(3)
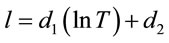 (4)
(4)
 (5)
(5)
 (6)
(6)
where d1 = 409.66, d2 = −1677.2, d3 = −297.03, d4 = 942.01, d5 = 37.673, d6 = 103.56.
Figure 1 presents the experimental data of electrolyte conductivity of the aqueous lithium bromide versus the temperature. These experimental data agree with the trends presented by Hamann et al., 1998 [5]. However, at higher concentrations, the conductivity rises less rapidly than expected from the extrapolation of the results; this is due to the increase of the inter-ionic interactions as the mean distance between ions decreases.
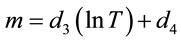
4. Experimental Test Rig
The general arrangement of the experimental apparatus used in the present study is shown in Figure 2.
The measurements of various parameters were taken in different positions of the test rig. The variables measured and controlled during the operation of the system were the temperature, pressure and concentration. Concentration was measured using Electrolyte Conductivity-Temperature technique.
4.1. Working Fluids
4.1.1. Absorbent Solution
An aqueous solution of lithium bromide containing about 61% lithium bromide is used initially as an absorbent. The working solution was prepared from pure dry lithium bromide powder 99.9% “Sigma-Aldrich product” and pure deionised water.
A digital mass balance was used to measure the masses of the lithium bromide and the deionised water before mixing. As the reaction of the water and the powder is exothermic, a binary solution of 61% (LiBr-Water) was prepared and left to cool to the ambient temperature.
4.1.2. 1-Octanol
1-Octanol is used in the experimental investigation for this work. The product was bought from “Sigma Aldrich Co. Ltd.”. The Molecular formula for the 1-Octanol is: C8H18O. This product is also known as Capryl alcohol, n-Octyl alcohol, Heptyl carbinol or 1-Hydroxyoctane. It has the following identifications and properties:
Molecular weight: 130.23 Appearance: Clear, colourless liquid.
Solubility: Slightly soluble, 540 mg/L soluble in water Boiling point: 195˚C.
Melting point: −16˚C

Table 2. Constants ai and bi for Equation (2).

Figure 1. Water/Lithium bromide temperature vs. conductivity for different concentrations.
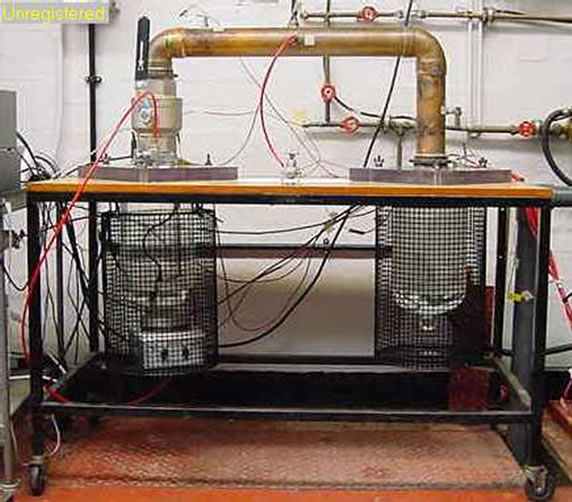
Figure 2. Measurement and control diagram of the test rig.
Specific gravity: 4.5 g/L Flash point: 81˚C.
4.1.3. Refrigerant
Pure de-ionised water was used as the refrigerant in the evaporator vessel.
5. Purpose of the Experiment
The processes in a LiBr absorber are coupled heat and mass transfer processes. As the water vapour is absorbed into the liquid, the latent heat associated with the phase change is released along with the heat mixing. This energy release occurs at the vapour-liquid interface and causes the interface to be the location of highest temperature in the system. To allow the process to continue, the energy must diffuse into the bulk of the liquid. These two diffusion processes are coupled in the sense that stopping either process causes system variables to adjust in such a way as to stop the other process. For the overall transfer to take place, both processes have to proceed in tandem.
In the case of the absorber, the mass transfer process controls the coupled transfer. Thus, design efforts to improve overall absorber performance is focused on the mass transfer process [2]. Several additives have been tested in the literature. Cul et al., (1991) tested the impact of several additives in the absorption. 2-ethyl-hexanol, n-Octanol such as 1-Octanol and 2-Octanol, decanol, 1- heptanol, soluble alcohol as 2-methyl-2propanol, fluorinated surfactant such as FC-430, and Ion extraction such as 15-crown 5 have been tested. The results showed that the 1-Octanol has the best mass of water vapour absorbed during a 15 minutes run by Lithium bromide solution of initial concentration of 60%. 1-Octanol has been found to improve the absorber performance.
Experiments were performed by changing the number of droplets of 1-Octanol, consequently the distance between the droplets. This in turn leads to the change of the aspect ratio given by the ration of absorbent solution depth to the distance between the additive droplets.
Figure 3 shows the different additives positions of the additive droplets. The additive droplets were located using specially designed disc (180 mm diameter) with number of holes to allow the additives to be in the desired positions as shown in the figure. The 1-Octanol droplets were positioned on the surface of the aqueous lithium bromide solution using a very fine pipette.
6. Experiment Designations
Primary concerns of avoiding the contamination from experiment to experiment were taken into accounts while designing the test rig and the testing technique, since the minute amount of additives residue can greatly influence the absorption rate [6]. These concerns resulted in carrying out a number of modifications on the test rig so that it can be easily assembled and cleaned after each experiment.
Extreme care is taken to ensure that the same initial conditions apply for each experiment. Parameters involved are initial temperature, pressure and the concentration of the aqueous lithium bromide solution.
The experimental procedure focused on generating the same amount of water vapour by keeping the water temperature constant during the run of the experiments.
Table 3 shows the experiments designations and the experimental arrangements of the study.
7. Experimental Results
Figure 4 shows the variations in the simple mode designation of operation, without the use of surfactant additives. The figure also shows the variations of the effect of the number of droplets of 1-Octanol on the calculated values of concentration change rate in (hr−1). It is clear from the figure that the enhancement of the absorption process increases with the increase of the number of the droplets up to a certain number of droplets, in this case four droplets.
The addition of more droplets, beyond four results in a drop in the enhancement process. Increasing the additives to “16 droplets” results in the cessation of the absorption process.
8. Discussion of the Results
In the bulk of a liquid, molecules are subject to intermolecular forces, which averaged over time are symmetrical and have no net effect. At an interface where two phases meet, an imbalance of intermolecular forces arises be
Figure 3. Experimental test designations.
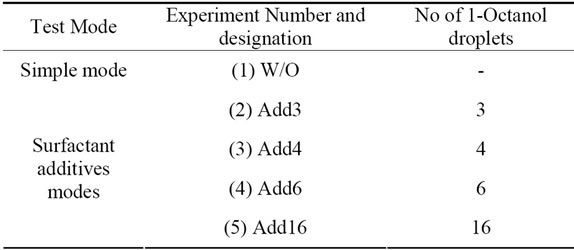
Table 3. Experiments designations and enhancement technique.
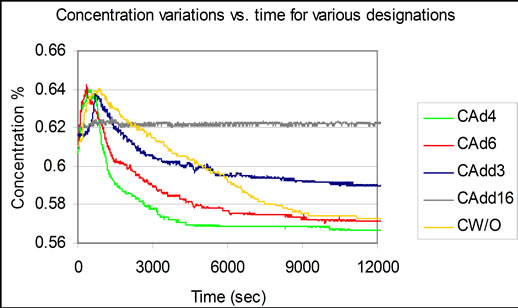
Figure 4. Concentration variation vs. time for various experimental designations.
cause of differences in the molecular structure of the respective phases. For example, at the water vapour/LiBr solution interface the liquid-liquid attractive forces are far stronger than either the vapour-vapour or the vapourliquid attractions. Therefore at the vapour-liquid interface the surface molecules are pulled into the bulk of the liquid. Consequently, the surface layer of the lithium bromide aqueous solution is behaving like an elastic membrane under tensions (surface tension). When a surfactant is added to the binary solution interface, it replaces the water molecules at the fluid surface, with its hydrophobic head groups, lowering the imbalance in the intermolecular forces and thus reducing the surface tension but the effect of the surfactant depends on the surfactant concentration.
8.1. Low Surfactant Concentration
The presence of one solute may affect the solubility of another [7]; this is called the salt-out effect. The saltingout effect is the reduction of the solubility of a substance into water when another salt is added. This is because the solubility of LiBr into water (62% at 35˚C = 1630 g/L) is much greater than the solubility of 1-Octanol (540 × 10−3 g/L) in water. When three droplets of 1-Octanol are added to the aqueous lithium bromide solution, no enhancement has been observed. This is due to the fact that the solution is not saturated. The small amount of additives will dissolve in the solution. No 1-Octanol will be on the surface, causing no enhancement to the absorption process.
If some of the surfactant molecules are dissolved in the solution, while the other molecules are adsorbed on the surface, according to Kashwagi’s hypothesis [8,9] the droplets were not in a mirror position to cause the Marangoni effect. As it requires the droplets to be facing each others, this is to cause the formation of overturning cells of convection.
8.2. Medium Surfactant Concentration
When 1-Octanol is added to the aqueous lithium bromide solution, the surfactant will dissolve in the solution until the solution becomes saturated, in other words reaches its solubility limits. Adding more surfactant, results in water tending to bind with the lithium bromide instead of the surfactant molecules because of the higher solubility of LiBr in water. Consequently, some surfactant molecules will not be dissolved in the solution and are segregated to the surface of the solution. The hydrophilic groups of the segregated surfactants are then adsorbed on the solution surface, thus decreasing the surface tension of the solution, while the hydrophobic group tends to be in the vapour volume. Surfactants will tend to gather together and aggregate into droplets on the surface of the solution. The aggregation of the hydrophobic chains of surfactant molecules (head groups) with each other in the aqueous solution is to avoid the contact with water after their adsorption in the surface.
8.3. High Surfactant Concentration
Adding more surfactant will tend to decrease the absorption rate due to the following:
The short distance between the surfactant molecules helps the aggregation process. Aggregation of two or three molecules of surfactant is not enough to cut off the contact of hydrophobic groups with water molecules. So Several tens of molecules (or even more) gather together and form the accumulation. The solution will act as a solution covered with surfactants.
1) Most of the surfactant molecule will pack together causing blockage to the surface of the aqueous lithium bromide solution towards the water vapour. Water vapour will be impeded to diffuse through the surfactant layer.
2) The local change of temperature during the absorption process at the surface can lead to a negative surface tension gradient (critical temperature difference is reached) which stabilises the liquid motion, and consequently, hinder the heat and mass transfer through the surface [10].
9. Conclusions
The results of conducted experiments for the absorption process and the enhancement of mass transfer were discussed. Comparing the achieved results for each designation, the following conclusion can be drawn:
• Marangoni instability can be reasonably explained by the physical chemistry theories such as the salting– out effect and the spreading effect.
• Surfactant concentration and the solubility of the aqueous LiBr solution control the enhancement of the absorption process in the following order:
○ The low surfactant concentration has no effect in the absorption process enhancement.
○ The medium surfactant concentration enhances the absorption rate by increasing the Marangoni convection.
High surfactant concentration reduces the absorption rate. As the surfactants aggregates on the surface and impedes the water vapour to reach to the LiBr-solution surface. In addition to the high temperature gradient which will stop the Marangoni instability.
REFERENCES
- K. E. Herold, R. Raermacher and S. A. Klein, “Absorption Chillers and Heat Pumps,” CRC Press, New York, 1996.
- R. K. Horn, “Determination of Concentration in LithiumBromide Refrigeration Cycles by Measurement of the Electrolytic Conductivity or Density,” Progress in Refrigeration Science Technology: Proceedings of International Congress Refrigeration, Vol. 2, 1969, pp. 317-328.
- A. F. Elsafty, R. Al-Samarraie and A. J. Al-Daini, “Concentration Measurement in Aqueous Lithium-Bromide Solution,” World Renewable Energy Congress, Brighton, 2000.
- D. R. Lide and Kehiaian, “CRC Handbook of Thermophysical and Thermochemical Data,” CRC Press, Boca Raton, 1994.
- C. H. Hamann, A. Hamnett and W. Vielstich, “Electrochemistry,” Wiley-Vch., Weinheim, 1998, pp. 13-65.
- W. Del Cul, J. Braunstein, R. H. Reiner and H. PerezBlanco, “Experimental Study of The Effect of Additives on Mass Transfer to an Aqueous Solution of Lithium Bromide,” National Heat Transfer Conference Minneapolis, American Society of Mechanical Engineers, 1991, pp. 1-6.
- P. W. Atkins, “Physical Chemistry,” Oxford University Press, Oxford, 1990.
- D.-H. Rie and T. Kashiwagi, “Computer Simulation of Vapour-Absorption Enhancement into H20/LiBr Absorbent by Marangoni Convection,” International Journal of Japan Society Mechanical Engineering, Vol. 34, No. 3, 1991, pp. 355-361.
- D.-H. Rie and T. Kashiwagi, “Experimental Study of Steam Absorption Enhancement in Accordance With Interfacial Turbulence into Aqueous Solution of LiBr (The Influence of Non-Condensable Gas,” International Journal of Japan Society Mechanical Engineering, Vol. 34, No. 4, 1991, pp. 502-508.
- C. Kren, H. M. Hellman and F. Ziegler, “Dynamic Surface Tension of LiBr-Solutions with Higher Alcohols as Heat-Transfer-Additives,” International Sorption Heat Pump Conference, Munich, 1999, pp. 375-380.