Geomaterials
Vol.4 No.2(2014), Article ID:44664,9 pages DOI:10.4236/gm.2014.42006
The Study of Electromagnetic Stress Testing Method on Oil-Gas Pipelines Based on WT
Bin Liu, Wanru Sun, Yiren Lin
School of Information Science and Engineering, Shenyang University of Technology, Shenyang, China
Email: syuotwenwu@sina.com
Copyright © 2014 by authors and Scientific Research Publishing Inc.
This work is licensed under the Creative Commons Attribution International License (CC BY).
http://creativecommons.org/licenses/by/4.0/


Received 28 October 2013; revised 28 January 2014; accepted 7 February 2014
Abstract
This paper proposes an effective method for early diagnosis (stress concentrating) of the oil-gas pipeline. Based on the principle of electromagnetic induction Faraday, we have designed and realized the nondestructive testing system for stress concentration area of ferromagnetic materials by means of the research of metal materials inverse magnetostrictive effect mechanism. The system changes the influence degree of the stress in ferromagnetic materials’ magnetic conductance to the corresponding voltage array by using discrete wavelet analysis method to process the data, in which not only the measuring accuracy is improved, but also the stress concentration is more directly reflected. The experiments confirm that the electromagnetic stress testing method is feasible and valid.
Keywords:Oil-Gas Pipeline, Electromagnetic Induction, Magnetic Conductance, Stress Concentration, Nondestructive Testing

1. Introduction
To our country national economy, oil and gas pipeline transportation called the “energy blood” which is one of the five major transportation industries in China plays a very important role. With the growth of service time, ferromagnetic oil and gas pipelines will be the formation of a variety of fatigue damages and defects caused by stress concentration due to corrosion, abrasion, welding and other reasons. If not repaired in time, it will eventually lead to the accident of pipeline leakage. Pipeline inspection technology can obtain the position of the pipeline damage, type, degree and other precise information, so as to provide reliable basis for pipeline safety evaluation, life prediction and maintenance, etc. [1] [2] . Although traditional nondestructive testing (NDT) methods (such as ultrasonic, magnetic, eddy current and magnetic flux leakage and penetration, etc.) can find what has been forming macro or most microscopic defects by testing one hundred percent related parts of equipment and components, but for the early damage of metal components, especially in not yet forming contact discontinuity changing area, it is difficult to implement effective evaluation. As a result, it is unable to avoid sudden accident caused by fatigue damage after repair. Early hidden trouble of pipeline can be found timely by the effective stress method, so it plays an important role in the reduction of oil and gas pipeline maintenance of human and financial resources [3] [4] .
At present, there are many stress concentration area detecting methods, such as the blind-hole method, ultrasonic method, X-ray diffraction, electronic shearing speckle interferometry, metal magnetic memory method, etc. The blind-hole method is adopted in the measured component drilling a certain diameter and depth of the blind hole using borehole stress release point, to make the tested parts produced the corresponding displacement and deformation, and to obtain the residual measured components of measurement points of stress by measuring the strain or displacement. Although the measuring sensitivity is higher, there are not only many interference factors, but also it is a lossy detection method, so it is limited in the practical application [5] [6] . Ultrasonic method is based on acoustic elasticity theory, using the ultrasonic sound travels in material internal stress caused by the birefringence effect of stress measurement. This method has larger detection depth and applicable materials are more, but if the sound velocity variation compensation is improper, measurements are in big error. Besides, ultrasonic method has a high requirement for the coupling of the probe and the workpiece surface shape, which is restricted in practical applications [7] [8] . X-ray diffraction method is widely used and the principle is to measure the lattice distortion caused by residual stress, then figures out the residual stresses in the measured point according to elastic mechanics theory. The method can be adapted to all kinds of materials and different shapes, sizes of workpiece, but there is a strict requirement to the surface of the measured object that the measurement of internal stress must be delaminated, which for large workpiece is difficult and the detection of equipment structure is more complex, therefore it is not suitable for field application [9] . Electronic shearing speckle interferometry is suitable for the defective or stress of the material and its surface deformation will occur, then interference fringe pattern will be accordingly changed. By measuring the change of the interference fringes can figure out the stress and strain distribution of materials. As with the X-ray diffraction method, this method can only be applied to measuring stress conditions on the surface of the material and is generally more suitable for the laboratory measurements. Metal magnetic memory method is in the magnetic environment, measuring magnetic flux leakage signals caused by stress. The method is more affected by outside factors and the measurement of environmental requirements is extremely high, which brings great limitations to the application [10] [11] .
The engineering practice proved that the electromagnetic stress testing as a pipeline of an efficient method for stress detection has been applied to the pipeline on the residual stress, deformation stress and weld stress measurements successfully. It unveiled a new chapter for oil and gas pipeline safety testing.
2. Principles
The ferromagnetic material will produce magnetization and the permeability or magnetic resistance will change along with the changes of stress and strain state under the effect of magnetic field. Electromagnetic stress testing system on the basis of this phenomenon uses magnetic domain model to realize it. Figure 1 is the magnetic domain structure of the materials.
Without external magnetic field, due to the randomness of the magnetic domain orientation, the substance does not appear in the macro magnetic effect. The magnetization for material M:
 (1)
(1)
In the formula,  denotes the magnetic dipole moment for the macro small volume element
 ![]() in the
in the  magnetic dipole; n is the number of the magnetic dipole;
  is
is ![]() all contained within the magnetic dipole vector and magnetic dipole moment.
all contained within the magnetic dipole vector and magnetic dipole moment.
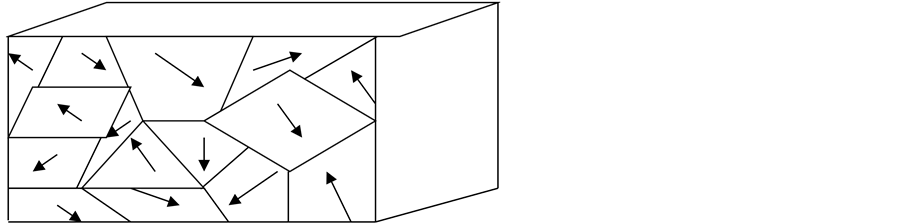
Figure 1. Magnetic domain structure.
For the permanent magnet, the relationship between magnetization M and plus magnetic field H:
 (2)
(2)
In the formula,  denotes magnetic susceptibility, but because of the stress, deformation magnetic domain structure changes, namely
 ![]() changes and magnetization M and H are also changed. The stress concentration can be judged by measuring the change of H value.
changes and magnetization M and H are also changed. The stress concentration can be judged by measuring the change of H value.
3. Software and Hardware Design
High frequency magnetic stress testing system is mainly composed of signal generating system, sensor system, amplifier circuit, filter circuit, data acquisition system and data processing system. The system structure is shown in Figure 2. The AC signal with 1000 Hz frequency and amplitude by the signal generating system is amplified by power amplifier, and then it is inputted into the excitation coil sensor to produce alternating magnetic field. According to the principle of electromagnetic induction, alternating magnetic field can generate induced voltage in the test coil, which will be into the PCI-1716 data acquisition card after smoothing and amplification. Finally, the voltage signal dates after fitting analysis will be used to determine the stress concentration, and detecting depth is 3 mm.
3.1. Stress Measurement
The electromagnetic stress measurement unit is made up of mainly signal generating system and sensor system.
3.1.1. Design of Signal Generating Circuit
Oil pipeline testing environment is complicated, and signal generating circuits, which are designed by using Microprogrammed Control Unit (MCU) are flexible and easy to carry. Moreover it makes the testing limits further reduced. As shown in Figure 3, 89C52 single-chip microcomputer as the core is used to control DAC0832 and generate sine waves with different frequencies. The conversion time of the DAC0832 is 1, the working Voltage is +5v - +15v, and it is mainly composed of two eight registers and an 8 bit D/A converter. Because the DAC0832 D/A is the current output type, the current has a maximum value when the input for all 1, namely Iout1 outputs maximum current. The sum of the output current of Iout1 and Iout2 is a constant, at about 330 microamp. Iout1 current signal needs to be transformed into voltage signal according with the testing system. The DAC0832 port 9 as the feedback resistor terminal inside the chip and the Iout1 are connected with a 15K ohm. Therefore, using this resistance as the feedback resistance of OP07 operational amplifier, Iout1 is connected directly to the inverted input of OP07, then the transition of the current to the voltage is achieved.
3.1.2. The Design of the Sensor
Figure 4 is a sensor structure, on a u-shaped ferrite with two sets of coil, a set of coil was used as the excitation coil and the other set was the testing coil. Sine signal with certain frequency and amplitude on the excitation coil, so that the sensor and the steel plate will form a magnetic loop, the total magnetic resistance for the loop:
 (3)
(3)
In the formula,  is the magnetic resistance of ferrite core;
  is the magnetic resistance of the steel plate to be tested.

Figure 2. Electromagnetic stress testing system.
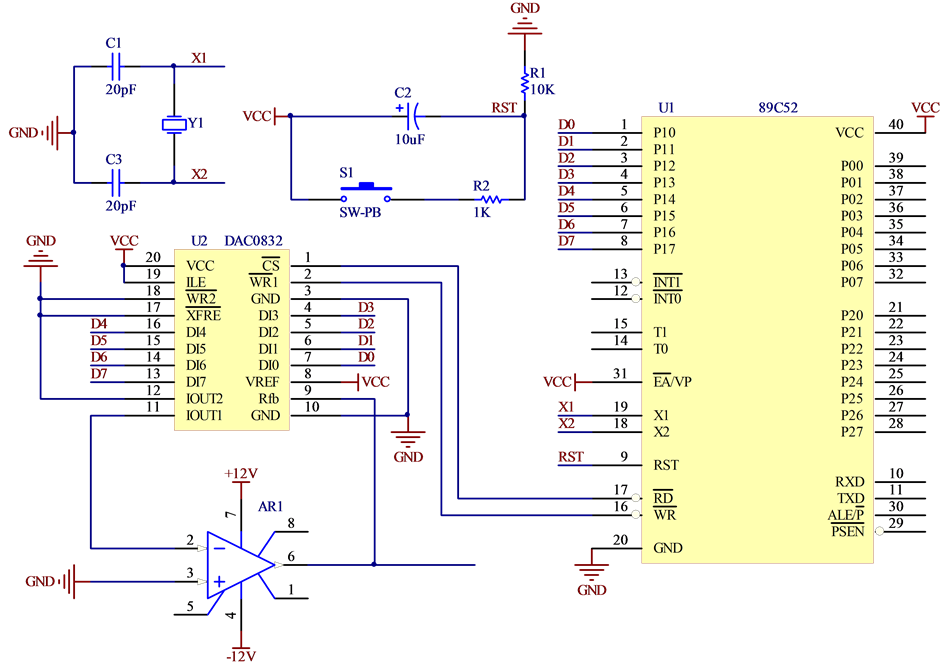
Figure 3. Principle diagram of sine wave signal generating circuit.
When the excitation coil provides constant magnetomotive force, the tested steel magnetic resistance  will be changed due to the change of the magnetic flux caused by the defects or stress concentration. At this time, the changes of the induced electromotive force of the testing coil will be converted into output voltage signal, thus it realizes the stress measurement.
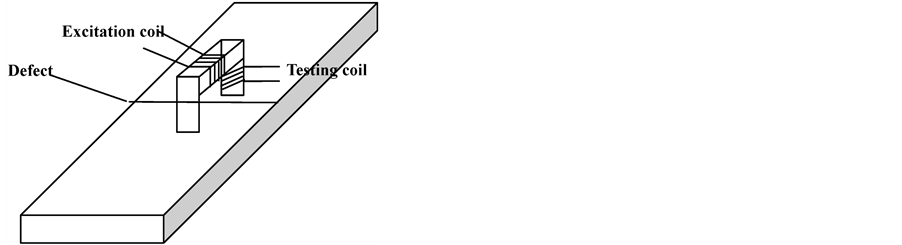
Figure 4. Sensor structure.
3.2. Data Acquisition
The main function of the testing system is to convert the sensor output signal and other analog signal measured into the digital signal. The most basic requirement of data acquisition is to meet the sampling theorem (Nyquist theorem) that the signal sampling rate is at least twice the highest frequency, in this way distortion signal will not appear when reducing signal. In the actual project, sampling frequency of signal is often set to 5 - 10 times of the highest signal frequency.
3.2.1. The Design of Filter Circuit
In the actual stress measurement, system will be subjected to various disturbances inevitably, including external signal and the circuit itself. Therefore, the signal is filtered before the acquisition. Figure 5 is a state variable filter circuit, it is more complex than the ordinary voltage controlled voltage source (VCVS) filter circuit, but its stability has been greatly improved. The U1, U2, U3 is a low noise, the chopper stabilizing zero bipolar integrated circuit operational amplifiers. Offset voltage is 0.5 μV/˚C, bias current of 1.8 nA, and power supply voltage range is ±3 to ±22 V, conversion rate of 0.17 V/μs , and gain bandwidth product is as high as 0.6 MHz; ,
,  and
and  are programming resistor resistance of filter circuit, which
  determines the center frequency,
  and
and  together determine the
  value and the passband center gain. The calculation formula is as follows:
 (4)
(4)
![]() (5)
(5)
 (6)
(6)
In the formula,  is band-pass filter center frequency,
  is band-pass filter passband gain and
  is the quality factor of bandpass filter, namely the ratio of voltage magnification to passband magnification ratio when
 , for bandpass filter,
  is the ratio of the bandwidth to
 . Simply changing the
 ,
,  ,
,  values can change its output characteristics easily, This is very convenient to users, which doesn’t involve many complex formulas and capacitor selections.
3.2.2. The Use of High Precision Data Acquisition Card
When the ferromagnetic material is in a state of stress or strain, the induced electromotive induced by the sensor testing coil is at millivolt level so we need a data acquisition system with sufficient accuracy. PCI-1716 is a high-resolution multifunction PCI data acquisition card launched by Advantech Company. It uses a 16 bit A/D converter based on FPGA, FIFO buffer with 1 k, and can reach 250 ks/s sampling rate at the highest speed. PCI- 1716 can provide 16 single ended analog inputs or 8 differential analog inputs, which can be a single input and can also be combined. At the same time, API function provided by PCI-1716 to dock with the LabVIEW, realize the programming control. Using PCI-1716 as the hardware platform, through 33 MHZ PCI bus of 32 bit connected to the industrial PC, with the help of the interface provided by LabVIEW DAQ driver, using the LabVIEW graphical programming language programming, to realize PCI-1716 hardware control and achieve high speed and high precision data acquisition, transmission and storage. Figure 6 is a flow chart of acquisition card use.
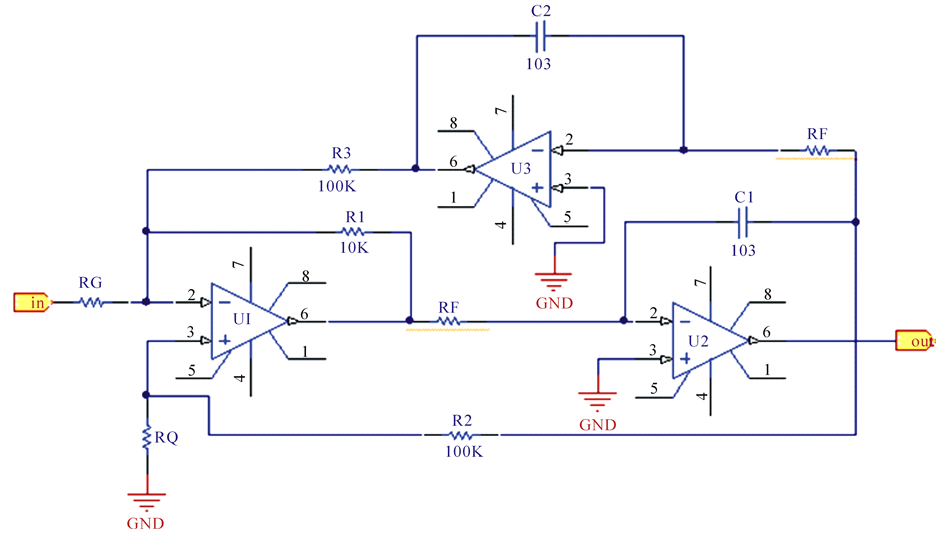
Figure 5. Filter circuit principle diagram.
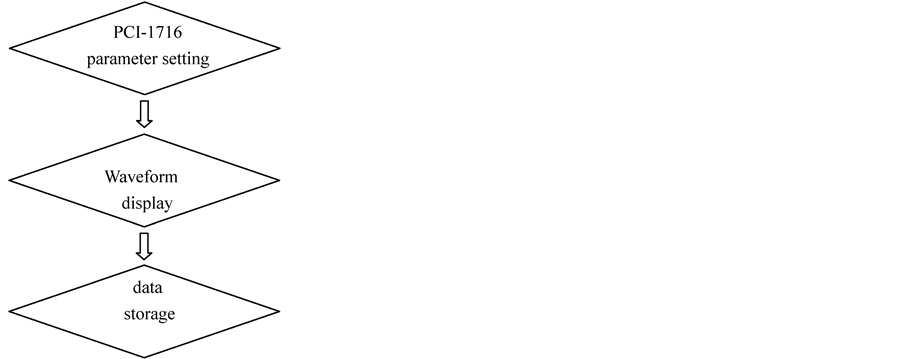
Figure 6. PCI - 1716 using process.
Each parameter of acquisition card can be set in the channel waveform acquisition control (AI Acquire Waveform), such as the sampling frequency, sampling points, channel selection, upper and lower limits of voltage. Then it can realize real-time acquisition Waveform display by connecting the AI Acquire Waveform output to the Waveform graph control input. Data acquisition also can pass the data to a spreadsheet string control for real-time display. Finally, let the data be put into the current VI path control, and then split the path, storing the data in the path created previously.
4. Signal Processing
At the scene of the pipeline detection in harsh environment, testing system for signals usually contains some additional noise as a result of the testing instrument itself and the external environment disturbance. These make the signal itself produces distortion and bring great difficulties for signal recognition and analysis. Therefore selecting the appropriate signal processing techniques to separate the useful signal effectively is a key step. The traditional Fourier transform de-noising method applies to the situation that the overlap of signal and noise band is very small or completely separated, separating signal and noise by using the method of filtering, but the actual acquisition of stress signal spectrum and noise is overlapping arbitrarily. Obviously using Fourier method can’t achieve effective de-noising effect. By contrast, the wavelet transform has good autofocus function and can distinguish useful signal and noise effectively. But the commonly used continuous wavelet transform, time-frequency window in time-frequency space is continuously moving, so there is a great deal of information redundancy. Discrete wavelet transform will discretize scale factor or translation factor, and can effectively reduce the redundancy of information to meet the engineering requirements of the detection signal processing.
4.1. Discrete Wavelet Transform Principle
For any finite energy signal![]() , the continuous wavelet transform is:
, the continuous wavelet transform is:
 (7)
(7)
where,  denotes the scale factor,
  is a translation factor. The wavelet analysis after discretization of
  and
and  is:
is:
 (8)
(8)
where,  ,
,  as the expansion parameter or scale parameter, is the translation parameters along the time axis.
Equation (2) is substituted in Equation (1):
 (9)
(9)
where,  is actually a sampling of continuous wavelet transform
  on time-scale planar discrete grid.
Such as orthonormal basis consisting of wavelet function family, namely:
 (10)
(10)
Any ![]() can be expanded as a linear combination of orthogonal basis,
can be expanded as a linear combination of orthogonal basis,
 (11)
(11)
Equation (9) is the expansion of Equation (11), by (9), (10), (11) it’s not hard to get:
 (12)
(12)
4.2. The Experiment Results Analysis
In the laboratory, stretch steel bars made of steel Q235 within the tensile elastic scope on lift machine to make its produce stress concentration area and then use electromagnetic stress testing equipment for stress testing. Figure 7 is the analysis of discrete wavelet signal detection. Reflection of the stress concentration regions in the original signal is not obvious, but after discrete wavelet analysis, signal in the volatile region is reflected obviously, namely the stress concentration area. Mark the stress concentration area and then stretch the steel bar destructively. Location of fracture is consistent with stress concentration position; the error is less than 5 mm, therefore it proves the feasibility of electromagnetic stress testing.
5. Conclusion
Based on the research on reverse magnetostriction effect of ferromagnetic materials, on the basis of using the Faraday’s law of induction, an electromagnetic stress testing system in engineering application is designed and implemented. The system could be used in ferromagnetic materials effective detection of residual stress, defor-
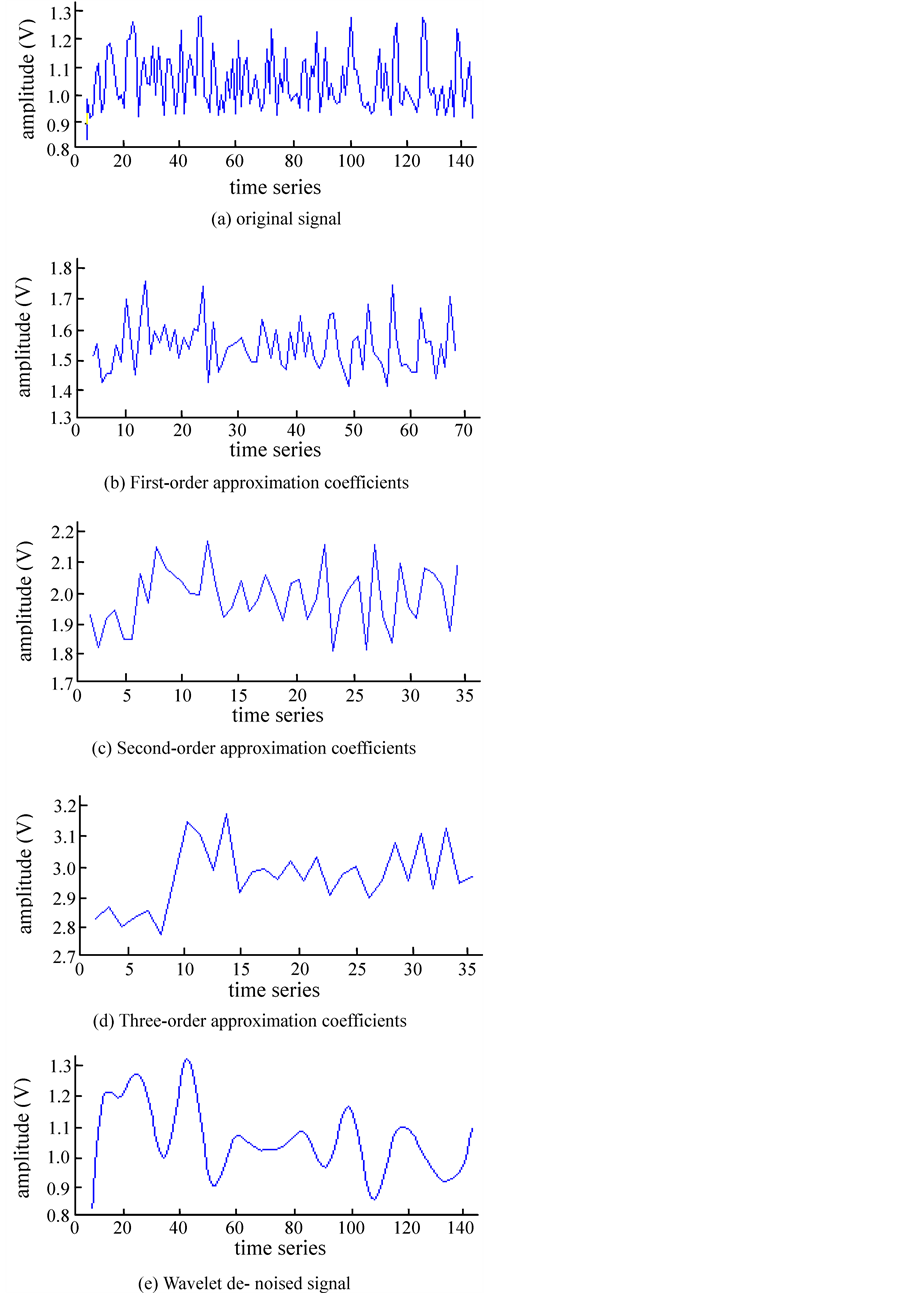
Figure 7. Discrete wavelet analysis.
mation stress and weld stress and experiments to prove the feasibility of electromagnetic stress testing system. At the same time, this system in engineering application embodies the detection speed, high precision, strong anti-jamming capability.
References
- Wan, Z.J., Liao, J.B., Wang, Y.K. and Yin, G.F. (2011) Research on Metal Tubing Pit Corrosion Monitoring Based on Potential-Array Method. Chinese Journal of Scientific Instrument, 32, 19-25.
- Pohl, R., Erhard, A., Montag, H.J., Thomas, H.M. and Wüstenberg, H. (2004) NDT Techniques for Railroad Wheel and Gauge Corner Inspection. NDT & E International, 37, 89-94. http://dx.doi.org/10.1016/j.ndteint.2003.06.001
- Wen, X.Q. and Liu, C.W. (2002) Magnetic Residual Stress Testing Method Based on Magnetostrictive Effect. Sensor Technology, 21, 42-44.
- Liu, J.H. and Feng, J. (2011) Research on Leak Fault Intelligent Detection Method for Fluid Pipeline Based on Fuzzy Classification. Chinese Journal of Scientific Instrument, 32, 26-32.
- Xu, J.L. and Hua, B., et al. (2009)The Research Status and Progress of the Technology of Magnetic Memory Testing. Journal of Inspection and Quarantine, 19, 64-66.
- Jia, W.L. and Liao, K.X., et al. (2010) Acidic Gas Pipeline Corrosion Defects Detection Technology. Oil and Gas Field Surface Engineering, 29, 1-2.
- Huang, S.L., et al. (2011) Oil and Gas Pipeline Deformation Finite Element Analysis of Eddy Current Probe Coil. Journal of Tsinghua University, 51, 390-394.
- Yang, L.J., et al. (2002) Wavelet Analysis of MFL Signals in the Pipeline. Journal of Instruments and Meters, 23, 484-488.
- Tang, Y., et al. (2009) Analysis of Characteristics of Pulsed Magnetic Flux Leakage Testing of 3D and Defect Classification. Journal of Instruments and Meters, 30, 2506-2510.
- Yang, L.J., et al. (2004) Pipeline Magnetic Flux Leakage On-Line Detection System Research. Journal of Instruments and Meters, 27, 48-50.
- Cheng, S. and Yang, R.X., et al. (2008) Application of Wavelet Analysis in Nondestructive Testing of Metal Magnetic Memory. Automatic Measurement and Control, 27, 48-50.