Geomaterials
Vol. 2 No. 4 (2012) , Article ID: 24083 , 4 pages DOI:10.4236/gm.2012.24010
Quick Assessment of Potential Hydrate Promoters for Rapid Formation
1Earth and Environmental Engineering, Columbia University, New York, USA
2Chemical Engineering, City College of New York, New York, USA
Email: cyl2121@columbia.edu
Received September 26, 2012; revised October 20, 2012; accepted October 27, 2012
Keywords: Gas Hydrate; Promoter; Technology; Clathrate
ABSTRACT
Hydrate technology has advanced to greater proportions: implementing the high latent heats as refrigerant, safe carbon capture as carbon sequestration in hydrates, purifying rare gases in hydrates, and safe efficient transport of energy using rapid hydrate formation. These account for only a small amount of the fundamental understanding of gas hydrates and the use of such a novel technology. A quick and broad analysis of novel hydrate promoters is needed to assess the potential of other promoter agents. This will improve the understanding of rapid hydrate formation and fundamental ideas related to the kinetics and formation of hydrates. There are still hundreds of other surfactants that have not been identified for rapid formation. The insurmountable endeavor deters many from trying as it can be like finding a needle in a hay stack. This almost futile endeavor of correctly identifying a surfactant as a promoter agent without doing a formation test can be accomplished with recent techniques. Using Raman and a liquid hydrocarbon (Cyclo-pentane), surfactants may shift the sample’s peak towards the hydrate peak (890 cm–1), thereby identifying it as a choice surfactant for rapid formation of hydrates. With a broad survey of surfactants, understanding fundamental science and engineering kinetics for hydrates will be easily achieved. Finding more effective and novel surfactants for hydrate formations will broaden the field of hydrates and self-assembling crystallization. As hydrate technology broadens, interdisciplinary fields can contribute expertise from surface science to spectroscopy leading to geological formations and engineering kinetics.
1. Introduction
Hydrate technology has advanced to greater proportions: implementing the high latent heats as refrigerant [1], safe carbon capture as carbon sequestration [2] in hydrates, purifying rare gases [3] in hydrates, and safe efficient transport of energy [4] using rapid hydrate formation. These account for only a small amount of the fundamental understanding of gas hydrates and the use of such a novel technology. A quick and broad analysis of novel hydrate promoters is needed to assess the potential of other promoter agents. This will improve the understanding of rapid hydrate formation and fundamental ideas related to the kinetics and formation of hydrates.
Gas hydrates are non-stoichiometric crystalline compounds that have a guest molecule such as: methane, ethane, carbon dioxide, or hydrogen surrounded by a host structure of water molecules [5]. Hydrate formation requires high pressures and low temperatures. The hydrate structure is able to store 170 times the volume of gas at atm [5]. The difficulties are slow formation rates and low water conversion. To compensate for the slow formation rate, mixing is used. However, mixing is energy intensive. The solution was to use promoters, such as sodium dodecyl sulfate (SDS) to allow for greater formation rates and water conversions while not using energy intensive measures. The results for SDS were phenomenal, increasing rates 100-fold [6]. The hypothesis for increased rapid formation was that micelle formations created nucleation sites [6]. However this was not possible as the Kraft point for SDS is 16˚C which limits the solubility below the CMC [7]. As to the role of surfactants in rapid hydrate formation, it is still undeterminable.
There are still hundreds of other surfactants that have not been identified for rapid formation. The insurmountable endeavor deters many from trying as it can be like finding a needle in a hay stack. This almost futile endeavor of correctly identifying a surfactant as a promoter agent without doing a formation test can be accomplished with recent techniques. Using Raman and a liquid hydrocarbon (Cyclo-pentane), surfactants may shift the sample’s peak towards the hydrate peak, thereby identifying it as a choice surfactant for rapid formation of hydrates.
2. Promoter Effects
2.1. Crystallization
There are two leading theories of how crystallizations occur: local crystallization [8] and cluster formations [9]. In local crystallization, localized crystal formations appear over large ranges in orders of hundreds of nanometers. This implies that local ordered structures are the initiators of crystallization. In cluster formations, a critical nuclei size is required to form in order for the start of crystallization. During this stage nuclei form and disappear until these nuclei reach the critical size to maintain it size. Nuclei size ranges in tens of nanometers.
Hydrate nucleation is a stochastic and complex process in the formation of gas hydrates. Firoozabadi [10] developed a general formula to predict nucleation rate in systems with and without additives. The formula suggested that the adsorption of surfactants can lower the effective critical nuclei size, thereby increasing nucleation rates. However theoretical arguments and experimental discoveries suggest that the additive adsorption may not always occur, because the lifetime of the nuclei is short, in the nano-to milliseconds, and thus diffusion cannot reach them. As such an additive in solution can either promote nucleation or have no effect when adsorption is impossible.
2.2. Interfacial Measurements at the THF Hydrate/Liquid Interface
The template is used to format your paper and style the text. All margins, column widths, line spaces, and text fonts are prescribed; please do not alter them. You may note peculiarities. For example, the head margin in this template measures proportionately more than is customary. This measurement and others are deliberate, using specifications that anticipate your paper as one part of the entire journals, and not as an independent document. Please do not revise any of the current designations. Formation kinetics of a non-stoichiometric compound is difficult to determine as its mass and porosity is undetermined. A clear mechanism for hydrate formation has yet to be established. However Zhang et al. [11], has speculated that the addition of SDS on the THF interface can reduce the induction time to a statistically consistent time. In this work THF hydrates were placed in a Malvern Nanosizer ZS at 3.2˚C. Using a 10-wt% THF solution THF hydrates have a dissociation temperature of 4˚C. With various concentrations of SDS, a qualitative measurement of surfactant concentration on the hydrate particles was measured via Zeta potential and fluorescence. This was the first time anyone has looked at the effects of SDS on the hydrate/liquid interface at the microscopic level. Fluorescence measurements had further confirmed a hydrophobic layer had formed on the hydrate/liquid interface.
From Zeta potential measurements three regions were demarcated in Figure 1. Region I shows a flattened line. This line inferred that the addition of 0.17 mM SDS did not change the Zeta potential, which was reasoned to be the competition effect of the original ions (bicarbonate) with SDS on the surface. Region II, a dramatic decrease in Zeta potential is observed, this is interpreted as the continued adsorption of the SDS onto the surface. Region III is a somewhat slower slope, which is indicative of a slowing adsorption or saturated system.
Fluorescence measurements confirm the presence of a hemi-micelle layer, shown in Figure 2. Fluorescence measurements are performed using pyrene and reading the intensity ratio of the third (I3) and first (I1) peak. The intensity ratio indicates the microenvironment the probe is in. At 0mM of SDS the I3/I1 ratio (0.54) is similar to an intensity ratio for water (0.5). Beyond 0.17 mM of SDS the intensity ratio goes to 0.7. Usually a hemi-micelle intensity ratio should be around 0.7 - 1.0. From fluorescence there is a clear sign of when the I3/I1 intensity ratio reaches a hemi-micelle plateau. Just from these two measurements, a confirmation can be made that SDS adsorbs onto a hydrate surface and a layer appears to form.
As a corollary induction time measurements versus surfactant concentrations were studied and shown in Figure 3. Using the same concentrations of SDS for the formation of THF hydrates, induction time measurements were recorded. Induction time was posed as the time when the final set temperature first started to the occurrence of a temperature spike due the increased heat of formation. Each measurement was repeated three times for statistical precision. Induction times were reduced by
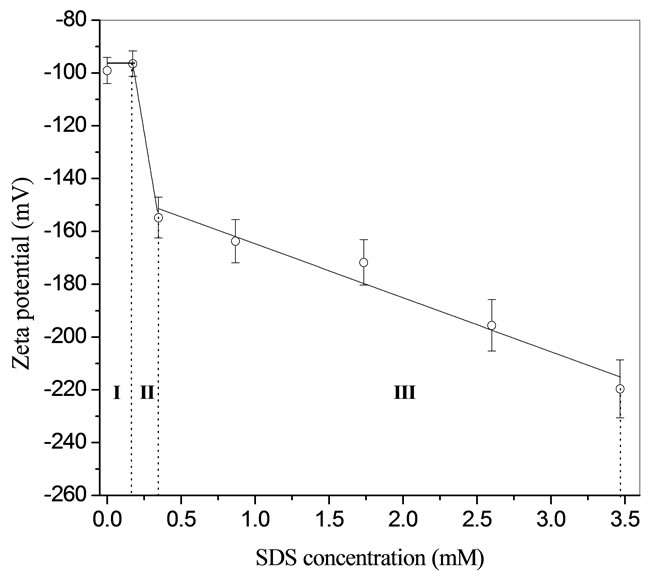
Figure 1.  -Potential of THF hydrates as a function of SDS concentrations [11].
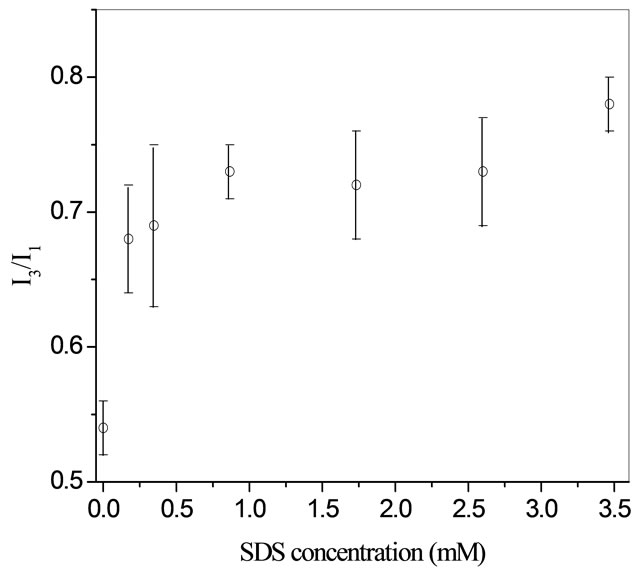
Figure 2. Variations of I3/I1 in THF hydrate slurries as a function of SDS concentrations [11].

Figure 3. Relationship between the induction time for THF hydrates at 268.2 K and SDS concentrations [11].
about a third of the time. This correlated to the adsorption of SDS on the hydrate/liquid interface.
With this correlation, a speculative interpretation was needed to be presented as to why this correlated so well. This was a remarkable occurrence to be seen. SDS is known to be a promoter and many kinetic studies have been done. However, correlating the adsorption of SDS to the induction time was never introduced. Two mechanisms were proposed that need to be explored:
• SDS reduces the interfacial tension allowing for faster crystallization.
• The adsorbed SDS layer provides a hydrophobic domain to allow for co-adsorption of the hydrate formers.
3. Anionic Surfactant Adsorption on Different Hydrates
From the previous study on THF hydrates, it was identifiable that THF hydrate had an adsorbed layer of SDS. That spurred the question of whether an adsorbed layer of SDS would appear on different hydrates. In Lo et al. [12], different hydrate formers were used to see whether the effect of a more hydrophobic (CP hydrate melt temperature: 7.8˚C) or semi-clathrate (TBAB hydrate melt temperate: 9˚C) hydrate had any influence on the adsorption of SDS. Fluorescence measurements, in Figure 4, showed that the interface of cyclo-pentane (CP) hydrates is indeed slightly hydrophobic to the degree of a hemimicelle (0.7 - 0.75). With no clear indication of adsorption, Zeta potential measurements were used to confirm the adsorption.
Again demarcated regions are shown in Figure 5. Region I revealed an increasing slope, which was interpreted as the competition of SDS to the ions in the system. However this was different from the THF hydrate adsorption of SDS. The increasing slope inferred to us that the SDS monomer was lying flat on the CP hydrate and displaced more ions than that of SDS on the THF hydrate. Region II and III shows an increasing adsorption of SDS on the surface with faster and slower slopes. Region IV plateaus which is a clear indication of where it is saturated.
This was a clear indicator that the  monomers form a hemi-micelle at a level where the Zeta potential was saturated. From these two qualitative analyses, a presumption on the mechanism (Figure 6) for the adsorption of SDS on CP hydrate was made. At 0 mM of surfactant only carbonate ions are present in the system. At 0.17 mM of SDS the surfactant monomers lay flat covering the surface of the hydrate. Beyond 0.34 mM there is a saturated level of surfactant on the surface of the hydrate.
For the semi-clathrate, adsorption was the same as THF hydrates however there were more ions in the supernatant due to the nature of the hydrate former being a salt. As a result, the I3/I1 fluorescence measurement versus SDS concentration was slower to rise to a hemimicelle fluorescence of 0.7. The dotted line in Figure 7 indicates where the start of the hemi-micelle formation about a concentration level of 1.5 mM of SDS. This indicated that the influence of ion competition, in this case high , has a great effect on the adsorption of SDS on the hydrate/liquid interface. For THF hydrates the rise started at 0.17 mM.
From these two experiments we know that hemi-micelles can form on the hydrate surface. It is also observed that ions act as competitive site holders to prevent the adsorption of SDS. The different hydrate former can also affect the adsorption of SDS onto the surface as well as have a
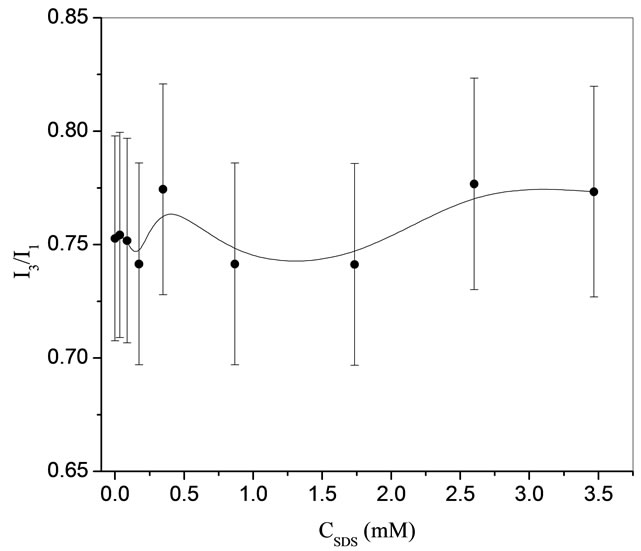
Figure 4. Variations of I3/I1 in CP hydrate slurries as a function of SDS concentrations [12].
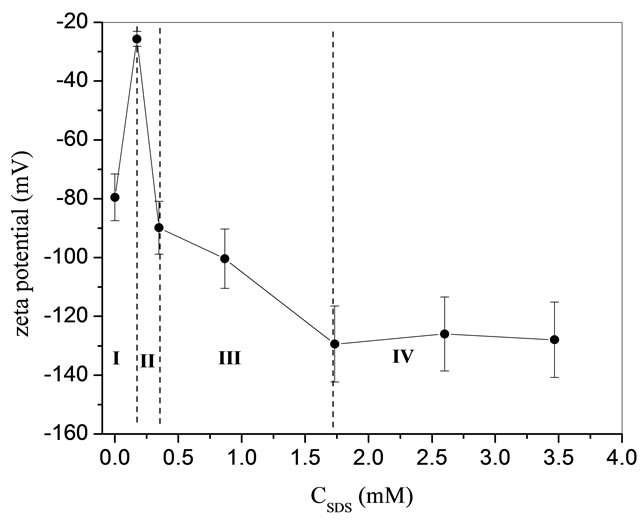
Figure 5.  -Potential of CP hydrates as a function of SDS concentrations [12].
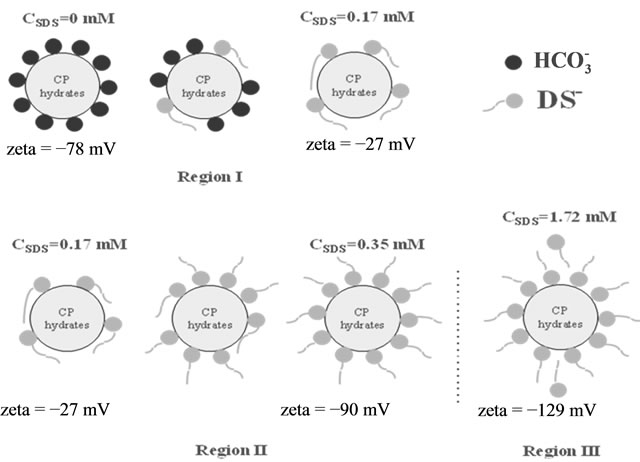
Figure 6. Schematic representation of SDS adsorption at the CP hydrate/water interface [12].

Figure 7. Variations of I3/I1 in TBAB hydrate slurries (●) at 277 K and 15 wt% TBAB solutions (○) at room temperature as a function of SDS concentrations [12].
different hydrophobicity. An adsorbed layer of SDS can reduce induction time. With these observations the active role of SDS in the mechanism for formation can be clarified.
4. Role of Surfactants
Zhong and Rogers [6] found that the effectiveness of SDS promoting ethane enclathration is observed at a SDS concentration above 0.35 mM, which corresponds to the one above which tails of surfactants start to orient toward the aqueous phase while headgroups attach to the hydrate surface (Figures 6 and 8). As tails orient parallel to each other, hydrophobic microdomains form at the hydrate-water interface, into which hydrate formers like methane molecules could solubilize. On the other hand, adsorption of  makes the hydrate surface more negative at higher SDS concentrations, which could change the water structure at the interface. The water structure at the solid-water interface is strongly dependent on the surface charge. Becraft and Richmond [13] found that the water hydrogen-bonding structure at the CaF2-water interface becomes relatively weak as the surface charge approaches zero, but it becomes strong if the net surface charge increases, which is favorable for the enclathration. The water structure at the hydrate-water interface should follow the same behavior. The increased concentration of hydrate former, favorable water structure, or both give rise to a fast growth rate. At this point, we cannot exclude that surfactant adsorption could reduce the adhesion force between hydrate particles, via increasing the net surface charge, or forming an adsorbed layer around hydrate particles, or both, lowering the possibility of agglomeration [14]. As a consequence, more small hydrate
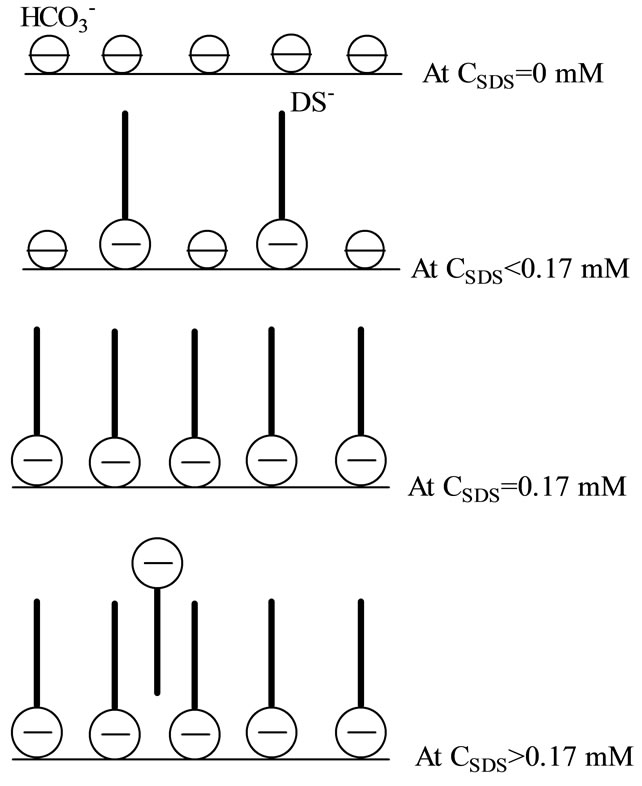
Figure 8. Schematic representation of SDS adsorption at THF hydrate/liquid interface [11].
particles form and the total hydrate-water interfacial area, at which the hydrate growth prefers to proceed, is higher than that in a system without surfactants, causing more guest molecules to be enclathrated in a given period. Besides, a low possibility of agglomeration also gives rise to a longer period of contact between water and guest molecules. These two factors lead to favorable enclathration kinetics.
Spectroscopy-Hydrates and Surfactant
Controllability for inhibiting or accelerating clathrate hydrate formation is based on a solid understanding of the enclathration kinetic including both hydrate nucleation and crystal growth. The enclathration is usually carried out with a small amount of surfactants, e.g., sodium dodecyl sulfate (SDS), to enhance enclathration kinetics in the absence of mechanical agitation.
This is the first experimental attempt to understand the effect of sodium dodecyl sulfate (SDS) on the water structure around CP both at the hydrate-water interface and in bulk aqueous solutions using surface-enhanced Raman spectroscopy (SERS) [15]. With a SDS concentration higher than 0.087 mM, the structure of water molecules at the water-CP hydrate interface is the same as that in the large cavity of sII hydrates. It is observed that the microenvironment of CP in bulk aqueous solutions is clathrate-like at SDS concentrations above 0.35 mM.
The Raman spectrum of liquid CP exhibits five prominent bands at 888, 1030, 1445, 2869, and 2942 cm–1 (Figure 9). The bands at 888 and 2869 cm–1 have been assigned to ring breathing and C-H stretching modes of A1’ (symmetric vibration) species, the Raman bands at 1030 and 2942 cm–1 are assigned to ring and C-H stretching modes of E2′ (degenerate vibration) species, and the 1445 cm–1 frequency denotes the CH2 deformation mode of E2′ species. As Figure 9 shows, five bands appear in the Raman spectrum of the water-CP hydrate interface and all bands are blue-shifted from those of liquid CP. Again, the strongest band of CP Hydrates at 894 cm–1 is assigned to the A1’ ring breathing mode. This high-frequency shift of the ring breathing and C-H stretching bands is due to encaging CP molecules in large cavities (51264) of sII hydrates. Also, a shoulder (left dotted line) is observed at the low frequency side of the 894 cm–1 band, which is attributed to the dissolved CP at the interface. A close examination of Figure 9 reveals that the A1’ ring breathing mode at the liquid CP-water interface is at 890 cm–1, indicating that the water structure surrounded CP in this region is clathrate-like. Additionally, A1’ ring breathing mode of dissolved CP both in bulk aqueous solutions and at the water-hydrate interface (Figure 9) experiences a red-shift compared with that of liquid CP.
With 0.087 to 1.0 mM SDS, the shoulder of 894 band in CP at the water-hydrate interface vanishes as shown in Figure 10. This observation can be interpreted in terms of the effect of surfactant chains on the local water structure. A previous simulation work suggests that the aqueous environment around the non-polar tails of sur-
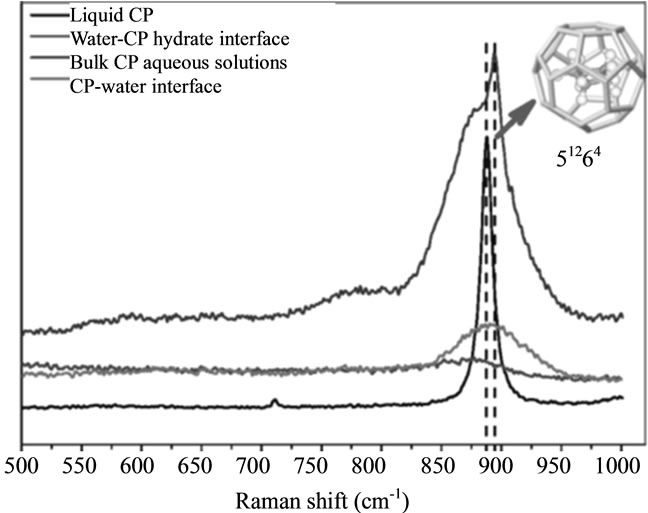
Figure 9. Raman spectra of liquid CP, water-CP hydrate interface, bulk aqueous solution, and CP-water interface without any SDS: (a) in the region of 500 - 1000 cm–1 frequency; (b) in the region of 1000 - 1600 cm–1 frequency and (c) in the region of 2600 - 3200 cm–1 frequency [15].
factants is similar to the structure of hydrate surface. Thus, adsorption of  on hydrates causes the local microenvironment of dissolved CP at the water-hydrate interface to be identical to the water structure of the large cavity of sII hydrates, even with 0.087 mM SDS.
To confirm the influence of surfactants on the local water structure, Raman spectra of dissolved CP in aqueous solutions is measured. In Figure 11, Raman bands at 877 cm–1 shift to a higher wavenumber as the SDS concentration increases from 0.17 to 0.35 mM. With 0.35 and 1.0 mM SDS, the A1’ ring breathing appears near 890 cm–1, which corresponds to the A1’ ring breathing of CP in clathrate-like clusters. This blue-shift is due to the change in the microenvironment around CP. The Raman spectrum of liquid CP is not affected by the hydrocarbon chain in dodecanol solutions and the tail of SDS in CP microemulsions.

Figure 10. Raman spectra of water-CP hydrate interface with different SDS concentrations [15].

Figure 11. Raman spectra of dissolved CP in bulk aqueous solutions with different SDS concentrations [15].
At a SDS concentration above 0.087 mM (or 25 ppm), the arrangement of water molecules around the hydrate former at the water-hydrate interface is the same as the hexakaidodecahedron (51264) cavity of sII hydrates. Also, the microenvironment of CP in bulk aqueous solutions is close to that in hydrates when a SDS concentration is higher than 0.35 mM (or 100 ppm). Additionally, the water structure around cyclopentane at the CP-water interface, regardless of the presence of surfactants, is clathrate-like. Adsorption of surfactants at the waterhydrate interface causes hydrogen-bonded water molecules to arrange in the same way as in clathrate hydrates, which enhances the intrinsic enclathration rate. Moreover, the presence of surfactants in bulk aqueous solutions increases the concentration of clathrate-like water aggregates, shortening the induction.
5. Quick Assessment of Hydrate Promoters
The clear understanding of rapid formation lies in the adsorption of surfactants on hydrates and the spectral shift of hydrate formers in surfactant solutions. Some preliminary results have shown very influential and relevant data. Figure 12 shows the Raman spectral data for several surfactants and a 1 wt% CP mixture in an aqueous colloid of silver. The spectra are red shifted to indicate no involvement in promoting hydrate formations or blue shifted, indicating promoter effects. We see the standard SDS surfactant being blue shifted to 890 cm–1. This blue shifting indicates a clathrate-like microenvironment around CP, while red shift is indicative of a nonordered environment. Kinetic hydrate formation tests also solidly confirm the surfactant’s ability to promote hydrates.

Figure 12. Raman spectra for several surfactants. Blue squares indicate a blue shift and red squares indicate a red shift or no shift.
6. Summary
With a broad survey of surfactants, understanding funmental science and engineering kinetics for hydrates will be easily achieved. Finding more effective and novel surfactants for hydrate formations will broaden the field of hydrates and self-assembling crystallization. As hyate technology broadens, interdisciplinary fields can contribute expertise from surface science to spectroscopy leading to geological formations and engineering kinetics. This cumulative study encompasses physical chemistry techniques and various spectroscopic techniques to idenfy the loading and promoter effects of various surfactants. With this knowledge base, screening for hydrate promots can be achieved quickly and efficiently.
REFERENCES
- D. Liang, K. Guo, R. Wang and S. Fan, “Hydrate Equilibrium Data of 1,1,1,2-Tetrafluoroethane (HFC-134a), 1,1-Dichloro-1-fluoroethane (HCFC-141b) and 1,1-Difluoroethane (HFC-152a),” Fluid Phase Equilibria, Vol. 187-188, 2001, pp. 61-77. doi:10.1016/S0378-3812(01)00526-X
- S. Y. Lee, L. Y. Liang, D. Riestenberg, O. R. West, C. Tsouris and E. Adams, “CO2 Hydrate Composite for Ocean Carbon Sequestration,” Environmental Science and Technology, Vol. 37, No. 16, 2003, pp. 3701-3708. doi:10.1021/es026301l
- V. M. Vorotyntsev, V. M. Malyshev, P. G. Taraburov and G. M. Mochalov, “Separation of Gas Mixtures by Continuous Gas Hydrate Crystallization,” Theoretical Foundations of Chemical Engineering, Vol. 35, 2001, p. 513. doi:10.1023/A:1012390423740
- Mitsui Engineering and Shipbuilding, “Mitsui Engineering and Shipbuilding.” http://www.nghjapan.mes.co.jp/english/business/possibility.html
- E. D. Sloan and C. Koh, “Clathrate Hydrates of Natural Gas,” 3rd Edition, CRC, Boca Raton, 2008.
- Y. Zhong and R. E. Rogers, “Surfactant Effects on Gas Hydrate Formation,” Chemical Engineering Science, Vol. 55, No. 19, 2000, pp. 4175-4187. doi:10.1016/S0009-2509(00)00072-5
- J. S. Zhang, S. Y. Lee and J. W. Lee, “Does SDS Micellize under Methane Hydrate-Forming Conditions below the Normal Ambient Krafft Point?” Journal of Colloid and Interface Science, Vol. 315, No. 1, 2007, pp. 313-318. doi:10.1016/j.jcis.2007.06.049
- F. H. Stillinger and T. A. Weber, “Computer Simulation of Local Order in Condensed Phases of Silicon,” Physical Review B, Vol. 31, No. 8, 1985, pp. 5262-5271. doi:10.1103/PhysRevB.31.5262
- A. Stradner, H. Sedgwick, F. Cardinaux, W. C. K. Poon, S. U. Egelhaaf and P. Schurtenberger, “Equilibrium Cluster Formation in Concentrated Protein Solutions and Colloids,” Nature, Vol. 432, 2004, p. 492. doi:10.1038/nature03109
- D. Kashchieva and A. Firoozabadi, “Nucleation of Gas Hydrates,” Journal of Crystal Growth, Vol. 243, No. 3-4, 2002, pp. 476-489. doi:10.1016/S0022-0248(02)01576-2
- J. S. Zhang, C. Lo, P. Somasundaran, S. Lu, A. Couzis and J. W. Lee, “Adsorption of Sodium Dodecyl Sulfate at THF Hydrate/Liquid Interface,” Journal of Physical Chemistry C, Vol. 112, No. 32, 2008, pp. 12381-12385. doi:10.1021/jp801963c
- C. Lo, J. S. Zhang, P. Somasundaran, A. Couzis and J. W. Lee, “Adsorption of Surfactants on Two Different Hydrates,” Langmuir, Vol. 24, No. 22, 2008, pp. 12723-12726. doi:10.1021/la802362m
- K. Becraft and G. L. Richmond, “In Situ Vibrational Spectroscopic Studies of the CaF2/HO Interface,” Langmuir, Vol. 17, No. 25, 2001, pp. 7721-7724. doi:10.1021/la011133g
- M. R. Anklam, J. D. York, L. Helmerich and A. Firoozabadi, “Effects of Antiagglomerants on the Interactions between Hydrate Particles,” American Institute of Chemical Engineers Journal, Vol. 54, No. 2, 2007, p. 565.
- C. Lo, J. S. Zhang, P. Somasundaran and J. W. Lee, “Raman Spectroscopic Studies of Surfactant Effect on the Water Structure around Hydrate Guest Molecules,” JPC Letters, Vol. 1, No. 18, 2010, pp. 2676-2679.