American Journal of Molecular Biology
Vol.2 No.3(2012), Article ID:20974,16 pages DOI:10.4236/ajmb.2012.23019
How is the biological information arranged in genome?
![]()
1Department of Materials and Biological Engineering, Tsuruoka National College of Technology, Tsuruoka, Japan
2Laboratory of Life Information Science, Yamagata, Japan
Email: mtakeda@tsuruoka-nct.ac.jp, takedamasaharu@gmail.com
Received 20 January 2012; revised 26 February 2012; accepted 5 April 2012
Keywords: Entire Genome; Biological Information; Field; Living Cells
ABSTRACT
The four nucleotides (bases), A. T. G and C were sophisticatedly arranged in the structural features in a single-strand of genomic DNA, 1) reverse-complement symmetry of base or base sequences, 2) bias of four bases, 3) multiple fractality of the distribution of each four bases depending on the distance in double logarithmic plot (power spectrum) of L (the distance of a base to the next base) vs. P(L) (the probability of the base-distribution at L), regardless species, forms, genome-sizes and GC-contents. In small genomes such as viruses and plasmids, the multiple fractality might be occasionally hard to distinguish clearly with the power-low-tail region (multi-fractal dimension) because of the low base numbers. In this review article, the author showed that 1) the structural features for the biologically active genomic DNA were observed all living cells including the organelleand the viralgenome, 2) the potentiality of a new analytical method of the genome structure based on the appearance frequency, Sequence Spectrum Method (SSM) could be analyzed DNA, RNA and protein on genome, 3) the structural features of genome might be related the biological complexity. These findings might be useful extremely to understand the living cells, and the entire genome as a “field” of biological information should need to analyze.
1. WHAT IS GENOME?
“Genome” was referred to the DNA portion of chromosome composed of proteins and DNAs in living cells. The author would repeat that the molecular aspect for genome should be necessary to understand the living cells. Essentially the genomic DNA was carried biological information, a large number of genes might be present on genome, and each gene was transcribed to each mRNA and translated to each protein on ribosome by the “Central Dogma” [1]. However, the presence of gene(s) was not quite enough to recreate the organisms because the sum of genes on genome might not be organized, therefore, they could not reproduce the living cells. Other parts, generally called the non-coding region of genome or chromosome needed to express the gene(s) precisely, rapidly and steady for the organism, i.e., the four bases composed of genomic DNA were arranged sophisticatedly on genome or chromosome for the creation of the organisms [2-5]. Although most of scientists might be acceptable to the individual molecular events to understand the biological phenomena, in the case of the field of genome, it might become dim generally without notice.
Recent progresses of the genome biology in prokaryoticand eukaryotic-cells including archaeas and viruses would be overshadowed to consider what the genome was. To understand the genome, the following reports might be suggestive.
1.1. Gene Repetition on Chromosome
The α-subunit (F1α) gene of F1F0-ATPase complex, ATP1 [6] was arranged to repeate three times with the adjacent DNA sequences on the left arm of chromosome II in the yeast Sacchromyces cerevisiae using the prime clones, 70113 and 70804 from ATCC. The same results of the base sequences of genomic DNAs were obtained from strains DC5, SEY2102, LL20, W303-1A and S288C in 1995 [7]. Long-PCR analysis between three copies of ATP1s, ATP1a-ATP1b and ATP1b-ATP1c were revealed the difference the distances [8]. We have also confirmed the ATP1 repetition by the base sequences of the 35-kb region of chromosome II repeated with the adjacent DNA sequences including ORFs [9].
ATP2 and ATP3 were respectively gene of β-(F1β), and γ-subunit (F1γ) of F1F0-ATPase complex in the yeast Saccharomyces cerevisiae, also revealed to repeat three and two times (twice) with the adjacent DNA sequences in the yeast Saccharomyces cerevisiae chromosomes X (right arm) and II (right arm), respectively, although the sizes (base numbers of repeated unit) were different from ATP1 [10,11] by the transformation of the homologous recombination [12]. These plural genes (ATP1s, ATP2s and ATP3s) were all active, not pseudo genes. In addition, three ATP1s (ATP1a, ATP1b, ATP1c) and ATP2s (ATP2a, ATP2b, ATP3b) maintained respectively identical activity.
Recently, two ATP16s, ATP16a and ATP16b were expressed with different by RT-PCR [13], and effect differently on the mitochondrial DNA as those of ATP3s. From the results might be suggested these plural genecopies might be active roles in biological phenomena concerned to the energy-transformation of F1F0-ATPase complex in living cells [11,13].
1.2. Cloned Sheep, “Dolly”
Wilmut and his colleagues have been isolated the genomic DNA from a sheep and injected it into an egg of another sheep. After the pregnancy of the sheep, the first cloned sheep, “Dolly” was born by their study at 1996 [14]. And then, “Dolly” could be to contribute the birth of the second cloned sheep, “Polly” and other cloned animals [15]. A series of shocking studies by Wilmut and his colleagues showed that presumably the genomic DNA in the sheep might be carried biological information to be able to generate the individual of the organism although many unknown biological phenomena might be still remained.
1.3. Disagreement of Geneand Chromosome-Scale
The discrepancies of the gene-scale experiments vs. the chromosome-scale experiments might be pointed out in some scientists [16,17].
In 2004, Olson, Reeves and their co-workers reported in Science that the mouse transformed the 5.4 Mb critical region of the Down syndrome genes in H. sapiens chromosome 21 has not be caused the disease. Whereas, the mouse transformed the region-deficient chromosome 21 was able to cause the Down syndrome. These results suggested that the expression of the genes for the Down syndrome might be affected the conformation of the region derived on the environmental, or the entire chromosome 21 structure, and a series of their reports for Down syndrome genes in chromosome 21 using mice were suggestive for the future functional genome analysis [18,19]. It was not enough to analyze the genes only for the Down syndrome. Specifically, to cause the Down syndrome, other viewpoints as a molecule of the chromosome 21 might be necessary to express the syndrome. In other words, there might be possible that a gene could be expressed accompanying the neighboring DNA sequences and regulated differently the higher-ordered structure of genome caused by the large deletion of the base sequences of the chromosome 21.
Hereafter such discrepancy as the Down syndrome critical region (DSCR) between chromosomeand genetic-data may be grown with the higher-order structure of genome and the functions of the non-coding regions on genomic DNA.
2. MOLECULAR ASPECT OF DNA
Watson and Crick deduced that DNA has been a doublehelical structure with complementary and anti-paralleled strands [20] based on the equal amounts of adenine (A) and thymine (T), and guanine (G) and cytosine (C) by Chargaff [21], and the X-ray diffraction patterns of DNA fibers by R. Franklin and M. Wilkins [22,23]. After that, Chargaff and co-workers also observed that a singlestrand of Bacillus subtilis DNA was held the same amount of A + T and G + C ([24], Chargaff’s second parity-rule, 1968).
About forty years later, the genome base sequences of many organisms described below were accelerated, and a bacterial genome (582,970 bp) was chemically synthesized based on Mycoplasma genitalium [25], although partial unreadable regions should be still remained in each genome. In addition, many studies of the DNA methylation, the modification of histone in the nucleosome structure and the effect on the transcription of the noncoding small RNA for epigenetics was carried out for the cell-developments and the cancer recently [26-33]. In other words, the structural analysis of the DNA based on the entire genome base sequence should be necessary to understand living cells. To do this, we have shown to characterize the structural features of genomic DNA.
Genome projects were completed so far to obtain the base sequences of prokaryotic organisms such as Escherichia coli [34], Bacillus subtilis [35] and Synechocystis sp. [36] etc., and eukaryotic organisms, such as Saccharomyces cerevisiae [37], Caenorhabditis elegans [38], Drosophila melanogaster [39], Homo sapiens [40- 43], and so many organisms [44-46]. Following the progress of the first round of genome sequencing and functional analysis, genome projects would be accelerated by the analysis of the internal structure of the genome and its association with the biological processes of the living cells. The structural analysis of the entire genomic DNA based on the nucleotide (base) sequences was necessary to study the living cells. To do this, many studies were being performed from the viewpoint of protein function by proteome, transcriptome, and functional genomic analyses [47-50].
However, in a hold fast to the gene(s) on genome as a core even in the chromosome-scale variations of Homo sapiens and other species, the more precisely we were able to study the genes or the respective proteins, the more we stepped away from the living cells. Why? Presumably, one of the estrangements might resulted from a different recognition of the gene(s) on genome or chromosome which disregarded the genome organization of the living cells. As the Genome Project revealed, the base sequence in genomic DNA could be caught a glimpse of the dynamic and the flexible characters [2-11, 13,16-19], and an individual gene was an integral part of a genome.
There were many genes and the associated regulatory regions that were expressed, replicated, transcribed and translated into proteins, and all participate in biological phenomena. Individual gene, i.e., a protein to be converted throughout the gene, was a part of genome (Figure 1). Each gene could be converted to respective protein according to the maturation of mRNA and “Central Dogma” [1]. They might be organized based on the support the other regions in chromosome, generally called, the non-coding region (space in Figure 1) for the regulation of the gene-expression in living cells as a biological system. If so, we should be to face up to the entire genome as a molecule, not only the coding region, but also the non-coding regions. The genome might be organized in the living cells as a biological system, including the codingand the non-coding regions, which have grown with the passage of time. Therefore, we should first review the entire genome as a systematized molecule to understand the living cells.
Let us show you one example for S. cerevisiae; PHO2 was a gene coding a transcription factor, Pho2p regulating several genes like PHO5 with co-regulated with other transcription factor, Pho4p [51-53]. It was well known that Pho2p was a cooperative interaction with Pho4p, and the literature [51] reported that the amino acids around S230 of Pho2p played an important role concerning the interaction with Pho4p. Each interactive regions of Pho2p, Pho4p and Pho5p could not identified the coding sequences, but identified from the appearance frequency of the successive base sequences of the entire yeast genomic DNA [4,5]. In other words, the analysis of PHO2 gene on chromosome IV could be studied for the
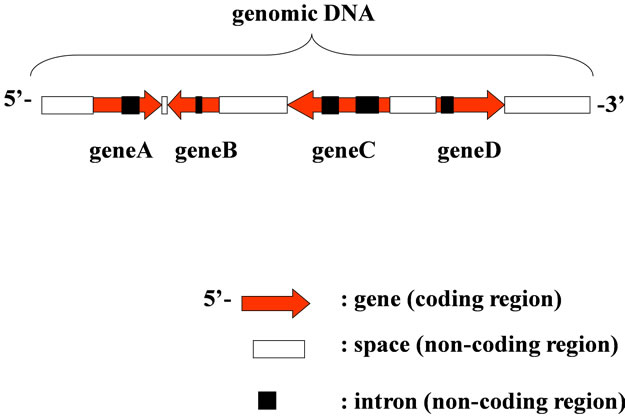
Figure 1. Structure of Genomic DNA. Gene on genome was transcribed using W-strand (left to right) or C-strand (right to left).
regulation in phosphate metabolism; binds cooperatively with Pho4p to the PHO5 promoter; phosphorylation of Pho2p facilitates interaction with Pho4p in S. cerevisiae. Other interaction of proteins could be identified from the same way (Sequence Spectrum Method, described later, refs. [4,5]).
The study for the entire genomic base sequences were not so much, because we carried a few effective tools, including hardand soft-ware, to analyze the large-scale molecule such as genome now, but some challenging bioinformatics papers [54-58] reported on genome structures, and the analyses of the whole-genome using the structural features of the genomic DNA, the specific base sequences [59-68].
3. RELATIONSHIP GENE AND CHROMOSOME
In prokaryotic cells including viruses and bacterio-phages, most regions of the genome were occupied in the coding regions, whereas in eukaryotic cells the coding regions were not so large in entire genome, and variable depend on the genome-sizes (base numbers composed of the genomic DNAs), for example, the coding regions was occupied only several percent (%) in H. sapiens genomic DNA [44,69]. Furthermore, each gene on chromosome or genome was arranged in the order, the direction using either the Watson-strand or the Crick-strand on the transcription, and the distance to the both-sides genes (Figure 2). When changed one of these three characters of gene on genome, the order, the direction, the distance, the living cells were becoming different ones, for examples, the chromosomal translocation occurred [70-72], and they were forced to live the surroundings. Therefore, only the coding regions, i.e., the genes could not be explained over the biological phenomena in living cells, especially the eukaryotic cells (Table 1) [2].
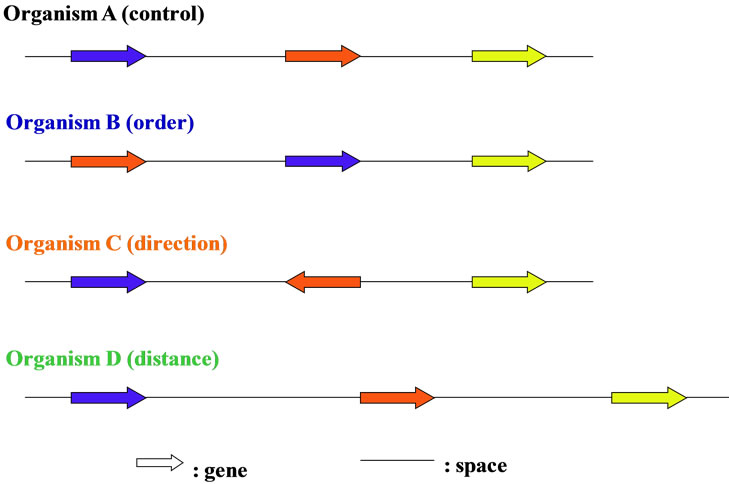
Figure 2. The genome is a “field” of genes. Gene with different color was different each. Genes on chromosome were arranged sophisticatedly with three features, order, direction and distance.
The genomic DNA might be also “a molecule with the aligned four bases, A, T, G, C, and with three dimensions” even if there was a huge. So, the large region was deleted, presumably they might become a molecule with different conformation affected the gene-expression and the activity to interact with the biological materials, bioorganic compound(s), protein(s), nucleic acid(s), sugar(s), fatty acid(s) or so on. To express the gene(s), the regulatory elements, the promoter (trigger), the SAR (scaffold), the insulator (boundary), the poly-A-signal (stability), ncRNAs (controller) etc on genomic DNA were all or some necessary [69,73-78]. Thus, both the codingand the non-coding regions should be necessary to express gene(s) precisely, rapidly and steady to carry out the various biological phenomena under the variation of the surrounding conditions.
Therefore, to express a gene, upstream element(s) (base sequence) such as promoter and down stream base sequence(s) such as terminator should be necessary. These elements were essentially located far from the coding region. In mammalian cells, the regulator element of a gene was located over 10,000 nt from the start codon ATG [79,80]. In addition, a protein translated the gene could be interacted with plural protein and genes [44-46, 81,82]. These biological phenomena, i.e., the regulation might be increased according to the increase of the ratio of the non-coding regions on genomic DNA [69,78]. Previously, we have shown that the base sequences of the genomic DNA would be prepared the fractality [2,3] and the homology of the sequence spectrum was closely associated with the interaction of transcription factor, Gal4p, and promoters of GAL1, GAL2, GAL7 and GAL10 using SSM [4,5]. From these results, we could lead the conclusions that the sequence spectrum of a gene could be homologous with not only the sequence spectrum of the base sequence, but also the entire region of the elements to express the gene on genomic base sequence.
Four bases were arranged sophisticatedly on genome
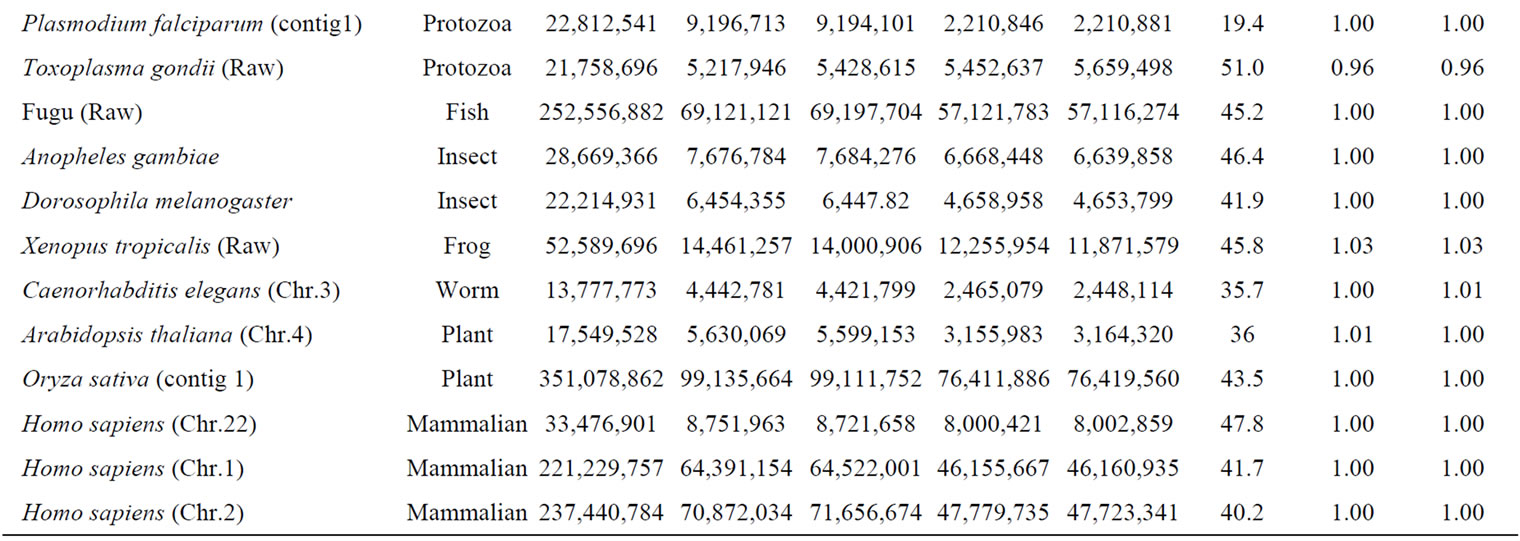
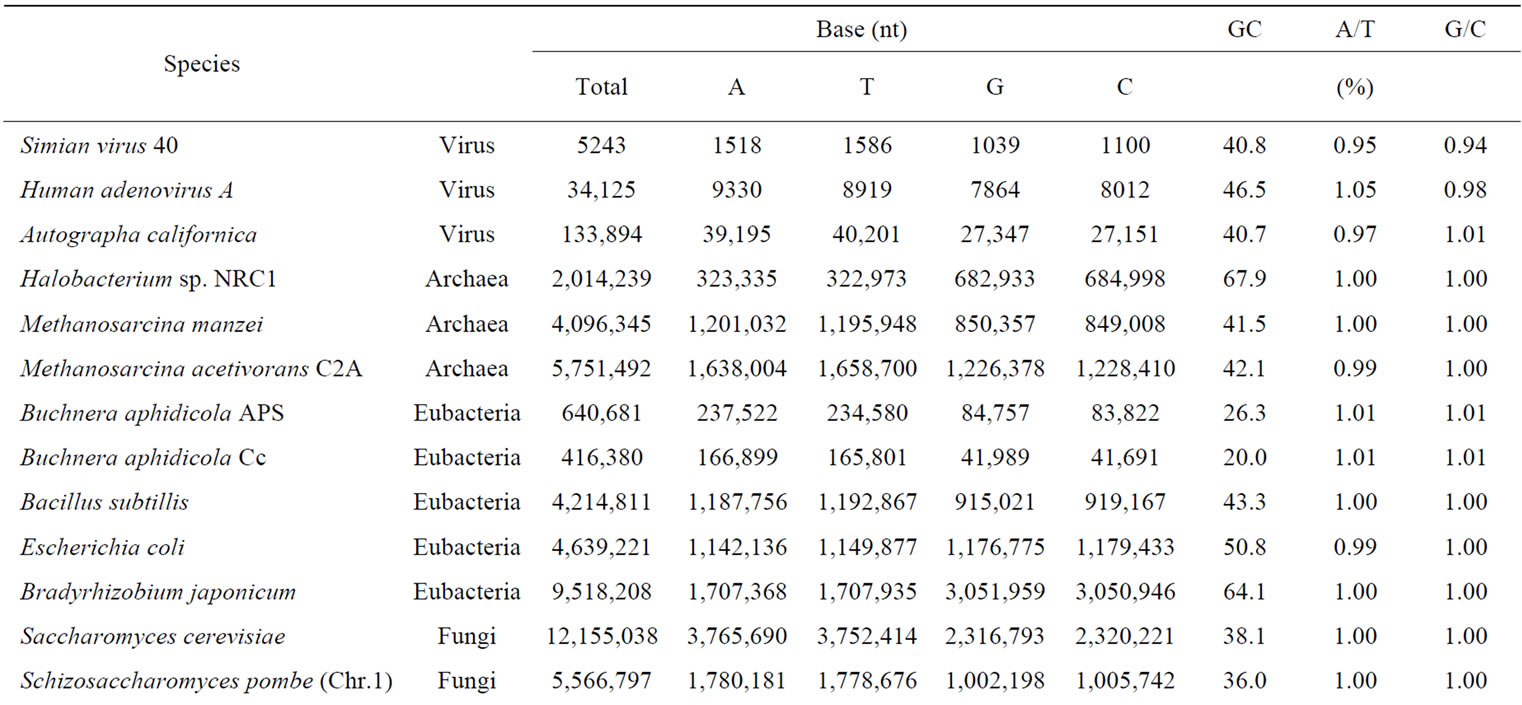
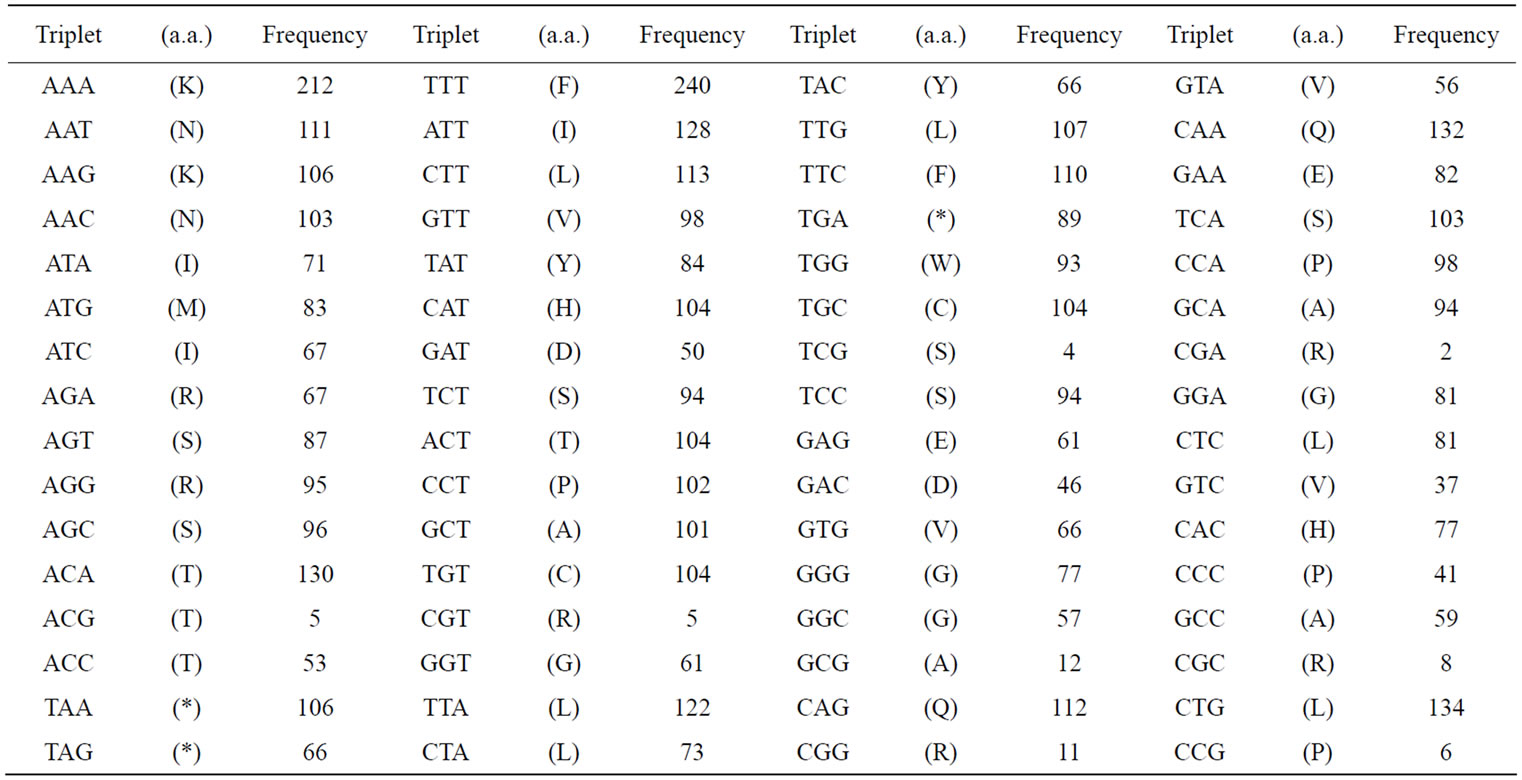
Table 1. Appearance frequency of four nucleotides (bases), A, T, G and C in a single-strand of DNA from various genomes.
so as to adapt to the surrounding conditions [2-5]. Therefore, we should concluded to analyze the biological information both the codingand the noncoding-regions on genome or chromosome to understand the living cells.
4. STRUCTURAL FEATURES OF GENOMIC DNA (GENERATION RULE)
Some studies for the base-bias in genome were reported that the base ratio was localized in genome for the correlation of the function and the neighboring genes and sequences [83-85]. There might be existed many genes in genome, for example approximately 6500 in S. cerevisiae, approximately 25,000 in H. sapiens, respectively [44,69,78]. If all genes were cloned with different vectors, and inserted all of them to the appropriate cells completely, could the S. cerevisiae cells, or H. sapiens cells be restores as the originals? The answer might be “no”, because all of the genes would be disordered, not be organized on the genome. They could not be expressed at precisely, rapidly and steadily as the originals under the surrounding conditions.
The image of a genome might be that of a “field” composed of the four bases A, T, G and C, which were arranged to form genes (ORFs), regulatory sequences to express the gene(s), introns, SINE, LINE, ncRNAs, and so on [2,69,73-78]. Each gene on a genome was a) ordered in each organism, b) transcribed using either the Watson strand or Crick strand, and c) located at a certain distance from next gene of both sides (Figures 1, 2). In addition, it might depend on the number and size of intervening sequences (introns, black-box in Figure 1).
Using the data-bases of NCBI [44], Sanger Institute [45], SGD [46] and MIPS [86] were useful to analyze, following structural features were revealed in a singlestrand of genomic DNA, 1) reverse-complement symmetry of base or base sequences, 2) bias of four bases, 3) multiple fractality of the distribution of each four bases depending on the distance. Thus, these three structural features of the base sequences should be exited simultaneously in each single-strand of the active genomic DNA [2,3].
Surprisingly, these structural features (1)-(3) were able to refer to viraland organelle-genomes [3], although the sizes (nucleotide numbers) of viraland organelle-genome were extremely smaller than those of prokaryoticand eukaryotic-genomes [44]. In other words, these three structural features of a single-strand DNA (or RNA-genome in some viruses) of genome could be identified the interactive regions for DNA-DNA, proteinprotein, DNA-protein and protein-RNA. Therefore, such analyses should be common and useful in living cells [4, 5].
4.1. The Genome Base Sequence Was Reverse-Complement Symmetry Even in a Single-Strand of DNA
Genomic DNA was composed of four different bases, A, T, G and C. The base number (nt) and GC contents of each genome and chromosome for S. cerevisiae and several other organisms were calculated and were shown in Table 1. The number of base A was equal to the number of T, and that of G was equal to that of C in each genome and chromosome even in a single strand of DNA. The symmetry of a single-strand of DNA exactly would agree with Chargaff’s second parity-rule [24]. The results also indicated that a single-stranded genomic DNA might sometimes had a closed structure with partial hydrogenbonding (stem-loops) as seen with RNA secondary structure [55-58].
To demonstrate the base-symmetry in a single-strand of DNA more precisely, we had calculated the frequency of appearance of various numbers of successive base sequences in an entire genome. The appearance frequencies of three successive base sequences corresponded to the species-dependent genetic codon (triplets) [2,3,66,87], which in turn could be corresponded to the 20 amino acids. The sum of the appearance frequency of 64 triplets (sequences) in the 16 chromosomes and mitochondrial (mt) DNA of the S. cerevisiae genome was shown in Table 2(a). The sum of the appearance frequency of all of the triplets was 12,155,004.
In the protein-protein interaction such as in the coding regions for the RecA protein and adenine-nucleotide binding proteins [88,89], and the mitochondrial targeting signal of mitochondrial proteins [6,90,91], apparently different amino acid residues might be able to speculate to make the same functional conformation within a molecule, specifically to gain the same building blocks in the molecule [4,5].
These results indicated that genome base sequences had a high-level of the reverse-complement symmetry even in a single-strand of DNA. Thus, the reverse-complement symmetry in a single-strand of DNA was observed not only in the ratio of the single bases (A/T, G/C) as proposed by Chargaff et al. [24], but also in the ratio of the 1 - 9 successive base sequences to their reversecomplement base sequences in the genome [2,3].
The reverse-complement symmetry of 10 - 12 successive base sequences could be observed in huge genomes such as Vertebrate genomes, H. sapiens (22 chromosomes + 2 sex chromosomes + mtDNA), M. musculus (19 chromosomes + 2 sex chromosomes + mtDNA) and so on [2]. In other words, a single-strand of DNA of the genome, or each chromosome might essentially maintain the reverse-complement symmetry of the base sequences necessary to generate many double-helical stems in a
 (a)
(a)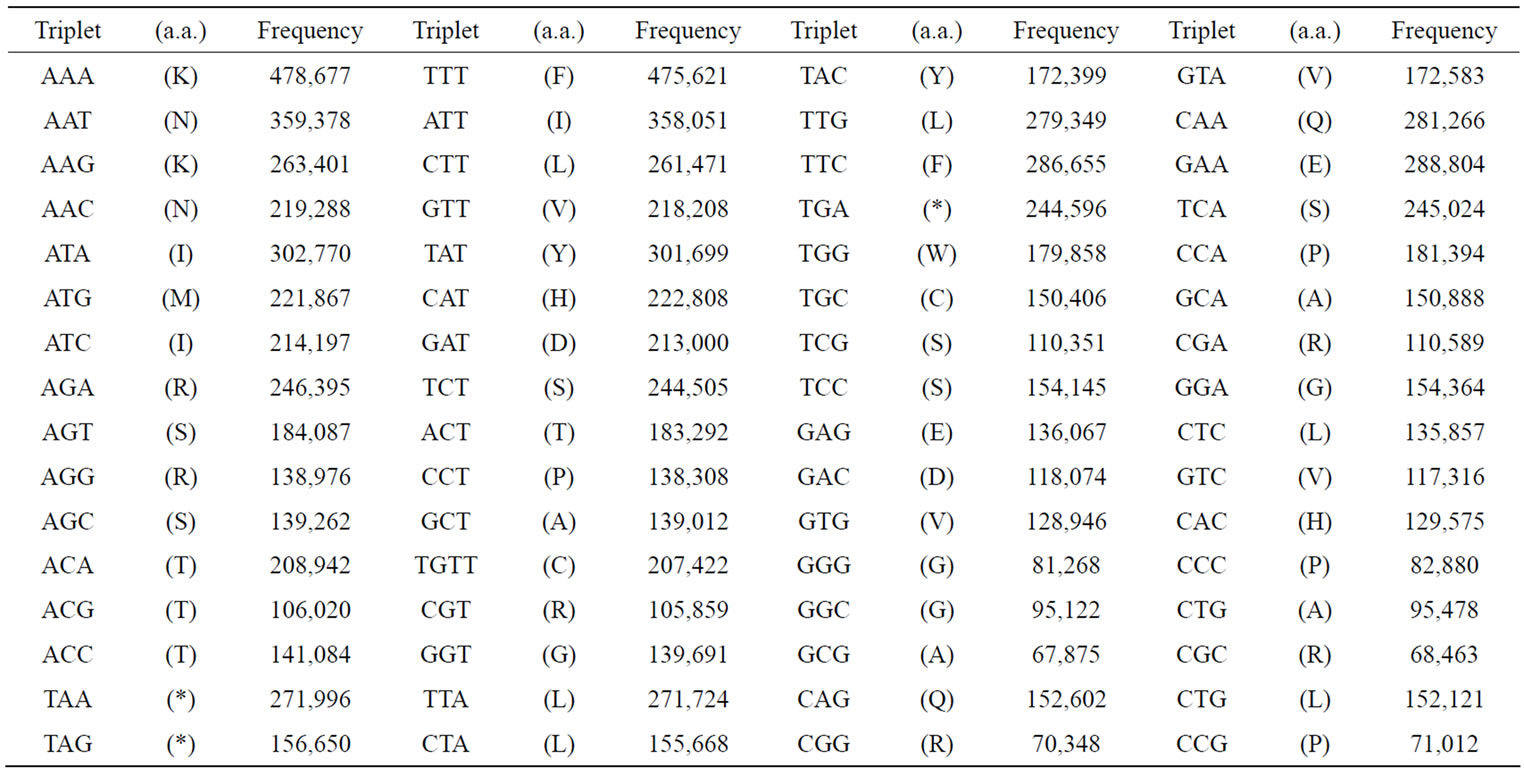 (b)
(b)
Table 2. Appearance frequencies of three successive base sequences (64 triplets) in a single-strand of DNA from the S. cerevisiae and SV40 genome. (a) Appearance frequencies of three successive base sequences (genetic codon) of S. cerevisiae genome. In S. cerevisiae genome, we have calculated the sum of the base frequencies of the 16 chromosomes (in numeric order) plus mtDNA; (b) Appearance frequencies of three successive base sequences of SV40 (5243 nt) was shown. Each triplet base can be read left (5’-) to right (3’-). Amino acids (in parentheses) corresponding to the triplets are expressed in single letter codes.
genomic DNA molecule.
4.2. The Genome Bases Were Localized
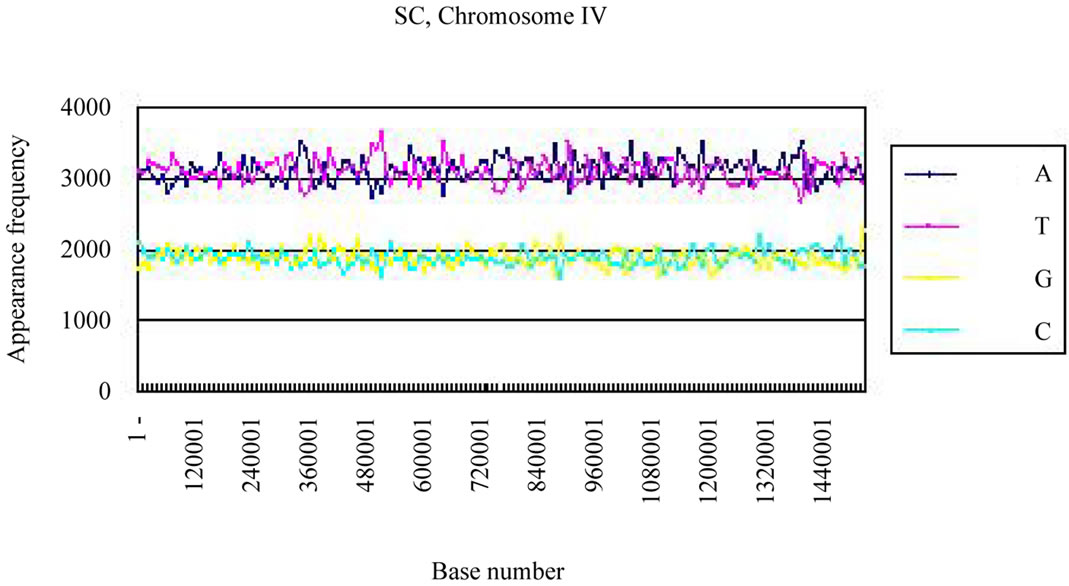
We calculated the distribution of the bases in S. cerevisiae chromosome IV and H. sapiens chromosome 22 (Figures 3(a), (c)). The counterfeit sequences (artificial chromosome IV) with the same appearance frequencies of the triplet (3 successive base sequences), the same molar ratio of four bases, and the same base numbers
(genome-size) were created using the random number as those of the real sequence in each chromosome.
Four bases were localized on each real chromosome of each genome (Figures 3(a), (c)), whereas they were distributed uniformly on the artificial chromosome IV or 22 (Figures 3(b), (d)). In contrast to the uneven distribution of four bases on the real chromosome IV (S. cerevisiae) or chromosome 22 (H. sapiens), the “A”, “T”, “G” or “C” frequencies in each artificial chromosomal sequence were distributed uniformly. The distributions of the “G”
 (a)
(a)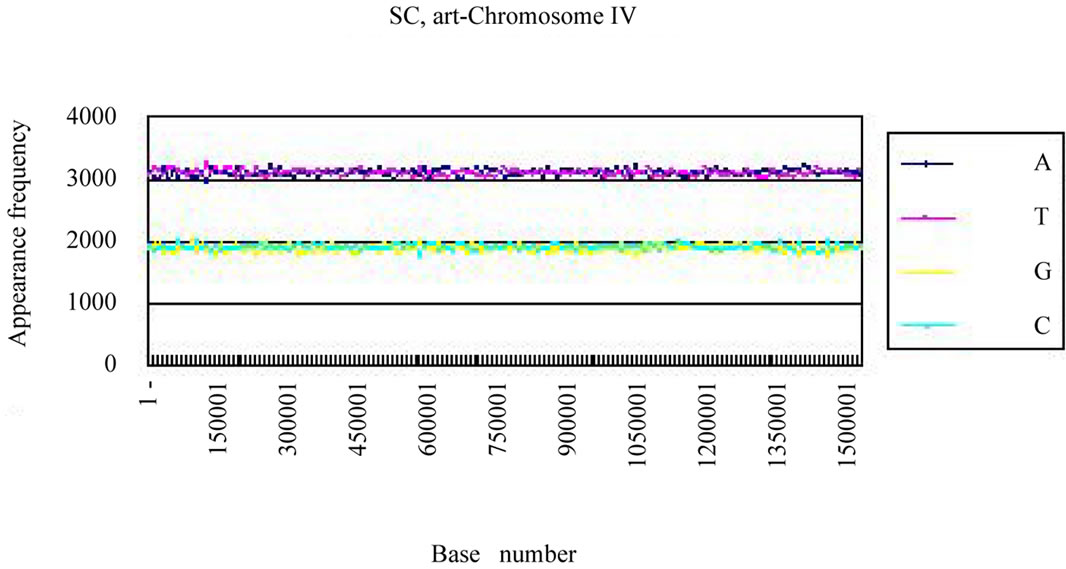 (b)
(b)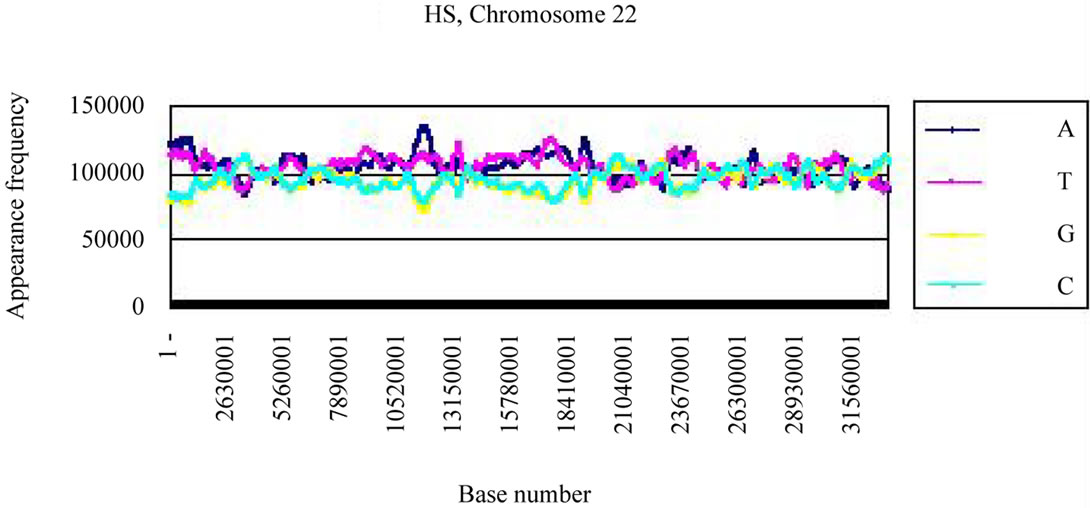 (c)
(c)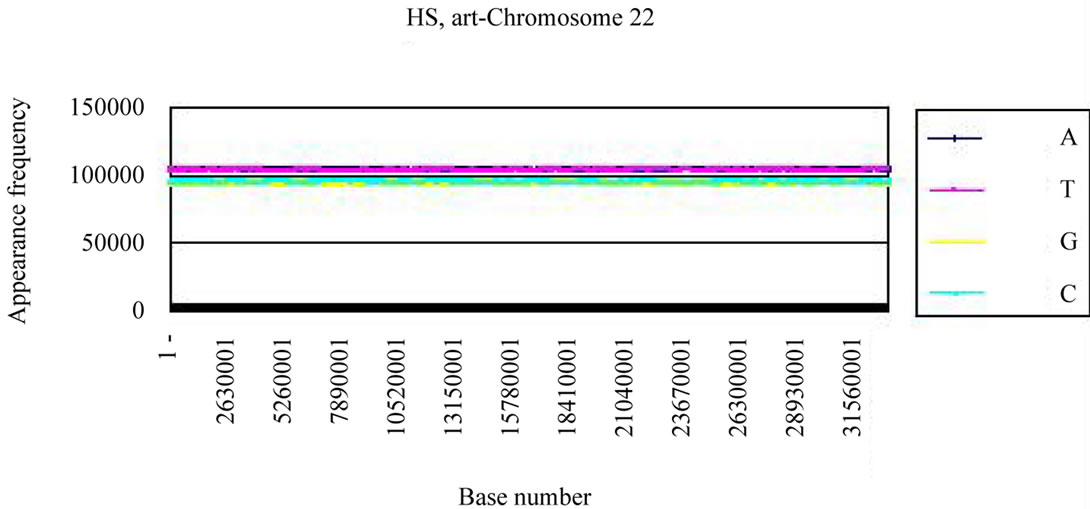 (d)
(d)
Figure 3. Difference of the frequency of four nucleotides (bases), A, T, G, C in S. cerevisiae chromosome IV, Homo sapiens chromosome 22 and their counterfeit sequences (artificial chromosomes). (a) Distribution of four bases, A (indigo), T (red), G (yellow), C (blue) of S. cerevisiae chromosome IV (real chromosome IV, top); (b) its counterfeit sequence (artificial chromosome IV, bottom) consisting of 1,531,927 bases each generated as described in Method section. The vertical axis is the frequency of four bases in the base sequence of S. cerevisiae chromosome IV. The horizontal axis is the base number from the top (5’-end) of every 10,000 nt (window width = 10,000 nt) the base sequence of S. cerevisiae chromosome IV; (c) Distribution of four bases, A (indigo), T (red), G (yellow), C (blue) of Homo sapiens chromosome 22 (real chromosome 22, top) and the counterfeit (artificial chromosome 22, bottom); (d) The counterfeit (artificial, bottom) of Homo sapiens chromosome 22. The window width of the Homo sapiens chromosome 22 is every 400,000 nt because chromosome 22 is large (33,476,901 nt).
and “T” bases had the same characteristics.
These results indicated that there might be many A-T and G-C hydrogen bonding in a single-strand DNA of intra-chromosomal molecules regardless eukaryotes or prokaryotes. In addition, each artificial genome or chromosome could observe the reverse-complement symmetry, but the four bases were distributed uniformly, corresponding with the same molar contents, A to T and G to C, in the genomic DNA molecule [2,3].
4.3. The Genome Bases Had Multiple Fractality
The real chromosomes had the base-symmetry (the reverse-complement symmetry) as well as the base bias, whereas the artificial chromosomal sequences had only the reverse-complement symmetry, but not the base bias. We could not find any Open Reading Frames (ORFs) in the artificial chromosomes (data not shown). Based on the above results, how are the four bases, A, T, G and C placed on a single-strand of DNA in a genome? In order to understand this issue we investigated the fractality characteristics of the real chromosomes and the artificial chromosomes based on the distribution of the base distance (L). Each base-distribution curve P(L) expresses the distribution of the distance L between a base and the next base, for the base “A”, the L-value was corresponded the base numbers from “A” to the next “A” in the genomic DNA, and P(L) is the sum of the probability with the same base-distance in the genomic DNA [2,3].
A simple distinction of uni-fractality or multi-fractality of the base distribution in a sequence was determined by fractal analysis by calculating the power law in log P(L) vs. logL. When the plot of log P(L) vs. log L gave an exponential curve, the fractality is uni-fractal; in contrast, when the plot of log P(L) vs. logL gave a straight line, the fractality was multi-fractal in double logarithmic plot (power spectrum) of L (the distance of a base to the next base) vs. P(L) (the probability of the base-distribution at L). Details of the calculation of P(L) were described in the manuscript [2,3].
Figure 4(a) showed the distribution curve of adenine bases “A” in the S. cerevisiae genome. When the L-value was 1 through 58, the distribution curve P(L) varied according to the L-value, but was not fitted to an exponential equation (data not shown).
Then we partitioned the “L” values. When the Lvalue was 1 through 15, the distribution curve P(L) of adenine (A) was fitted to an exponential Equation, y = ae–bx (Eq.1, x = logL, y = logP(L); a and b are constant). In the case of adenine “A” in the S. cerevisiae genome, the aand b-values were calculated from Eq.1 as 0.3837 and 0.3446, respectively (Figure 4(a), black square ■).
In contrast, when the L-value was greater than 16, P(L)
 (a)
(a)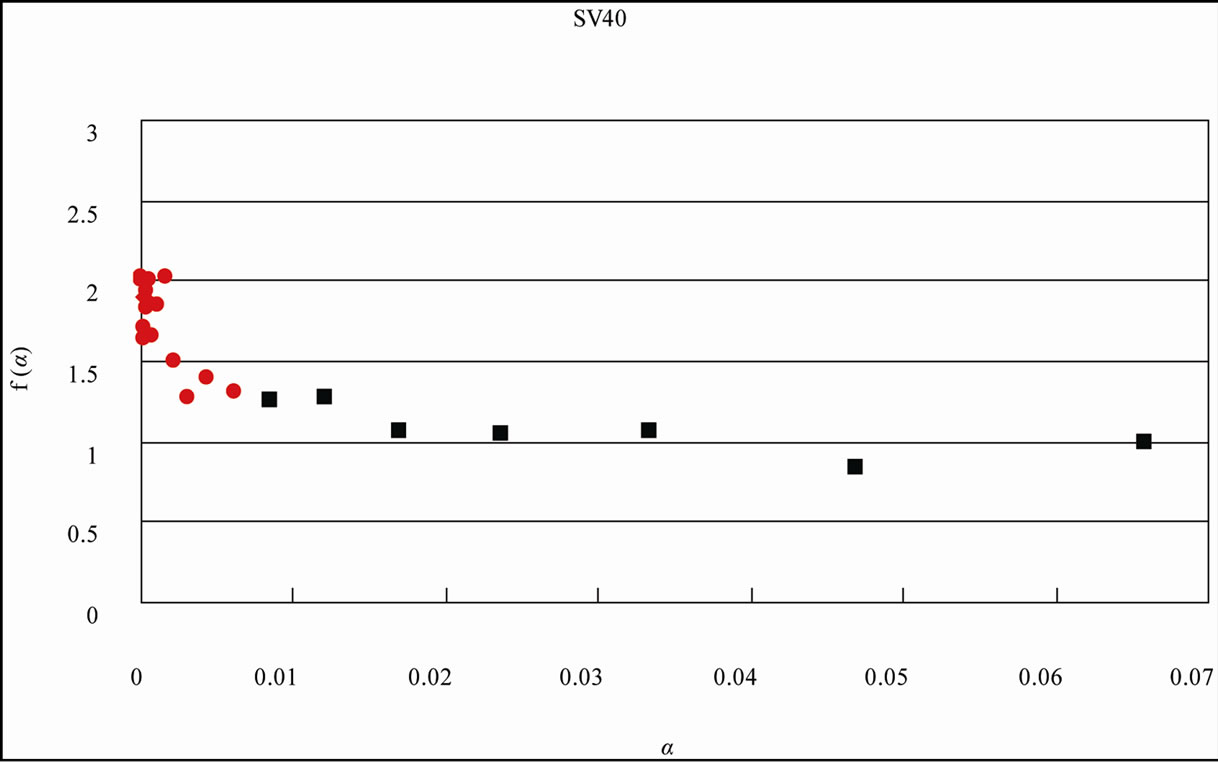 (b)
(b)
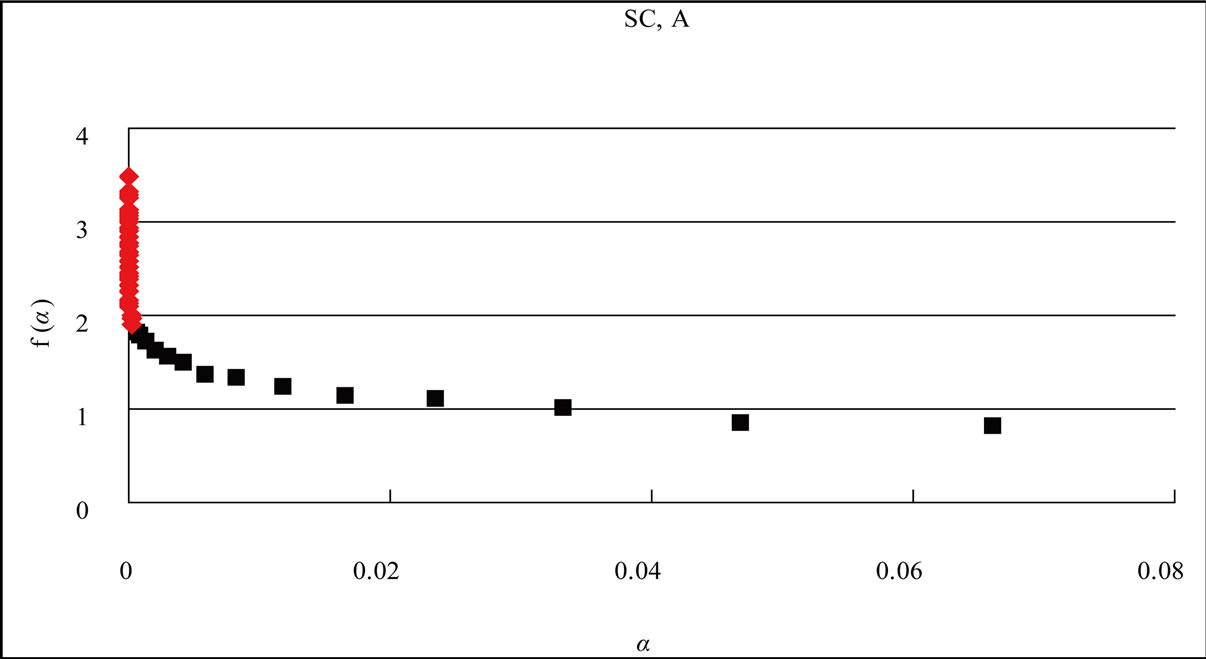
Figure 4. Distribution curve of adenine (A) and the fractal analysis in the S. cerevisiae and Simian virus 40 genome. (a) S. cerevisiae genome (16 chromosomes plus mitochondrial DNA = 12,155,038 nt). L = 1 - 15, f(α)-value of the region shown the eq.1 of the distribution curve of adenine bases, black square ■; L = 16 - 58, f(α)-value of the region shown the eq.2 of the distribution curve of adenine bases, red diamond ♦; (b) Simian virus 40 genome (5243 nt). L = 1 - 10, f(α)-value of the region shown the eq.1 of the distribution curve of adenine bases, black square ■; L = 11 - 23, f(α)-value of the region shown the eq.2 of the distribution curve of adenine bases, red diamond ♦. The x axis (L) expresses the distance of a base(s) from the next appearance of the base in the genome sequence, and the y axis P(L) expresses the probability of the distribution function of the base(s) in the genome base sequence. W: The intercept of the tangent to the curve gives the value of y.
gave a straight line, y = Ux + W; U is the slope and W was the intercept) with a slope of –0.00004100 [expressed as −(4.10E-05)] (Figure 4(a), red diamond ♦).
The identification of multiple fractality in the base(s) in the S. cerevisiae genome was confirmed by the f(α) spectrum [92,93]. When f(α) varied as a function of α, the fractality must be multi-fractal (red diamond ♦); in contrast, when f(α) was constant at the α-value, the fractality must be uni-fractal (black square ■) [2,3].
When L was 1 through 15 (in the case of SV40, the genome-size was small, L = 1 - 10), f(α) was almost constant around 1.0 on α value (0.02 - 0.8, Figure 4), the fractal-index was uniform, “uni-fractal”. On the other hand, when the L value was more than 16 (L = 11 for SV40), f(α) varied from 2 to 4 depending on α value (0 - 0.0002, Figure 4), and the fractal-index was multiple, “multi-fractal”.
The other three bases, thymine “T”, guanine “G”, and cytosine “C” in the S. cerevisiae genome also behaved in a similar manner as “A”, with multiple fractality at the boundary of the L-value. In addition, the aand b-values of A and T, and G and C were identical. These fractal characteristics of a single-strand of DNA of the genome were also obtained for other species [2,3].
In contrast, in the artificial genome sequences, neither the bias of four bases on the genomes nor the multiple fractality were observed in the base(s) regardless of the distance in the base distribution (L-value = 16 or more). Thus, the bases of the counterfeit (artificial) sequence of genomes were distributed only uni-fractal even when L was more than 16, and the multiple fractality of the base sequences was not observed throughout the sequences, although the base numbers (nt) and the appearance frequencies of the base sequences were the same in each real (active) genome.
Many studies using a part of genomic DNA of E. coli and other model DNA sequences were reported that genomic DNA carried a fractality [94-97]. But, these studies might be analyzed based on the prokaryotic genomes, because the fractality of large genome such S. cerevisiae and H. sapiens genomes has not been analyzed yet in those days, and the multiple fractality might not be observed in the literatures previously published.
It should be noted that because in small genomes such as virus or eubacteria, the base numbers of the genome were not so many, and the reverse-complement symmetry was low little. Therefore, because the power-law-tail region was short, the multiple fractality might be hard to observe the genome at the same partition of the L-value (Table 2(b), Figure 4(b), SV40 = 5243 nt). However, essentially, all genomes or chromosomes might be maintained these three structural features, symmetry, bias, multiple fractality regardless of the size (the base number). In the case of SV40, it was better than to be partitioned at 10 of the L-value (Figure 4(b)) [3].
These three structural features of the single-strand DNA of genomes were able to observe only in the real (active) genome, but not observed in the individual gene, the short DNA or the random-ordered DNA such as the artificial chromosomes of the genome. When these three structural features were co-existed, the gene(s) on the genome could be able to express, and the resulted product(s) might be functioned timely and properly in the living cells. The bases of genomes were not placed randomly, but seem to be placed sophisticatedly by the generation-rules as a single-strand of genomic DNA in the individual living cells. It might be possible that two such structural-featured in a single-strand DNAs above described could be assembled to result in the anti-paralleled, complementary, double-strand DNA as we have known.
The structural features of a single strand of genomic DNA might have implications that affect DNA replication, transcription, translation, as well as other biological processes because the information might be present in genome base sequence [2,3].
Previously, Crick and his co-workers proposed a question about DNA structure [98,99]. They presented data to show that the base-sequence of the DNA was necessary to understand the detailed structure of DNA. Now we could speculate about the detailed structure of DNA molecules because the complete base sequences of several genomes were available.
Essentially, the reverse-complement symmetry in the base sequence should be observed anywhere on a singlestrand of DNA in a genome. The base symmetry in a single-strand of DNA in a genome was observed; in other words, the DNA might be able to be closed, and able to make stem-loop structures. Previously, the biological role of the non-coding sequences and stem-loop structures was discussed [42-46]. Now, the genome sequences of many organisms had been revealed, and we should analyze the genome to understand living organisms.
Therefore, to understand biological phenomena in living cells, we needed new approaches to analyze genomes including both the codingand the non-coding region as a large intact molecule.
Based on the above structural features of the genomic DNA, the Sequence Spectrum Method (SSM) was developed and proposed [4,5]. The SSM was a new analytical method of the entire genome based on the appearance frequencies of the nucleotides (bases) sequence of genome.
5. A NEW ANALYTICAL METHOD OF GENOME TO UNDERSTAND ORGANISMS
As described above, the four bases, A, G, C and T would be arranged sophisticatedly on genomic DNA [2,3]. The SSM was an analytical method of genome structure calculated the appearance frequency of the key base sequence in genome according to the structural features of the genome. A series of our studies on the analysis of the biological information, we had demonstrated that genomic DNAs were also arranged sophisticatedly in the structural features in a single-strand with 1) reversecomplement symmetry of base or 1 - 12 base sequences (Tables 1, 2), 2) bias of four bases (Figure 3), 3) multiple fractality of the distribution of each four bases depending on the distance in double logarithmic plot (power spectrum) of L (the distance of a base to the next base) vs. P(L) (the probability of the base-distribution at L) (Figure 4), although their genomes were composed of low numbers of the four bases, and the base-symmetry was rather lower than the prokaryotic and the eukaryotic cells including virus genomes (2 - 5).
The outline of SSM was as follows (2, 3). A given DNA base sequence in the genome could be converted to a spectrum based on the appearance frequencies of a given successive base sequences (key-sequence, d-value) (Figure 5). The key-sequence of Figure 5 was used three successive base sequence (triplet = genetic codon). In the figure, the vertical parameter of the sequence spectrum fsi was not designated, and it was scaled properly because the shape of the sequence spectrum only makes sense in this manuscript. The horizontal parameter was the base sequence number i (i = 1, ∙∙∙, M), and it was also omitted in the following figures because it was easily derived from the base sequence size M.
Controllable parameters in the sequence spectrum were the base size d of the key sequence, the average width m, and the size factor p (skipped base numbers). The parameter d determines the highest resolution for extracting the structural features of the base sequence. In this report, we used the key sequence as d = 3 (appearance frequency table of triplet, Table 2) for numerical experiments of the homologous structure discussed in the following sections.
In Figure 6, m = 10 (Figure 6(a)), mitochondrial targeting signal of F1α), m = 60 for a gene (Figure 6(b)), and m = 8000 for a chromosome (Figure 6(c)). The size factor p was adjusted to the base sequence size especially when the homology factor between a small reference and a large target was calculated. Figure 6(a) was shown the sequence spectrum of the mitochondrial targeting signal portion deduced from the base sequence of ATP1. Figure 6(c) was shown the sequence spectrum of S. cerevisiae chromosome II, i.e., Figures 6(a) and (b) could be compared about the F1α, protein, whereas, Figures 6(b) and (c) could be compared about the ATP1 and chromosome II. In other words, the base sequence on genome could be analyzed irrespective protein, DNA and RNA in SSM.
The possible appearance frequencies fi of key sequences ki were calculated for the entire set S in advance. The appearance frequency table depended on the entire
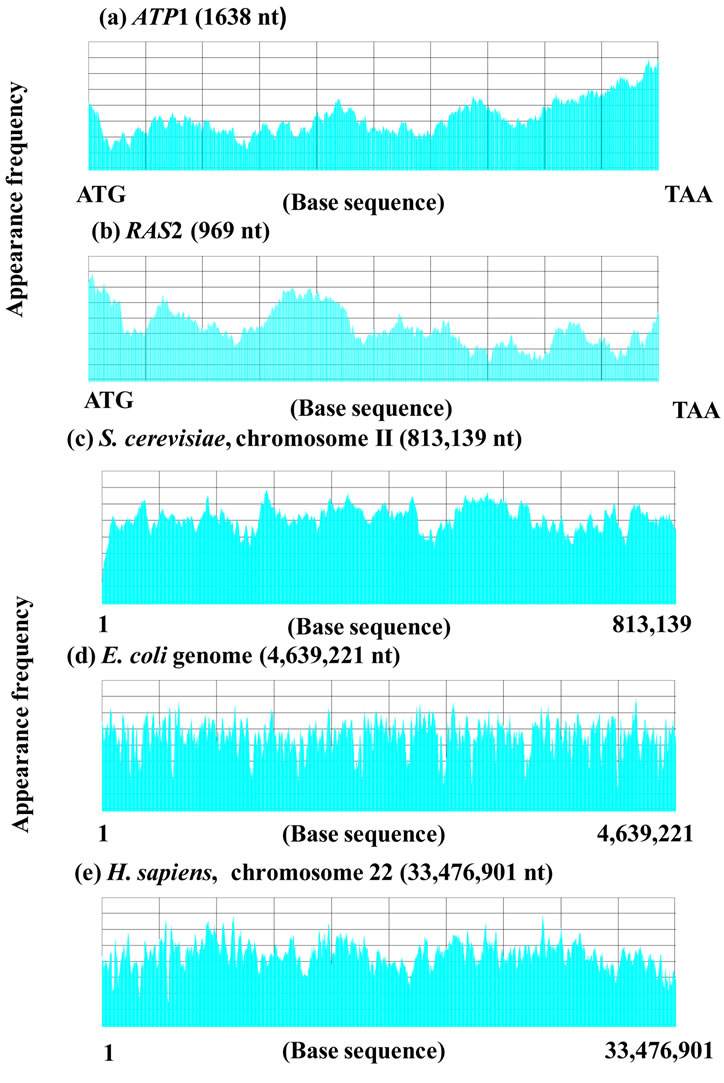
Figure 5. Sequence spectra of (a) ATP1, m = 60, d = 3, p = 3; (b) RAS2, m = 60, d = 3, p = 3; (c) Chromosome II (S. cerevisiae), m = 8000, d = 3, p = 100; (d) E. coli genome, m = 8000, d = 3, p = 100; (e) Chromosome 22 (H. sapiens), m = 8000, d = 3, p = 100.
set S, and in general S was the genome of the target species.
The key base sequence should be usually selected out of 1 - 12 successive base sequences according to the base numbers of the genomic DNA, and the biological phenomena. Three successive base sequences (d = 3, same as genetic codon) were used in the manuscript. As the sequence spectrum was homologous with the related region, the SSM could be applied the interaction with the base sequences of DNA [4,5]. Although its appearance was not aligned each the amino acid sequences, their spectra of the base sequences were homologous, and to be able to identify their interactive regions by SSM [2-5]. These analyses might presumably be related to the reverse-complement symmetry of the genome base sequences, and under the progress.
As the SSM faithfully reflected the biological information [1], the conservation of the bases sequences of genomic DNA was also conserved in the translated
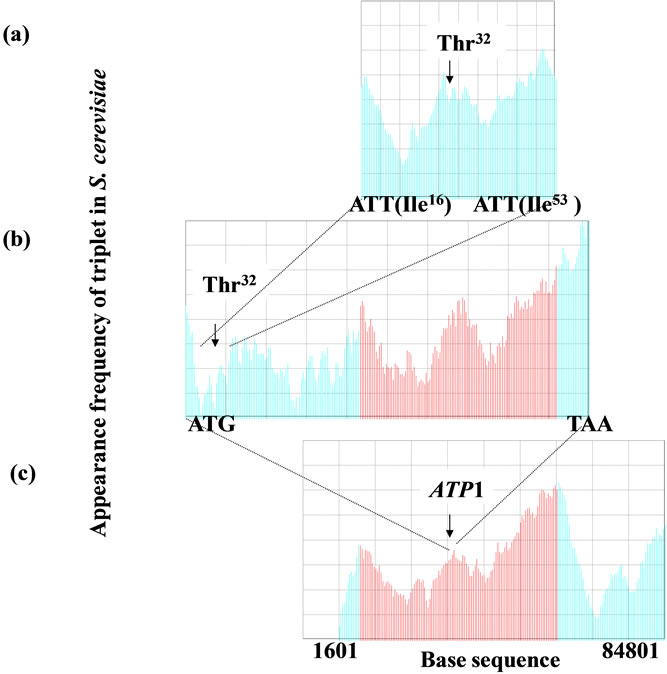
Figure 6. Homologous structure existed in the functionalregion in gene, protein (translated by the gene) and entire chromosome in the genome. The homology of the sequence spectrum was closely associated with the interaction of protein and DNA. (a) The base sequence of ATP1 gene (111 nt) translated the mitochondrial targeting signal of F1F0-ATPase complex α subunit (F1α), m = 10, p = 1; (b) ATP1 gene (1638 nt) was the structural gene of F1α subunit, m = 60, p = 7; (c) Chromosome II, m = 8000, p = 100. ATP1 gene was located in the left arm (83,200 nt. ca. 35,000 nt far from the left telomere) of chromosome II in the yeast Saccharomyces cerevisiae. The d-value (keysequence) was used as 3 in this manuscript.
amino acids sequence of the protein (Figure 6). Therefore, the SSM could be applied to identify the interactive region of DNA to DNA, or DNA to protein [2-5]. The appearance frequencies of three successive base sequences (d = 3) correspond directly to the species-dependent genetic codes (triplets) [2,3,66], which in turn correspond to the 20 amino acids. Because any genomic DNA had fractality (Figure 7) [2-5], any genes and chromosome could be analyzed by skipping base(s) optionally regardless the base numbers (DNA size). Therefore, the SSM could be useful to analyze not only the small virus-, and eubacteria-genomes, but also the huge chromosome such as mammalian and primates.
The biological phenomena might be reflected to the appearance frequency of the bases of genome. On considering so, various biological phenomena, especially the interactive-site of protein-protein and protein-DNA were analyzed using the SSM. The molar ratio of the four bases, A, T, G, C of genomic DNA in one organism was constant.
Based on the appearance frequency of the key sequences of the genome, and the structural features of genomic DNA, any DNA sequences on the genome could be expressed optionally as a sequence spectrum with the adjoining base sequences, which could be used to study the corresponding biological phenomena [2-5].
6. COMPLEXITY THROUGHOUT THE GENOME
The genome was a “field” of the various genes as described above. In prokaryotic cells, the genes were very crowded on the field; in addition, the intergenic region was smaller, and multiple fractality was hard to be observed, specifically the multi-fractality was hidden behind the uni-fractality. In prokaryotic cells, most of the genome was occupied the coding regions, whereas in eukaryotic cells the field was large, the genome was
 (a)
(a)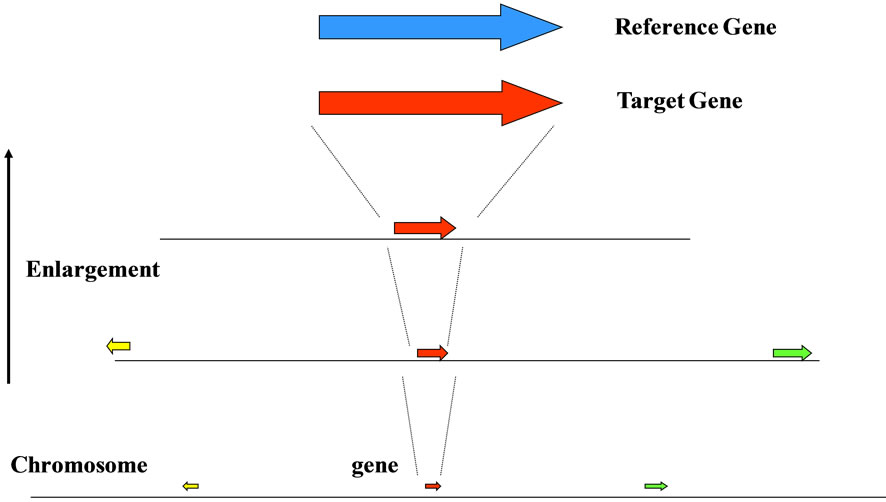 (b)
(b)
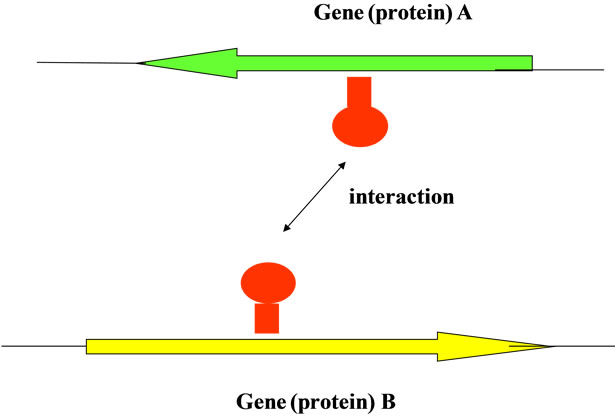
Figure 7. Interaction based on the structure (base sequence) of genome. (a) gene (protein) vs. chromosome; homologous structure between each interactive region according to the self-similarity (fractality) of the base sequence even the base sequence with the sizedifference; (b) gene a (protein a = reference) vs. gene b (protein b = target); the interactive region (red area) of a gene (a protein) were showed the homologous sequence spectrum of the base sequence appeared on the genomic DNA.
composed of a great number of bases, and the distance between genes was large. As a result, the multiple fractality, both the uni-fractality and the multi-fractality were clearly observed in the genome. The non-coding regions of the genome were composed of promoter, MAR, insulator, poly(A) signal sequence, SINE, LINE, ncRNA, intron and so on [69,73-78]. These elements were known as regulation of the gene-expression for the biological phenomena. The more complex the organisms were, the more the non-coding regions might be in genome [69,78]. In genome, including these regulatory elements of the gene-expression, the base sequences of the genomic DNA would be maintained the structural features, the reverse-complement symmetry, the bias, and the multiple fractality in a single-strand [2-5].
We could be tried to approach the studies targeted to the entire genome based on the appearance frequencies of the bases in genome, in other words, how to use the base sequence in genome. We have studied many, including the eukaryotes, prokaryotes, organelle and viruses, genome sequences down-loaded from the data bases like NCBI [44] and so on. We have calculated the base frequencies of the chromosomes in numeric order when there were several chromosomes in one organism. In addition, the reason for using chromosome in H. sapiens, the personal computer could not be calculated the sum of chromosomes 1 - 22, X and Y because of the limited capacity.
The genome data were drafted as described above, but most of the unreadable area was very small part compared with the huge entire chromosome. So, when there was unreadable region in chromosome, we could skip the region to calculate the base frequencies of the chromosome or genome because the unreadable region of each chromosome was small number of bases to neglect in comparison to large number of genomic DNA. The complexity of the organisms might be dependent on the capacity of the non-coding region in the entire genome.
7. ACKNOWLEDGEMENTS
The author wishes to thank to Dr. Masatoshi Nakahara for his critical reading and advice of this manuscript.
REFERENCES
- Crick, F.H.C. (1968) The origin of genetic code. Journal of Molecular Biology, 38, 367-379. doi:10.1016/0022-2836(68)90392-6
- Takeda, M. and Nakahara, M. (2009) Structural features of the nucleotide sequences of genomes. Journal of Computer Aided Chemistry, 10, 38-52. doi:10.2751/jcac.10.38
- Takeda, M. (2011) Structural features of the nucleotide sequences of virus and organelle genomes. Journal of Biomedical Science and Engineering, 4, 719-733. doi:10.4236/jbise.2011.411089
- Nakahara, M. and Takeda, M. (2010) Characterization of the sequence spectrum of DNA based on the appearance frequency of the nucleotide sequences of the genome—A new method for analysis of genome structure. Journal of Biomedical Science and Engineering, 3, 340-350. doi:10.4236/jbise.2010.34047
- Nakahara, M. and Takeda, M. (2010) Identification of the interactive region by the homology of the sequence spectrum. Journal of Biomedical Science and Engineering, 3, 868-883. doi:10.4236/jbise.2010.39117
- Takeda, M., Chen, W.-H., Saltzgaber, J. and Douglas, M.G. (1986) Nuclear genes encoding the yeast mitochondrial ATPase complex-analysis of ATP1 coding the F1-ATPase α-subunit and its assembly. Journal of Biological Chemistry, 261, 15126-15133.
- Takeda, M., Okushiba, T., Satoh, T., Kuniyoshi, S., Morishita, C. and Ichimura, Y. (1995) Three ATP1 genes are present on chromosome II in Saccharomyces cerevisiae. Journal of Biochemistry (Tokyo), 118, 607-613.
- Takeda, M., Satoh, H., Ohnishi, K., Satoh, T. and Mabuchi, T. (1999) The three copies of ATP1 gene are arranged in tandem on chromosome II of the yeast Saccharomyces cerevisiae S288C. Yeast, 15, 873-878. doi:10.1002/(SICI)1097-0061(199907)15:10A<873::AID-YEA427>3.0.CO;2-A
- Takeda, M., Nakamura, S. and Matsushita, S. (2010) Genome organization of the three identical ATP1 genes on the left arm of chromosome II of Saccharomyces cerevisiae—sequence analysis of the 35-kb region containing three ATP genes. TOGENJ, 3, 9-17. doi:10.2174/1875693X01003010009
- Takeda, M., Katayama, H., Satoh, T. and Mabuchi, T. (2005) The three copies of ATP2 gene are arranged in tandem on chromosome X of yeast Saccharomyces cerevisiae. Current Genetics, 47, 265-272. doi:10.1007/s00294-005-0565-5
- Ohnishi, K., Ishibashi, S., Kunihiro, M., Satoh, T., Matsubara, K., Oku, S., Ono, B., Mabuchi, T. and Takeda, M. (2003) Studies on the ATP3 gene of Saccharomyces cerevisiae: presence of two closely linked copies, ATP3a and ATP3b, on the right arm of chromosome II. Yeast, 20, 943-954. doi:10.1002/yea.1009
- Rothstein, R.J. (1983) One-step gene disruption in yeast. Methods in Enzymology, 101, 202-211. doi:10.1016/0076-6879(83)01015-0
- Takeda, M., Fujioka, H., Shimomura, M., Mabuchi, T. and Minami, A. (2011) ATP16 genes and neighboring ORFs are duplicated on chromosome IV in Saccharomyces cerevisiae. Journal of Molecular Biology Research, 1, 2-11. doi:10.5539/jmbr.v1n1p2
- Wilmut, I., Schnieke, A.E., McWhire, J., Kind, A.J. and Campbell, K.H.S. (1997) Viable offspring derived from fetal and adults mammalian cells. Nature, 385, 810-813. doi:10.1038/385810a0
- Wolf, P.L., Liggins, G. and Mercola, D. (1997) The cloning debates and progress in Biotechnology. Clinical Chemistry, 43, 2019-2020.
- Brenner, S.E. (1999) Errors in genome annotation. Trends in Genetics, 15, 132-133. doi:10.1016/S0168-9525(99)01706-0
- Devos, D. and Valencia, A. (2000) Practical limits of function prediction. Proteins, 41, 98-107. doi:10.1002/1097-0134(20001001)41:1<98::AID-PROT120>3.0.CO;2-S
- Olson, L.E., Richtsmeiser, J.T., Leszl, J. and Reeves, R.H. (2004) A chromosome 21 critical region does not cause specific Down syndrome phenotype. Science, 306, 687- 690. doi:10.1126/science.1098992
- Olson, L.E., Roper, R.J., Sengstaken, CL., Peterson, E.A., Aquino, V., Galzicki, Z., Slarey, R., Pletnikov, M., Moran, T.H. and Reeves, R.H. (2007) Trisomy for the Down syndrome “critical region” is necessary but not sufficient for brain phenotypes of trisomic mice. Human Molecular Genetics, 16, 774-782. doi:10.1093/hmg/ddm022
- Watson, J.D. and Crick, F.H.C. (1953) Genetical implications of the structure of deoxyribonucleic acid. Nature (London), 171, 964-967. doi:10.1038/171964b0
- Chargaff, E. (1950) Chemical specificity of nucleic acids and mechanism of their enzymatic degradation. Experimentia, 6, 201-240. doi:10.1007/BF02173653
- Franklin, R.E. and Gosling, R.G. (1953) Molecular configuration in sodium thymonucleate. Nature, 171, 740- 741. doi:10.1038/171740a0
- Feughelman, M., Langridge, R., Wilkins, M.H.F., Barclay, R.K. and Hamilton, L.D. (1955) Molecular structure of deoxyribose nucleic acid and nucleoprotein. Nature, 175, 834-838. doi:10.1038/175834a0
- Karkas, J.D., Rudner, R. and Chargaff, E. (1968) Separation of B. subtilis DNA into complementary strands. II. Template functions and composition as determined by transcription by RNA polymerase. Proceedings of National Academy of Science of the USA, 60, 915-920. doi:10.1073/pnas.60.3.915
- Gibson, D.G., Benders, G.A., Andrews-Pfannkoch, C., et al. (2008) Complete chemical synthesis, assembly, and cloning of a Mycoplasma genitalium. Science, 319, 1215- 1220. doi:10.1126/science.1151721
- Takai, D. and Jones, P.A. (2002) Comprehensive analysis of CpG islands in human chromosome 21 and 22. Proceedings of National Academy of Science of the USA, 99, 3740- 3745. doi:10.1073/pnas.052410099
- Saxonov, S., Berg, P. and Brutlag, D.L. (2006) A genome-wide analysis of CpG dinucleotides in the human genome distinguishes two distinct class of promoters. Proceedings of National Academy of Science of the USA, 103, 1412-1417. doi:10.1073/pnas.0510310103
- Hecht A., Strahl-Bolsinger, S. and Grunstein, M. (1996) Spreading of transcriptional repressor SIR3 from telomeric heterochromatin. Nature, 383, 92-96. doi:10.1038/383092a0
- Strahl, B.D. and Allis, C.D. (2000) The Language of covalent histone modifications. Nature, 403, 41-45. doi:10.1038/47412
- Lee, T.I., Rinaldi, N.J., Robert, F., et al. (2002) Transcriptional regulatory networks in Saccharomyces cerevisiae. Science, 298, 799-804. doi:10.1126/science.1075090
- Kloc, A., Zaratiegul, M., Nora, E. and Martienssen, R. (2008) RNA interface guide histone modification during the S phase of chromosomal replication. Current Biology, 18, 490-495. doi:10.1016/j.cub.2008.03.016
- Nègre, N., Brown, C.D., Ma, L., et al. (2011) A cisregulatory map of the Drosophila genome. Nature, 471, 527-531. doi:10.1038/nature09990
- Kasanski, A.L. and Slack, F.J. (2011) MicroRNAs en route to the clinic: progress in validating and targeting microRNAs for the cancer therapy. Nature Reviews Cancer, 11, 849-864. doi:10.1038/nrc3166
- Blattner, F.R., et al. (1997) The complete genome sequence of Escherichia coli K-12. Science, 277, 1453- 1462. doi:10.1126/science.277.5331.1453
- Kunst, F., Ogasawara, N., Moszer, I., et al. (1997) The complete genome sequence of the gram-positive bacterium Bacillus subtilis. Nature, 390, 249-256. doi:10.1038/36786
- Kaneko, T., Sato, S., Kotani, H., et al. (1996) Sequence analysis of the genome of the unicellular cyanobacterium Synechocystis sp. strain PCC6803. II. Sequence determination of the entire genome and assignment of potential protein-coding regions. DNA Research, 3, 109-136. doi:10.1093/dnares/3.3.109
- Mewes, H.W., Albermann, K., Bahr, M., Frishman, D., Gleissner, A., Hani, J., Heumann, K., Kleine, K., Maierl, A., Oliver, S.G., Pfeiffer, F. and Zollner, A. (1997) Overview of the yeast genome. Nature, 387, 7-65. doi:10.1038/42755
- The C. elegance Sequencing Consortium (1998) Genome sequence of the nematode C. elegance: A platform for investigating biology. Science, 282, 2012-2018. doi:10.1126/science.282.5396.2012
- Adams, M.D., Celniker, S.E., Holt, R.A., et al. (2000) The genome sequence of Drosophila melanogaster. Science, 287, 2185-2195. doi:10.1126/science.287.5461.2185
- Dunham, I., Shimizu, N., Roe, B.A., et al. (1999) The DNA sequence of human chromosome 22. Nature, 402, 489-495. doi:10.1038/990031
- Hattori, M., Fujiyama, A., Taylor, T.D., et al. (2000) Chromosome 21 mapping and sequencing consortium. The DNA sequence of human chromosome 21. Nature, 405, 311-319. doi:10.1038/35012518
- International Human Genome Sequencing Consortium (2001) Initial sequencing and analysis of the human genome. Nature, 409, 860-921. doi:10.1038/35057062
- Venter, J.C., Adams, M.D., Myers, E.W., et al. (2001) The sequence of the human genome. Science, 291, 1304- 1351. doi:10.1126/science.1058040
- NCBI Genome Data Base (2011). http://www.ncbi.nlm.nih.gov/sites/entrez?db=genome
- The Sanger Institute (2011). http://www.sanger.ac.uk
- Saccharomyces Genome Database (2011). http://www.yeastgenome.org/
- (1997) The yeast proteome handbook. 3rd edition, Proteome, Inc., Beverly.
- Velculescu, V.E., et al. (1997) Characterization of the yeast transcriptome. Cell, 88, 243-251. doi:10.1016/S0092-8674(00)81845-0
- Wan, X.F., VerBerkmoes, N.C., McCue, L.A., Stanek, D., Connlly, H., Hauser, L.J., Wu, L., Liu, X., Yan, T., Leaphart, A., Hettich, R.L., Zhou, J. and Thomson, D.K. (2004) Transcriptomic and proteomic characterization of the fur modulon in the metal-reducing bacterium Shewanella oneidensis. Journal of Bacteriology, 186, 8385- 8400. doi:10.1128/JB.186.24.8385-8400.2004
- Sakharkar, K.R., Sakharkar, M.K., Culiat, C.T., Chow, V.T. and Pervaiz, S. (2006) Functional and evolutionary analyses on expressed intronless genes in the mouse genome. FEBS Letters, 580, 1472-1478. doi:10.1016/j.febslet.2006.01.070
- Liu, C., Yang, Z., Yang, J., Xia, Z. and Ao, S. (2000) Regulation of the yeast transcription factor PHO2 activity by phosphorylation. Journal of Biological Chemistry, 275, 31972-31978. doi:10.1074/jbc.M003055200
- Yang, J. and Ao, S.Z. (1996) Interaction of the yeast PHO2 protein or its mutants with the PHO5 UAS in vitro. Sheng Wu Hua Xue Yu Sheng Wu Li Xue Bao (Shanhai), 28, 316-320.
- Shimizu, T., Toumoto, A., Ihara, K., Shimizu, M., Kyogoku, Y., Ogawa, N., Oshima, Y. and Hakoshima, T. (1997) Crystal structure of PHO4 bHLH domain-DNA complex: flanking base recognition. EMBO Journal, 16, 4689-4697. doi:10.1093/emboj/16.15.4689
- Bernardi, G. and Bernardi, G. (1986) Compositional constraints and genome evolution. Journal of Molecular Evolution, 24, 1-11. doi:10.1007/BF02099946
- Le, S-Y. and Maizei, J.V. (1989) A method for assessing the statistical significances of RNA folding. Journal of Theoretical Biology, 138, 495-510. doi:10.1016/S0022-5193(89)80047-5
- Prabhu, V.V. (1993) Symmetry observations in long nucleotide sequence. Nucleic Acids Research, 21, 2797- 2800. doi:10.1093/nar/21.12.2797
- Forsdyke, D.R. (1995a) A stem-loop “kissing” model for the initiation of recombination and the origin of intron. Moleclar Biology of Evolution, 12, 949-958.
- Forsdyke, D.R. (1995b) Reciprocal relationship between stem-loop potential and substitution density in retroviral quasispecies under positive Darwinian selection. Journal of Molecular Evolution, 41, 1022-1037. doi:10.1007/BF00173184
- Searls, D.B. and Murphy, K. (1995) Automatic-theoretic model of mutation and alignment. Proceedings of the Intelligent Systems Molecular Biology, 3, 341-349.
- Mitchell, D. (1997) GC content and genome length in Chargaff compliant genomes. Biochemical and Biophysical Research communications, 353, 207-210. doi:10.1016/j.bbrc.2006.12.008
- Mitchell, D. and Bridge, R. (1996) A test of Chargaff’s second rule. Biochemical and Biophysical Research communications, 340, 90-94. doi:10.1016/j.bbrc.2005.11.160
- Stern, L., Allison, L., Coppel, R.L. and Dix, T.I. (2001) Discovering patterns in Plasmodium falciparum genomic DNA. Molecular and Biochemical Parasitology, 112, 71- 77.
- Kanaya, S., Kinouchi, M., Abe, T., Kudo, Y., Yamada, Y., Nishi, T., Mori, H. and Ikemura, T. (2001) Analysis of codon usage diversity of bacterial genes with a self-organizing map (SOM): characterization of horizontally transferred genes with emphasisi on the E. coli O157 genome. Gene, 276, 89-99. doi:10.1016/S0378-1119(01)00673-4
- Baisnee, P-F., Hampson, S. and Baldi, P. (2002) Why are complementary DNA strands symmetric? Bioinformatics, 18, 1021-1033. doi:10.1093/bioinformatics/18.8.1021
- Chen, L. and Zhao, H. (2005) Negative correlation between compositional symmetries and local recombination rates. Bioinformatics, 21, 3951-3958. doi:10.1093/bioinformatics/bti651
- Albrecht-Buehler, G. (2006) Asymptotically increasing compliance of genomes with Chargaff’s second parity rules through inversions and inverted transpositions. Proceedings of National Academy of Science of the USA, 103, 17828-17833. doi:10.1073/pnas.0605553103
- Knoch, T.A., Göker, M., Lohner, R., Abuseiris, A. and Grosveld, F.G. (2009) Fine-structures multi-scaling longrange correlations in completely sequenced genomesfeatures, origin, and classification. European Biophysical Journal, 38, 757-779. doi:10.1007/s00249-009-0489-y
- Chor, B., Horn, D., Goldman, N., Levy, Y. and Massingham, T. (2009) Genomic DNA k-mer spectra: models and modalities. Genome Biology, 10, R108. doi:10.1186/gb-2009-10-10-r108
- Mattick, J.S. (2004) RNA regulation: a new genetics? Nature Reviews Genetics, 5, 316-323. doi:10.1038/nrg1321
- Haber, J.E. and Leung, W.Y. (1996) Lack of chromosome territoriality in yeast: promiscuous rejoining of broken chromosome ends. Proceedings of National Academy of Science of the USA, 93, 13949-13954. doi:10.1073/pnas.93.24.13949
- Rowley, J.D. (2001) Chromosomal translocations; dangerous liaisons revisited. Nature Reviews Cancer, 1, 245- 250. doi:10.1038/35106108
- Meaburn, K.J., Misteli, T. and Soutoglou, E. (2007) Spatial genome organization in the formation of chromosomal translocations. Seminars in Cancer Biology, 17, 80- 90. doi:10.1016/j.semcancer.2006.10.008
- Webb, C.F., Das, C., Eneff, K. and Tucker, P.W. (1991) Identification of a matrix-associated region 5’ of an immunoglobulin heavy chain variable region gene. Molecular and Cellular Biology, 11, 5206-5211.
- West, A.G., Gaszner, M. and Felsenfeld, G. (2002) Insulators: many functions, many mechanisms. Genes and Development, 16, 271-288. doi:10.1101/gad.954702
- Levine, M. and Tjian, R. (2003) Transcription regulation and animal diversity. Nature, 424, 147-151. doi:10.1038/nature01763
- Lai, E.C., Roegiers, F., Qin, X., Jan, Y.N. and Rubin, G.M. (2005) The ubiquitin ligase Drosophila mind bomb promotes notch signaling by regulating the localization and activity of serrate and delta. Development, 132, 2319-2332. doi:10.1242/dev.01825
- Martens, J.A., Wu, P.Y. and Winston, F. (2005) Regulation of an intergenic transcript controls adjacent gene transcription in Saccharomyces cerevisiae. Genes and Development, 19, 2695-2704. doi:10.1101/gad.1367605
- Taft, R.J., Pheasant, M. and Mattick, J.S. (2007) The relationship between non-protein-coding DNA and eukaryotic complexity. Bioessays, 29, 288-299. doi:10.1002/bies.20544
- Sollner-Webb, B. and Tower, J. (1986) Transcription of cloned eukaryotic ribosomal RNA genes. Annual Review of Biochemistry, 55, 801-830. doi:10.1146/annurev.bi.55.070186.004101
- Worton, R.G., Sutherland, J., Sylvester, J.E., Willard, H.F., Bodrug, S., Dube, I., Duff, C., Kean, V., Ray, P.N. and Schmickel, R.D. (1988) Human ribosomal RNA genes: Orientation of the tandem array and conservation of the 5’-end. Science, 239, 64-67. doi:10.1126/science.3336775
- Kataoka, T., Powers, S., McGill, C., Fasano, O., Strathern, J., Broach, J. and Wigler, M. (1984) Genetic analysis of the yeast RAS1 and RAS2 genes. Cell, 37, 437-445. doi:10.1016/0092-8674(84)90374-X
- Mabuchi, T., Ichimura, Y., Takeda, M. and Douglas, M.G. (2000) ASC1/RAS2 suppresses the growth defect on glycerol caused by the atp1-2 mutation in the yeast Saccharomyces cerevisiae. Journal of Biological Chemistry, 275, 10492-10497. doi:10.1074/jbc.275.14.10492
- Korenberg, J.R. and Engels, W.R. (1978) Base ratio, DNA content, and quinacrine-brightness of human chromosomes. Proceedings of National Academy of Science of the USA, 75, 3382-3386. doi:10.1073/pnas.75.7.3382
- Wada, A., Suyama, A. and Hanai, R. (1991) Phenomenological theory of GC/AT pressure on DNA base composition. Journal of Molecular Evolution, 32, 374-378. doi:10.1007/BF02101277
- Morton, B.R. (1995) Neighboring base composition and transversion/transition bias in a comparison of rice and maize chloroplast noncoding regions. Proceedings of National Academy of Science of the USA, 92, 9717-9721. doi:10.1073/pnas.92.21.9717
- MIPS data. (2010) The yeast genome project. http://www.mips.biochem.mpg.de/
- Grantham, R. (1980) Working of the genetic code. Trends in Biochemical Sciences (TIBS), 5, 327-331. doi:10.1016/0968-0004(80)90143-7
- Kanazawa, H., Kayano, T., Kiyasu, T. and Futai, M. (1982) Coupling factor F1-ATPase with defective subunit from a mutant of Escherichia coli. Biochemical and Biophysical Research Communication, 105, 1257-1264. doi:10.1016/0006-291X(82)90922-6
- Horii, T., Ogawa, T. and Ogawa, H. (1980) Organization of the recA gene of Escherichia coli. Proceedings of National Academy of Science of the USA, 77, 313-317. doi:10.1073/pnas.77.1.313
- Kaput, J. Goltz, S. and Blobel, G. (1982) Nucleotide sequence of the yeast nuclear gene for cytochrome c peroxidase precursor. Journal of Biological Chemistry, 257, 15054-15058
- Hase, T., Muller, U., Riezman, H. and Schatz, G. (1984) A 70-kd protein of the yeast mitochondrial outer membrane is targeted and anchored via its extreme amino terminus. EMBO Journal, 3, 3157-3164.
- Parisi, G. and Frisch, U. (1985) Turbulence and predictability of geophysical flows and climatic dynamics.
- Halsey, T.C., Jensen, M.H., Kadanoff, L.P., Procaccia, I. and Shraiman, B. (1986) Fractal measure and their singularities: the characterization of strange sets. Physical Review A, 33, 1141-1151. doi:10.1103/PhysRevA.33.1141
- Peng, C.K., Buldrev, S.V., Goldberger, A.L., Havlin, S., Sciortino, M., Simons, M. and Stanley, H.E. (1992) Longrange correlations in nucleotide sequences. Nature, 356, 168-170. doi:10.1038/356168a0
- Voss, R.F. (1992) Evolution of long-range fractal correlation and 1/f noise in DNA base sequences. Physical Review Letters, 68, 3805-3809. doi:10.1103/PhysRevLett.68.3805
- Bains, W. (1993) Local self-similarity of sequence in mammalian nuclear DNA is modulated by a 180 bp periodicity. Journal of Theoretical Biology, 161, 137-143. doi:10.1006/jtbi.1993.1046
- Weinberger, E.D. and Stadler, P.F. (1993) Why some fitness landscapes are fractal. Journal of Theoretical Biology, 163, 255-275. doi:10.1006/jtbi.1993.1120
- Crick, F.H.C. (1971) General model for the chromosomes of higher organisms. Nature, 234, 25-27. doi:10.1038/234025a0
- Crick, F.H.C, Wang, J.C. and Bauer, W.R. (1979) Is DNA really a double helix? Journal of Molecular Biology, 129, 449-461. doi:10.1016/0022-2836(79)90506-0