New Journal of Glass and Ceramics
Vol.06 No.03(2016), Article ID:67920,9 pages
10.4236/njgc.2016.63003
Thermoelectric Properties of ZnO-P2O5/(Ni) Composites
Omar Oabi1*, Abdelkarim Maaroufi1, Bruno Lucas2, Aumeur El Amrani3
1Laboratory of Composite Materials, Polymers and Environment, Department of Chemistry, Faculty of Sciences, University Mohammed V, Rabat-Agdal, Morocco
2XLIM UMR 6172-Université de Limoges/CNRS, Limoges Cedex, France 3LPSMS, FST Errachidia, University Moulay Ismail Meknès, Errachidia, Morocco

Copyright © 2016 by authors and Scientific Research Publishing Inc.
This work is licensed under the Creative Commons Attribution International License (CC BY).
http://creativecommons.org/licenses/by/4.0/


Received 24 February 2016; accepted 27 June 2016; published 30 June 2016
ABSTRACT
The overall purpose of the present study is basically to understand the manifestation of the thermo-electrical properties of the matrix ZnO-P2O5 first, and of the ZnO-P2O5 composites loaded with different volume fractions of nickel (Ni) as conductive fillers. In the matrix ZnO-P2O5, the values of electrical conductivity varied between 1.14 × 10⁻⁸ and 7.8 × 10⁻⁷ (S/cm), and the Seebeck coefficient value varied between minimal value 265 and maximal value 670 (µV/K) in the studied temperature. In composite ZnO−P2O5/Ni, it was shown that the Seebeck coefficient changed from high positive to negative values when the filler amount was increased, indicating a non-conducting to conducting phase transition. Such behavior exhibits that this transition is accompanied by the passing of carrier charge from p to n type. The study of thermoelectrically transport for high volume fraction of filler enabled the achievement, for the first time on this kind of composites, of an original transition called PTC transition. Thus, highest values of power factor (PF = sS2 ≈ 2 × 10⁻³ W・m−1・K−2 at 407 K) were obtained, giving a possibility of industrial applications.
Keywords:
Zinc Phosphate Glasses, Composites, Seebeck Coefficient, Power Factor

1. Introduction
The phosphate glasses are semiconducting materials, transforming it as conductive materials that can offer more opportunities of applications. And the zinc phosphate glasses are very studied for long time, but their use as composites is rare. For these reason we decide to prepare composites from this glass due to their special properties.
The study of material thermoelectric properties is among these objectives. The direct conversion between thermal energy and electric energy was discovered by Seebeck in 1882. Many applications were found to valorize this effect in thermoelectric power generation, microdevices, refrigeration etc. [1] - [4] . The performance of the thermoelectric material is measured with the figure of merit ZT = S2σT/κ or power factor PF = S2σ, where T is absolute temperature, S is Seebeck coefficient, σ is electrical conductivity and κ is thermal conductivity; the applications require ZT higher than 1. Thus, the challenge of researchers is to find a material showing a high Seebeck coefficient, a large electrical conductivity and a weak thermal conductivity to maximize ZT [2] [4] . Several approaches have been proposed to increase the figure of merit. These well-established approaches say traditional ones; the aim is to increase the power factor PF or reduce thermal conductivity by structural means to the atomic scale. The couple electrical-thermal properties remain high and thus a limit of the figure of merit is around the unit. The new approaches would promise a decoupling between electrical and thermal properties by using nanostructured materials that presented the related quantum effects at the nanoscale structures. Some works expect a sharp increase in the figure of merit. The factor of merit obtained with thin layers (i.e. superlattices) is about 2.5 [2] [5] .
The present study is to understand the manifestation of the thermo-electrical property of the of the ZnO-P2O5 matrix first, and ZnO-P2O5 composite loaded with different volume fractions of nickel (Ni) as conductive filler. It well known that in this composite system, a transition from insulator to conductor as the volume fraction of the conducting phase is increased. Particular attention is paid to study the parameter of the two phases. For this reason, various models have been proposed to account for the overall composite electrical properties. Good reviews of these models have been presented by the percolation theory in our further work [6] .
2. Experimental
2.1. Composite Preparation
The 45 mol% ZnO-55 mol% P2O5 matrix, was prepared using the classical quenching technique [6] [7] . Powder of ammonium di-hydrogen phosphate ((NH4) H2PO4 from Panreac type, 98%) and zinc oxide (ZnO from Panreac type, 99%) are mixed in adequate molar proportions. The obtained powder was put in alumina crucible and heated in furnace at 170˚C for 1 h and then at 300˚C for 12 h; in order to remove completely NH3 and H2O gases. Afterwards, the temperature was gradually increased to 950˚C, and the obtained melt was poured onto a preheated mould and left to cool at room temperature in air. Then, the particles of nickel (from Sigma-Aldrich with average particle size 149 μm, and a purity of 99.9%) are mixed in adequate proportions with zinc phosphate glass matrix. The obtained powder microcomposites were transferred into a cylindrical mould and pressed at 7 tons to decrease the porosity and to obtain fine compact discs, each one with 13 mm of diameter and 2 - 3 mm of thickness. The disks obtained were sintered at 300˚C for 2 hours in order to increase the cohesion of composites. Series of composites were prepared with filler contents ranging from 3 to 40 vol% into the matrix.
2.2. Scanning Electron Microscopy (SEM) with Energy Dispersive X-Ray (EDX) Measurement
Scanning Electron Microscopy (SEM) with Energy Dispersive X-ray (EDX) measurement has been used to identify and characterize the matrix. Scanning Electron Microscopy (SEM) studies have been undertaken to examine the morphology of matrix and homogeneity. Energy Dispersive X-ray (EDX) analysis was specially used to detect contaminant species: to obtain qualitative information on the full elemental composition of an unknown contaminant in the matrix.
2.3. X-Ray Diffraction (XRD) Measurement
The XRD measurements were carried by using a diffractometer BRAGG-BRENTANO equipped with a vertical goniometer θ-θ configuration with direct optical encoder for direct position feedback angular on the arms of the goniometer. The diffractometer is equipped with an X-ray tube with copper anticathode (λ = 1.54051 A˚). The data acquisition was carried out using a software-based data sheets ASTM (American Society for Testing and Materials).
2.4. Electrical Conductivity and Thermoelectric Power Measurements
The measurements of electrical conductivity (σdc) at room temperature were performed with a Keithley 224 current source and a Keithley 616 voltmeter, by four-point technique of Valdes [8] . The measurements of the conductivity and the Seebeck coefficient versus temperature were performed between 150 K and 450 K [9] . The operating conditions are mentioned in the previous work [7] . The Seebeck coefficient S is then determined by the below equation:
 (1)
(1)
where, ΔT and ΔV are the difference of temperature and the difference of potential respectively, between two points of the sample.
2.5. Volume Expansion Measurements
The volume expansion of the composites was obtained with a SETARAM TMA 92 thermo-mechanical analyzer, using a programmed heating rate of 2 K/min in a temperature range varying from 300 to 500 K.
3. Results and Discussions
3.1. Matrix ZnO-P2O5
・ Structural characterization
The binary phosphate glasses of molar composition 45 mol% ZnO-55 mol% P2O5 were synthesized. After cooling the melts, the glass was homogenous, transparent, colorless, and amorphous. In Figure 1, although the micrograph of the matrix exhibits small cracks and some holes, the material might be considered as quite homogenous, and we have showed in the previous work that the matrix presents the lowest value of porosity approximately 11% [6] .
The Energy Dispersive X-ray (EDX) analysis showed a good purity in the composition of matrix. Their amorphous nature was confirmed by X-ray diffraction in Figure 2. No crystalline phases were detected in the produced glasses. The X-ray pattern, measured at room temperature for the glass matrix for instance, displays a broad halo peak only and no sharp peaks. The broad halo peak culminates at 2θ = 30˚. The same phenomenon was observed for glass treated at 400˚C (curve (ii) in Figure 2). However, for the glass treated at a temperature of 500˚C, we have obtained crystalline phases (curve (iii) in Figure 2). The effect of sintering temperature is an important parameter, which is why we chose the temperature 300˚C (curve (i) in Figure 2) for sintering composite to prevent crystallization. Thus, as the temperature increase, we can see more the pseudo-peaks occur above
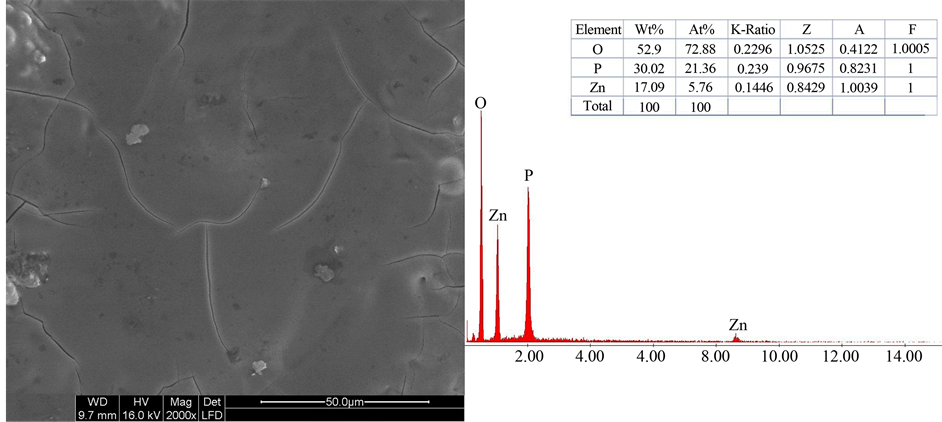
Figure 1. SEM micrograph (×2000) of matrix 45 mol% ZnO-55 mol% P2O5 with corresponding EDX and constituent percents.

Figure 2. X-ray diffractograms of matrix 45 mol% ZnO-55 mol% P2O5. (i): treated at a temperature of 300˚C; (ii): treated at a temperature of 450˚C; (iii): treated at a temperature of 500˚C.
400˚C and crystalline phase completely is obtained at temperature 500˚C. This could be understood by a thermodynamic approach [10] . Indeed, it is known when the temperature of a system increase, its kinetic energy increase and hence the movement of the particles forming this system is increased. The system will then evolve into a situation that will minimize its energy. The amorphous phase is metastable and therefore unfavorable for this trend state. As against, the ordered state of a crystalline phase is a state that will promote long-distance exchanges and lead to energy minimization and an equilibrium state. One can therefore understand why when the temperature is increased beyond a critical value, the studied glass crystallizes. In order to understand the structure of phases obtained, DSC and DTA measurements were performed in our previous work [6] . The determination of Tg from DTA was confirmed by the DSC technique, which is more accurate. In fact, Tg was clearly observed at 43˚C. This value is in good agreement with that reported in the literature for close composition [8] [9] . It has been proved that for good glass forming system the values of Kgl ≥ 0.1 [11] . The Kgl value obtained, from both DTA and DSC for the present composition is around 0.85 [6] . This confirms that the glass matrix is characterized by good glass forming ability. For this reason, the zinc phosphate glass matrix (45 mol% ZnO-55 mol% P2O5) is used because it showed a good thermal stability.
・ Electrical conductivity of matrix
In this study, to get correlation between structural characteristic and physical properties, the electrical conductivity of amorphous ZnO-P2O5 matrix has measured in the temperature range (300 - 400 K). Figure 3(a) shows the increase of conductivity as a function of temperature. The values of electrical conductivity varied between 1.14 × 10⁻⁸ and 7.8 × 10⁻⁷ (S/cm). In order to understand the mechanism of conduction, and to explain the electrical conductivity in amorphous matrix, we have plotted the variation of ln(σ) vs 1/T. In this case, different behaviors have been observed as a function of temperature and depending upon the distribution of energies in these localized state bands. Thus, the data were fitted with Arrhenius law:
 (2)
(2)
where σo is the conductivity of the matrix at room temperature, E0 is the activation energy for hopping, k the Boltzmann constant and T absolute temperature. The linear fit of the conductivity data versus (1/T) (Figure 3(b)) gives three different values of activation energies 0.63, 0.33 and 0.13 eV for T ≤ 340 K, T = 340 - 380 K and T > 380 K, respectively. These results signified that, the electrical conductivity increase and the activation energy decrease in the range studied. This shows good consistency with Arrhenius law, confirming the thermally activated hopping mechanism at high temperature between localized states near the Fermi level and in the tails of conduction and valence bands. The corresponding activation energies show that the values in the same orders were obtained in similar other classical phosphate glasses [12] - [15] .
・ Thermoelectric power characterization of matrix

Figure 3. (a) Electrical conductivity of 45 mol% ZnO-55 mol% P2O5 versus temperature. (b) Plot of electrical conductivity versus the inverse of temperature (1/T) and linear fit (─) with Equation (2).
In amorphous materials, the thermoelectric power is an important property to determine the charge carriers. The thermoelectric power is given by the general expression [16] :
 (3)
(3)
The above expression can be integrated as follow:
 (4)
(4)
 (4)’
(4)’
where K is Boltzman’s constant, Ec is the position of the band edge, Ev the valence band edge. Av and Ac are temperature independents. The sign of thermopower is depend of the mechanism of conduction above or below the Fermi level [16] . The negative value of Seebeck indicate n-type, and the positive value of indicate p-type. The thermoelectric power versus temperature in ZnO-P2O5 matrix is showed in Figure 4(a). The Seebeck coefficient value varied between minimal value 265 and maximal value 670 (µV/K), that indicated the matrix is p-type. These values are compared with that obtained in xCdO:(50-x)PbO:50V2O5 [17] . Indeed, from the Equation (4), the plot of thermoelectric power (S) as a function of temperature (1/T) shows two region of temperature (Figure 4(b)). The value of activation energies obtained by linear fit of (S = 1/T) are 0.39 and 0.90 (eV) for T = 320 K and T > 320 K, respectively. These values are in good agreement with the electrical conductivity. The activation energies of S and σ indicate that for this material there is low thermal activation at temperature T > 380 K compared with low temperatures (<380 K). The positive value of Seebeck indicate that a contribution to hole conduction in ZnO-P2O5 glass matrix, and can be assumed to be caused by the trapping of holes on Zn-O bonds. Indeed, the electrical conduction takes place by hopping between first neighbors’ localized states near the Fermi level and in the tails of valence and conduction bands [18] [19] .
3.2. ZnO-P2O5/Ni Composite
In our study, we have just determined electrical conductivity and thermopower measurements, to calculate a part of the figure of merit, i.e. power factor (PF), with the following formula:
 (5)
(5)
The power factor (PF) can be used as an index for thermoelectricity. This value gives us information on the figure of merit ZT, which a high ZT indicates a high thermoelectric efficiency.
The zinc phosphate glass in this study is chosen because of its good glass forming ability and good chemical durability, but the PF obtained is about 2 × 10⁻¹³ W/m・K2. This value is not sufficient and very low for application

Figure 4. (a) Variation of Seebeck coefficient with temperature for 45 mol% ZnO-55 mol% P2O5. (b) Plot of Seebeck coefficient versus the inverse of temperature (1/T) and linear fit (──) with Equation (4)’.
and needs improvement. For these reason we decide to prepare composites from this glass due to their special properties. The measurements of electrical conductivity and thermoelectric power of composites were achieved in this study. We have calculate the PF of composite as function of volume fraction of Nickel (from 3 to 40 vol.%) at room temperature, and as a function of temperature for composite 40 vol.% of Ni.
・ Power factor versus volume fraction measurements
The Figure 5 gives the power factor PF versus filler volume fraction (ϕ) at room temperature for 45 mol% ZnO-55 mol% P2O5 (ZP) loaded with Ni particles. The measurements of the electrical conductivity showed a jump from 10−8 to ~1 S/cm, indicating a non-conducting to conducting phase transition at percolation threshold of ϕc = 28 vol.%, when an infinite conductive path of clusters is formed. In addition, the Seebeck coefficients data are also reported and the percolating behavior is confirmed with theses measurement. The conduction threshold is almost the same as the one obtained with conductivity. Moreover, the Seebeck coefficient (S) changes its sign from positive to negative for low and high level filling, respectively. Indeed, below percolation threshold, high positive values over 3000 μV/K are obtained with a low conductivity (σ = 10−8 S/cm). Then, above close to the percolation threshold (ϕ = 30 vol.%), S becomes negative (S = −100 μV/K) corresponding to σ = 1 S/cm. For high amounts of Ni, S increases to typically metallic values (between −10 and −20 μV/K). This behavior indicates a passing from p to n semiconductor material type or insulator/conductor phase transition, in good agreement with conductivity results. The corresponding power factor PF jumps at percolation threshold and takes the values greater than 10−8 W/m・K2 (Figure 5).
・ Power factor versus temperature measurements
The power factor (PF) as function of temperature for the composite 40 vol.% of Ni, are showed in Figure 6. Transitions of the PF values have been observed in this figure. The transition is due to both phenomena; the positive temperature transition (PTC) and Seebeck transition. The PTC of the composite is characterized by a large decrease in electrical conductivity during heat of composite. The origin of PTC effect is not very clear, it is generally accepted that it manifested by a breach of the conductor network during heating of sample. Several theories have been proposed to explain the behavior of this nonlinear phenomenon depending on the temperature, such as thermal expansion, electron tunneling, etc. Nevertheless, these theories are still unable to give a clear explanation to experimental results. It has been often accepted in the literature that the PTC effect resulting from a disturbance in the continuity of the conductive network is mainly due to volume expansion of the matrix [20] [21] .
In our study, the measurements of the volume expansion of composite 40 vol.% of Ni as function of temperature. Figure 7 shows that the volume expansion of composite increases with temperature between 300 to approximately 407 K (expansion), corresponding to the PTC transition and then, it decreases. Thermoelectric behavior is investigated with the Seebeck measurements. The PTC transition achieved in this composite is confirmed by the measure of Seebeck coefficients at the same temperature 420 K. The origin of the Seebeck transition is maybe due to migration of negative oxygen ions (O−), which are more probably originates from the residual vacuum in the chamber. It reacts with the material surface following a chemisorption process. The power factor obtained is about 2 × 10⁻³ W/m・K2 at 407 K. As we compare this value with others materials in literature [22] - [27] , it can give a possibility of industrial applications.

Figure 5. Volume fraction dependence of the power factor of ZnO-P2O5/ Ni composites. The inserts are variation of the both electrical conductivity and Seebeck coefficient versus volume fraction.

Figure 6. Temperature dependence of the power factor of ZnO-P2O5/40 vol.% of Ni composites. The inserts are variation of the both electrical conductivity and Seebeck coefficient versus temperature.
4. Conclusions
The result obtained in this study by conductivity σ and thermoelectric power S measurement shows as follows:
・ Structural characterization by SEM and XRD of binary phosphate glasses 45 mol% ZnO-55 mol% P2O5 shows homogenous and amorphous phases.
・ The conductivity of this amorphous phases increases with increase in temperature. In addition, the electrical conductivity increase and the activation energy decrease in the range studied of temperature. And the plot of both conductivity and Seebeck coefficient versus temperature follows Arrhenius relation.
・ For the composite ZnO-P2O5/Ni, the electrical conductivity measurements showed percolating transition from a non-conducting to conducting phase as a function of metal filled. And the change of S from high positive to negative values exhibits that this transition is accompanied by the passing of carrier charge from p-type to n-type. The values of Seebeck coefficient measured are large and confirm the conductivity results.

Figure 7. Temperature dependence of volume expansion of ZnO-P2O5/40 vol.% of Ni composites.
・ Highest value of power factor was obtained giving a possibility of industrial applications in thermoelectricity and solar cell devices.
Acknowledgements
This work was realized in the frame of the scientific projects (SPM10/10, 11) supported by the collaboration of Centre National pour la Recherche Scientifique et Technique (CNRST), Morocco and Centre National de la Recherche Scientifique (CNRS), France. These organisms are gratefully acknowledged for partial financial support.
Cite this paper
Omar Oabi,Abdelkarim Maaroufi,Bruno Lucas,Aumeur El Amrani, (2016) Thermoelectric Properties of ZnO-P2O5/(Ni) Composites. New Journal of Glass and Ceramics,06,19-27. doi: 10.4236/njgc.2016.63003
References
- 1. Nolas, G.S. Sharp, J. and Goldsmid, H. (2001) Thermoelectrics: Basic Principles and New Materials Developments. Springer, New York. http://dx.doi.org/10.1007/978-3-662-04569-5
- 2. Venkatasubramanian, R. Siivola, E. Colpitts, T. and O’Quinn, B. (2001) Thin-Film Thermoelectric Devices with High Room-Temperature Figures of Merit. Nature, 413, 597-602. http://dx.doi.org/10.1038/35098012
- 3. Tritt, T.M. (2002) Thermoelectric Materials: Principles, Structure, Properties, and Applications. Encyclopedia of Materials: Science and Technology, 2nd Edition, 1-11. http://dx.doi.org/10.1016/b0-08-043152-6/01822-2
- 4. Minnich, A.J. Dresselhaus, M.S., Ren, Z.F. and Chen, G. (2009) Bulk Nanostructured Thermoelectric Materials: Current Research and Future Prospects. Energy & Environmental Science, 2, 466-479. http://dx.doi.org/10.1039/b822664b
- 5. Harman, T.C. Walsh, M.P., Laforge B.E. and Turner, G.W. (2005) Nanostructured Thermoelectric Materials. Journal of Electronic Materials, 34, L19-L22. http://dx.doi.org/10.1007/s11664-005-0083-8
- 6. Maaroufi, A., Oabi, O., Pinto, G., Ouchetto, M., Benavente, R. and Perena, J.M. (2012) Electrical Conductivity of New zinc Phosphate Glass/Metal Composites. Journal of Non-Crystalline Solids, 358, 2764-2770. http://dx.doi.org/10.1016/j.jnoncrysol.2012.06.028
- 7. Maaroufi, A., Oabi, O., Lucas, B., El Amrani, A. and Degot, S. (2012) New Composites of ZnO-P2O5/Ni Having PTC Transition and High Seebeck Coefficient. Journal of Non-Crystalline Solids, 358, 3312-3317. http://dx.doi.org/10.1016/j.jnoncrysol.2012.09.003
- 8. Smits, F.M. (1958) Measurement of Sheet Resistivities with the Four-Point Probe. Bell System Technical Journal, 37, 711-718. http://dx.doi.org/10.1002/j.1538-7305.1958.tb03883.x
- 9. Moreau, C., Antony, R., Moliton A. and Francois, B. (1997) Sensitive Thermoelectric-Power and Conductivity Measurements on Implanted Polyparaphenylene Thin-Films. Advanced Materials for Optics and Electronics, 7, 281-293. http://dx.doi.org/10.1002/(SICI)1099-0712(199711/12)7:6<281::AID-AMO314>3.0.CO;2-K
- 10. Rao, K.J. (1984) Glass Transition. A New Approach Based on Cluster Model of Glasses. Proceedings of the Indian Academy of Sciences—Chemical Sciences, 93, 389-406.
- 11. Dong-Sook, S. (1996) Electrical Properties of p-NiO/n-ZnO Two-Phase Mixtures. Solid State Ionics, 83, 333-348. http://dx.doi.org/10.1016/0167-2738(96)00010-0
- 12. Hussein, A., Higazy, A.A. and Ewaida, M.A. (1989) Gamma-Ray Dosimetric Properties of Molybdenum Phosphate Glasses. Journal of Materials Science, 24, 457-461. http://dx.doi.org/10.1007/bf01139067
- 13. Oine, T., Maeda, H., Tsuzuki, T., Nakayama M. and Kasuga, T. (2015) Relationship between Electrical Conductivities and Structure of Hybrid Materials Derived from Mixtures of Zinc Phosphate Glasses with Different Phosphate-Chain Lengths and Benzimidazole. Journal of Solid State Electrochemistry, 19, 907-912. http://dx.doi.org/10.1007/s10008-014-2677-7
- 14. Altaf, M., Chaudhry, M.A. and Siddiqi, S.A. (2001) DC Electrical Conductivity of Li2O-CdO-P2O5 Glasses. Materials Chemistry and Physics, 71, 28-33. http://dx.doi.org/10.1016/s0254-0584(00)00520-4
- 15. Mogus-Milankovic, A., Santic, A., Licina, V. and Day, D.E. (2005) Dielectric Behavior and Impedance Spectroscopy of Bismuth Iron Phosphate Glasses. Journal of Non-Crystalline Solids, 351, 3235-3245. http://dx.doi.org/10.1016/j.jnoncrysol.2005.08.011
- 16. Fritzsche, H.A. (1971) A General Expression for the Thermoelectric Power. Solid State Communications, 9, 1813-1815. http://dx.doi.org/10.1016/0038-1098(71)90096-2
- 17. Rao, P.T., Ramesh, K.V. and Sastry, D.L. (2012) Electrical and Spectroscopic Studies of the CdO Substituted Lead Vanadate Glass System vs Crystalline Form. New Journal of Glass and Ceramics, 2, 34-40. http://dx.doi.org/10.4236/njgc.2012.21006
- 18. Mott, N.F. (1968) Conduction in Glasses Containing Transition Metal Ions. Journal of Non-Crystalline Solids, 1, 1-17. http://dx.doi.org/10.1016/0022-3093(68)90002-1
- 19. Ramesh, K.V. and Sastry, D.L. (2006) Transport Properties of ZnO Substituted Lead Vanadate Glass System at Eutectic Composition. Materials Science and Engineering: B, 126, 66-73. http://dx.doi.org/10.1016/j.mseb.2005.08.111
- 20. Zhao, Z., Yu, W., He, X. and Chen, X. (2003) The Conduction Mechanism of Carbon Black-Filled Poly(vinylidene fluoride) Composite. Materials Letters, 57, 3082. http://dx.doi.org/10.1016/S0167-577X(02)01440-4
- 21. Yi, X.S., Shen, L. and Pan, Y. (2001) Thermal Volume Expansion in Polymeric PTC Composites: A Theoretical Approach. Composites Science and Technology, 61, 949-956. http://dx.doi.org/10.1016/S0266-3538(00)00191-3
- 22. Cai, K.F., Müller, E., Drasar, C. and Mrotzek, A. (2003) Preparation and Thermoelectric Properties of Al-Doped ZnO Ceramics. Materials Science and Engineering: B, 104, 45. http://dx.doi.org/10.1016/S0921-5107(03)00280-0
- 23. Cai, K.F., Müller, E., Drasar, C. and Mrotzek, A. (2003) Sol-Gel Processing of ZnO-Coated TiB2 Composite Powders. Materials Letters, 57, 4251-4255. http://dx.doi.org/10.1016/S0167-577X(03)00299-4
- 24. Cheng, H., Xu, X.J. and Hng, H.H. (2009) Characterization of Al-Doped ZnO Thermoelectric Materials Prepared by RF Plasma Powder Processing and Hot Press Sintering. Ceramics International, 35, 3067-3072. http://dx.doi.org/10.1016/j.ceramint.2009.04.010
- 25. Colder, H., Guilmeau, E., Harnois, C., Marinel, S., Retoux, R. and Savary, E. (2011) Preparation of Ni-Doped ZnO Ceramics for Thermoelectric Applications. Journal of the European Ceramic Society, 31, 2957. http://dx.doi.org/10.1016/j.jeurceramsoc.2011.07.006
- 26. Liang, X. and Clarke, D.R. (2014) Relation between Thermolectric Properties and Phase Equilibria in the ZnO-In2O3 Binary System. Acta Materialia, 63, 191-201. http://dx.doi.org/10.1016/j.actamat.2013.10.027
- 27. Liu, W., Kim, H.S., Jie, Q. and Ren, Z. (2016) Importance of High Power Factor in Thermoelectric Materials for Power Generation Application: A Perspective. Scripta Materialia, 111, 3-9. http://dx.doi.org/10.1016/j.scriptamat.2015.07.045
NOTES

*Corresponding author.