New Journal of Glass and Ceramics
Vol.3 No.4(2013), Article ID:38263,5 pages DOI:10.4236/njgc.2013.34016
Kinetics of Phase Transformations and Thermal Stability of GexSe70Sb30−x (x = 5, 10, 15, 20) Chalcogenide Glasses
![]()
Semi-Conductor & Polymer Science Laboratory, Department of Physics, University of Rajasthan, Jaipur, India.
Email: anu.spsl@gmail.com
Copyright © 2013 Anusaiya Kaswan et al. This is an open access article distributed under the Creative Commons Attribution License, which permits unrestricted use, distribution, and reproduction in any medium, provided the original work is properly cited.
Received May 6th, 2013; revised June 6th, 2013; accepted June 13th, 2013
Keywords: Glass Transition Region; Differential Scanning Calorimetry; Activation Energy; Thermal Stability
ABSTRACT
Kinetic studies of two-phase transformations i.e. glass transition and crystallization for GexSe70Sb30−x (x = 5, 10, 15, 20) glasses have been performed using differential scanning calorimetry (DSC) at different heating rates under non-isothermal condition. The glass transition and crystallization regions have been investigated in terms of their characteristic temperatures i.e. glass transition temperature Tg and crystallization temperature Tc and activation energy. The activation energies of glass transition and crystallization have been calculated by employing peak shift method of Kissinger and isoconversional methods. Activation energies have been found to be dependent on the composition. The thermal stability is determined from the temperature difference ΔT = Tc − Tg where Tc and Tg are the onset crystallization and glass transition temperature respectively. It has been found that Ge15Se70Sb15 glass is thermally more stable as compared to the other members of the series.
1. Introduction
Among amorphous semiconducting materials, chalcogenide glasses containing a large amount of chalcogen atoms sulphur, selinium and tellurium have drawn great attention because of their broad applications in technological field such as memory devices and fiber optics. Selinium is an attractive material in optical memory devices due to its uniqueness of reversible transformation [1]. But pure Se has certain disadvantages like short lifetime and low stability. To improve these parameters certain other elements are added [2]. The Ge-Se-Sb alloys have good glass formation ability over a wide compositional range. This makes them good candidates as arsenic free IR transparent materials [3,4]. The Ge-Se-Sb glasses are used for fabrication of optical components like IR lenses for their transparency in the 2 μm to 16 μm wavelength region [5-7]. The aim of the present paper is to analyze the dependence of characteristic temperatures Tg, Tc and the activation energy on heating rate as well as composition respectively. An effort has also been made to determine the thermal stability of Ge-Se-Sb glasses.
2. Experimental Details
High purity (99.999%) Germenium, Selinium and Antimony were weighed and the weighed materials are then introduced into clean quartz ampoules with appropriate atomic weight percentage. The contents of the ampoule were sealed in vaccum of 10−6 torr and then heated in furnace where temperature was raised at a rate of 3 - 4 K∙min−1 up to 925˚C. The contents were kept around that temperature for 12 - 14 hours with continuous rotation to ensure the homogeneity of the sample. The melton sample was rapidly quenched in ice-cooled water to get glassy state. The ingot of so produced glassy samples were taken out of the ampoule by breaking the ampoule and then grinded gently in mortar and pestle to obtain powder form.
The glasses are amorphous material therefore amorphous nature of these samples was characterized by Xray diffraction pattern using Bragg-Brentano geometry on a Panalytical X’pert Diffractometer with a Cu Kα radiation source (1.5406 Å).
The calorimetric measurements were carried out using differential scanning calorimetery (Rigaku DSC-8230) with an accuracy of ±0.1 K. 10 mg powdered samples were crimped into aluminium pans and scanned at different (10, 15, 20, 25 and 30 K∙min−1) heating rates.
3. Result and Discussion
Figure 1 shows the DSC thermograms of GexSe70Sb30−x (x = 5, 10, 15, 20) chalcogenide glasses at a heating rate of 10 K∙min−1. It has been observed that each thermogram except for Ge20Se70Sb10 represents two well-defined peaks. The first one is endothermic peak correspon ding to the glass transition region and other is exothermic peak corresponding to crystallization region. Figure 2 shows the DSC thermograms of Ge5Se70Sb25 with different heating rates (10, 15, 20, 25 and 30 K∙min−1). It has been observed from Figure 2 that both glass transition and crystallization temperatures shift towards the higher temperature side with the increase of heating rate.
3.1. Kinetics of Glass Transition Region
The study of the glass transition region for GexSe70Sb30−x

Figure 1. DSC thermograms of GexSe70Sb30−x (x = 5, 10, 15, 20) chalcogenide glasses at a heating rate of 10 K∙min−1.
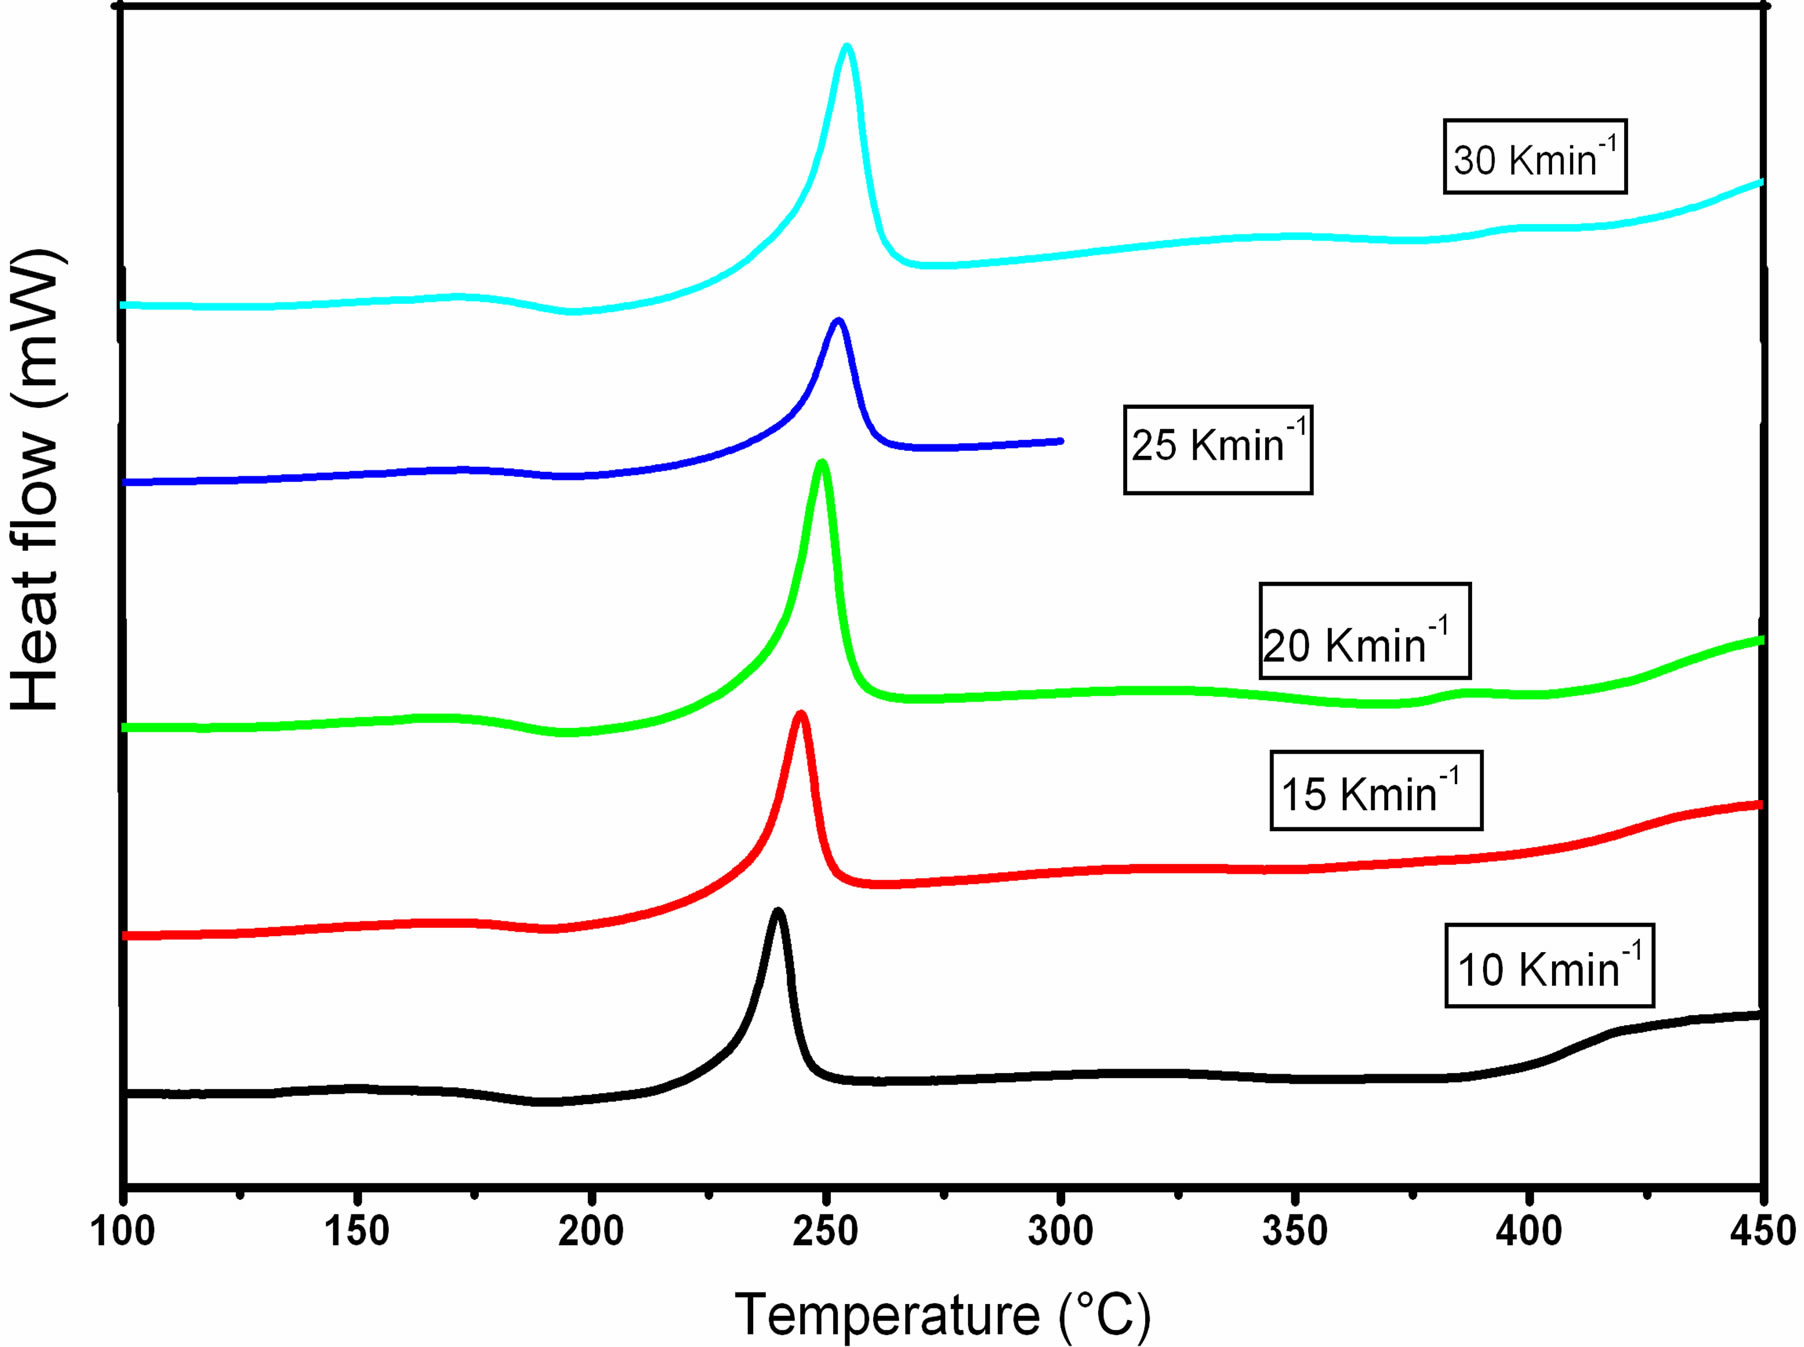
Figure 2. DSC thermograms of Ge5Se70Sb25 with different heating rates (10, 15, 20, 25 and 30 K∙min−1).
(x = 5, 10, 15, 20) alloys has been made in terms of variation of glass transition temperature and activation energy with different heating rates and different compositions. The values of onset and peak glass transition and crystallization temperatures for all the compositions of the glassy materials at a heating rate of 10 K∙min−1are given in Table 1 respectively.
The glass transition temperature represents the strength of the glassy structure of the alloy. The variation of glass transition temperature with heating rate (β) has been explained on the basis of empirical relation proposed by Lasocka [8] as given below.
 (1)
(1)
where A and B are constants for a given sample. The value of A indicates the glass transition temperature for the heating rate 1 K∙min−1 and B indicates time which is taken by the system to reduce the glass transition temperature when heating rate decreased from 10 K∙min−1 to1 K∙min−1. Plots of Tg versus Lnβ are shown in Figure 3 for GexSe70Sb30−x (x = 5, 10, 15, 20) glassy samples. The slopes and intercepts of the plots (straight lines) give the values of B and A respectively. The values of A and B for different compositions of glassy alloys are given in Table 2. It is obvious from Figure 3 that Tg increases for all the values of x with increasing heating rate.
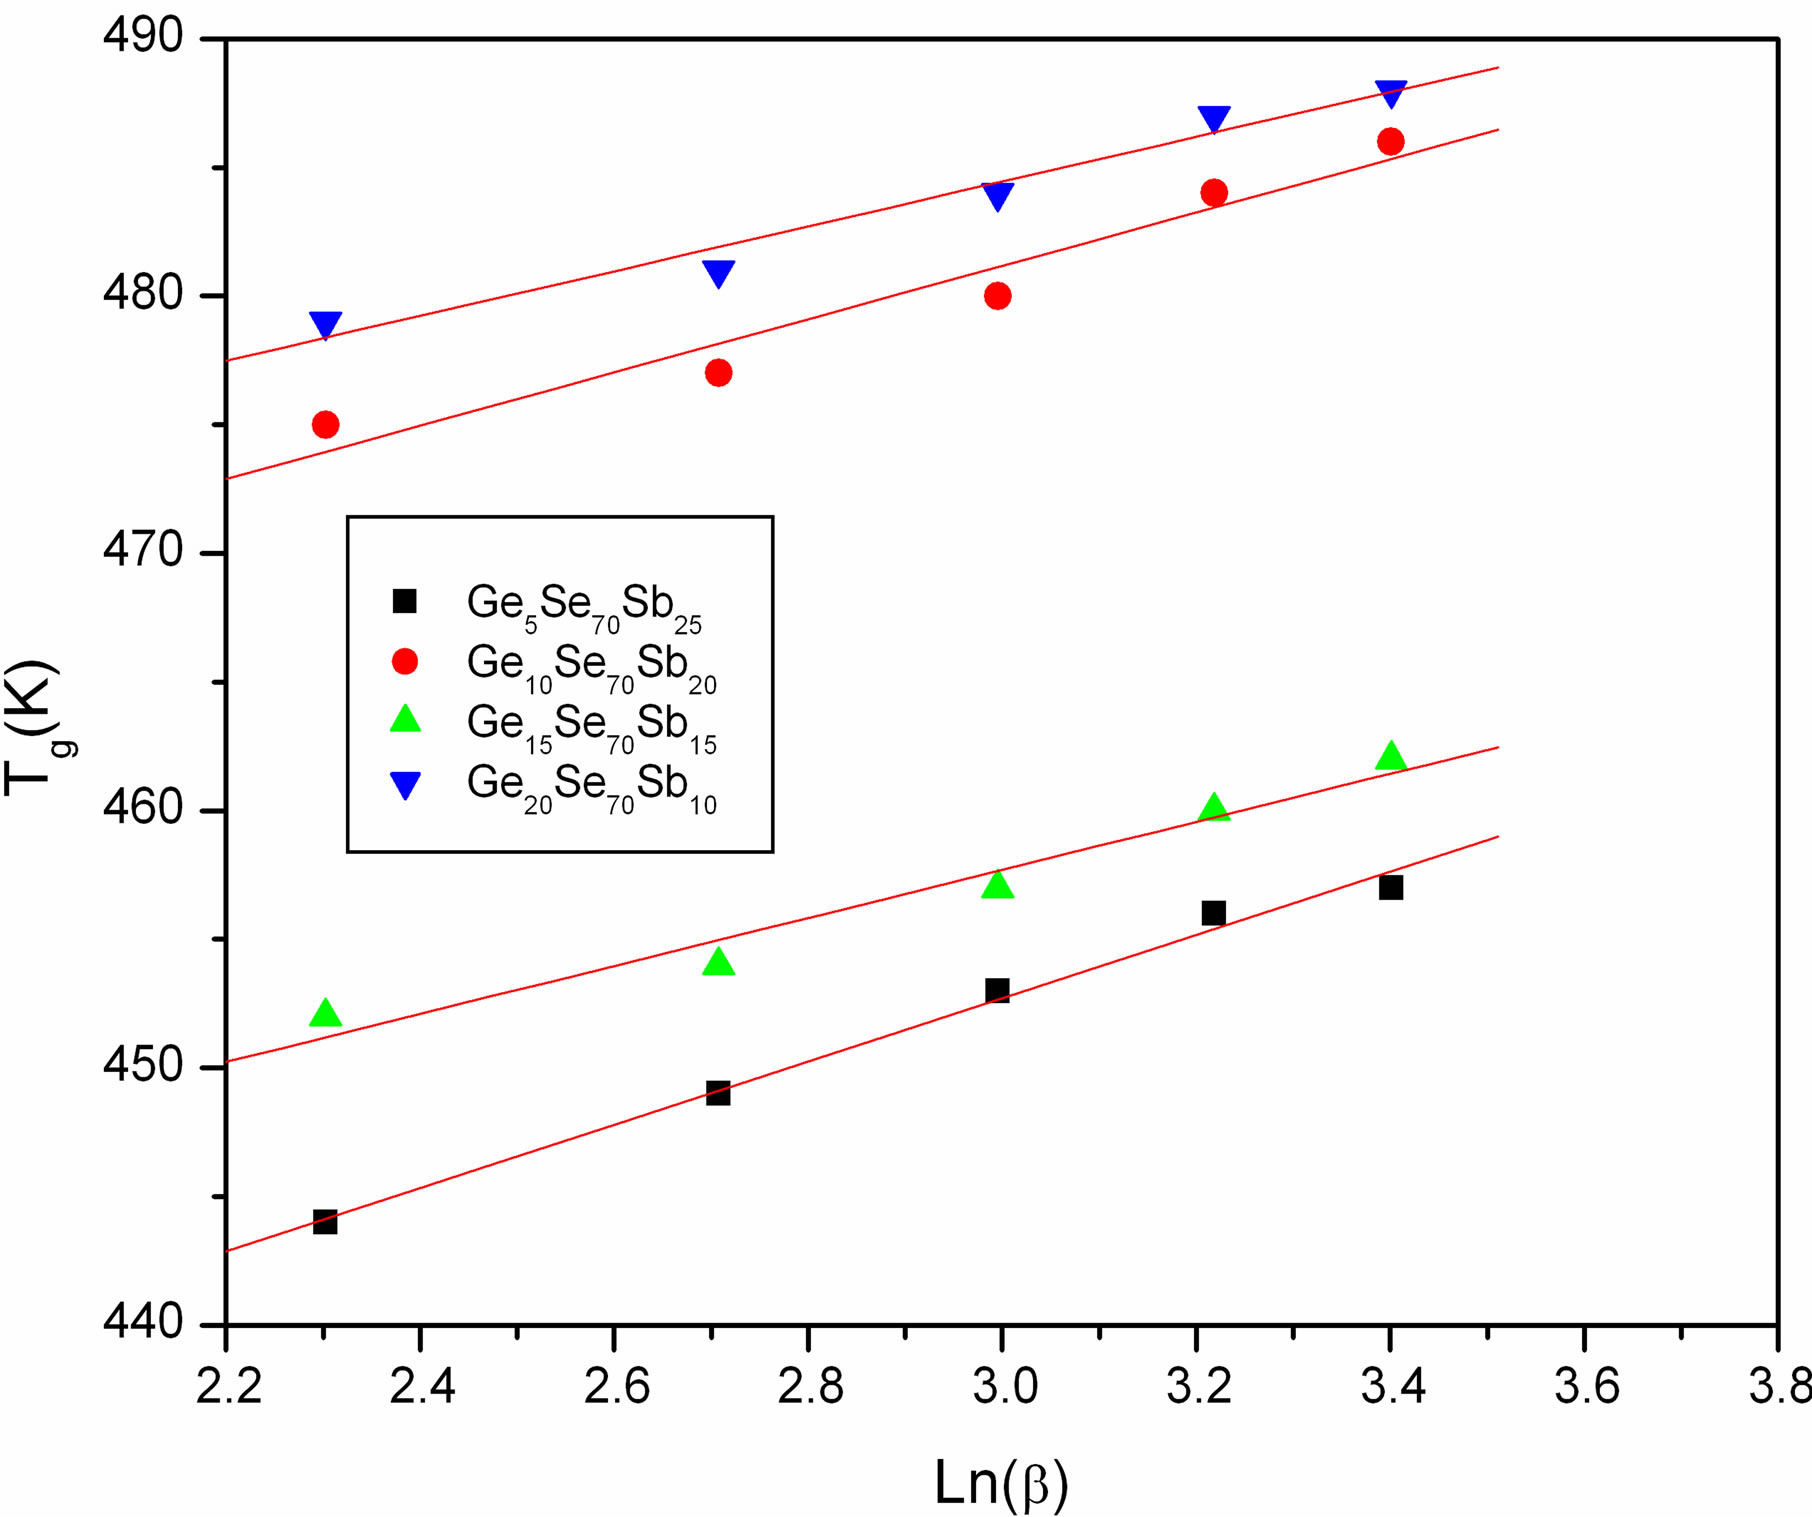
Figure 3. Plots of Tg versus Lnβ.
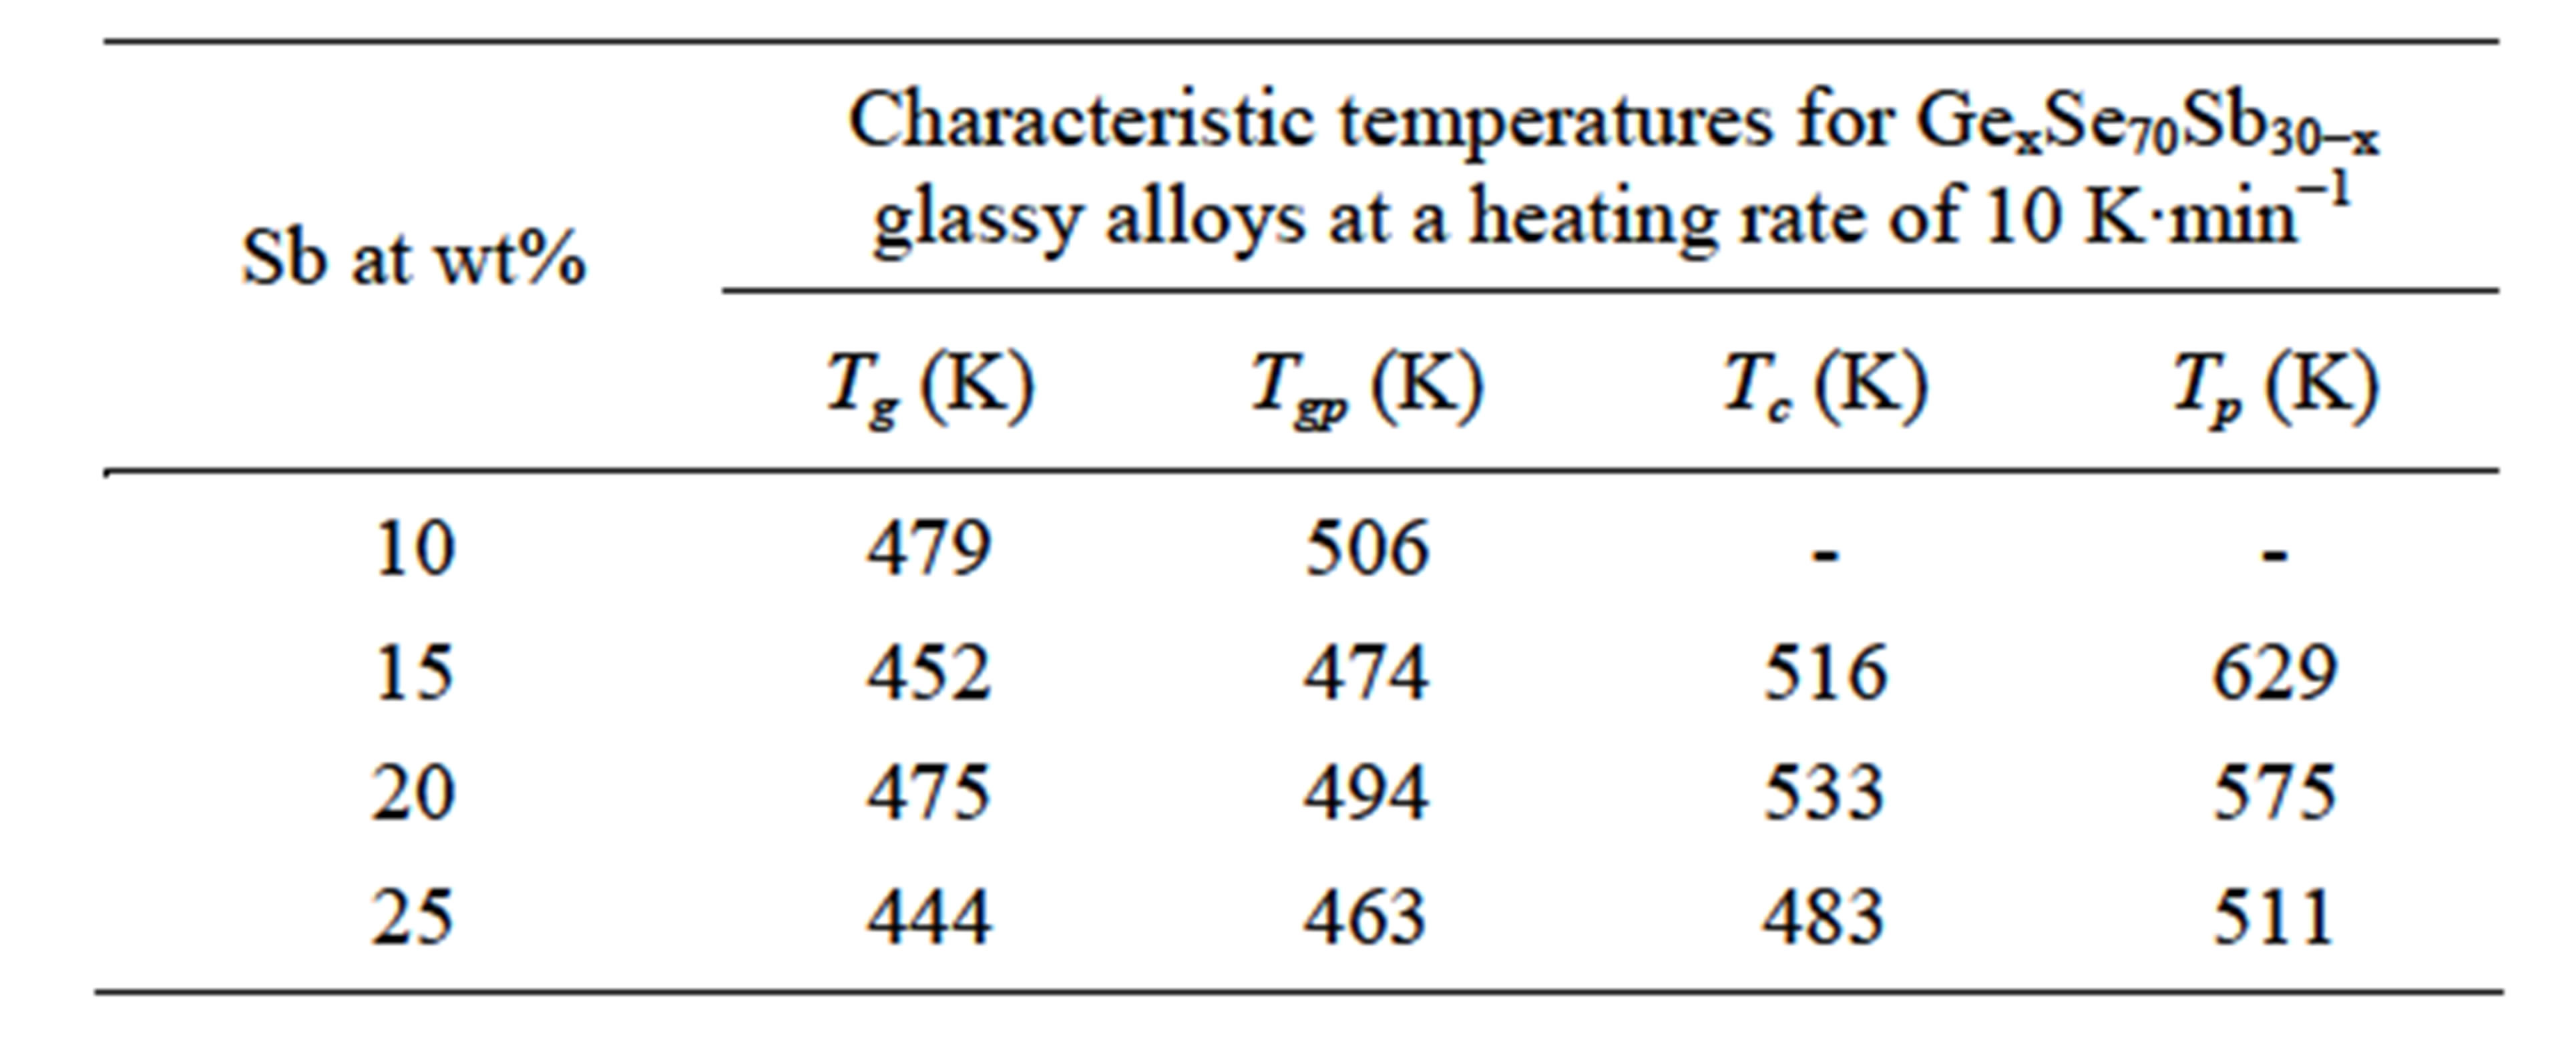
Table 1. Values of characteristic temperatures for GexSe70Sb30−x glassy alloys at a heating rate of 10 K∙min−1.
The glass transition region consists of various metastable states separated by energy barriers. The atoms in these metastable states tend to attain more stable state than others by overcoming this energy barrier. This energy barrier is known as activation energy of glass transition region. The atoms in a glass having minimum activation energy have higher probability to jump to the metastable state of lower energy which is the most stable state [9].
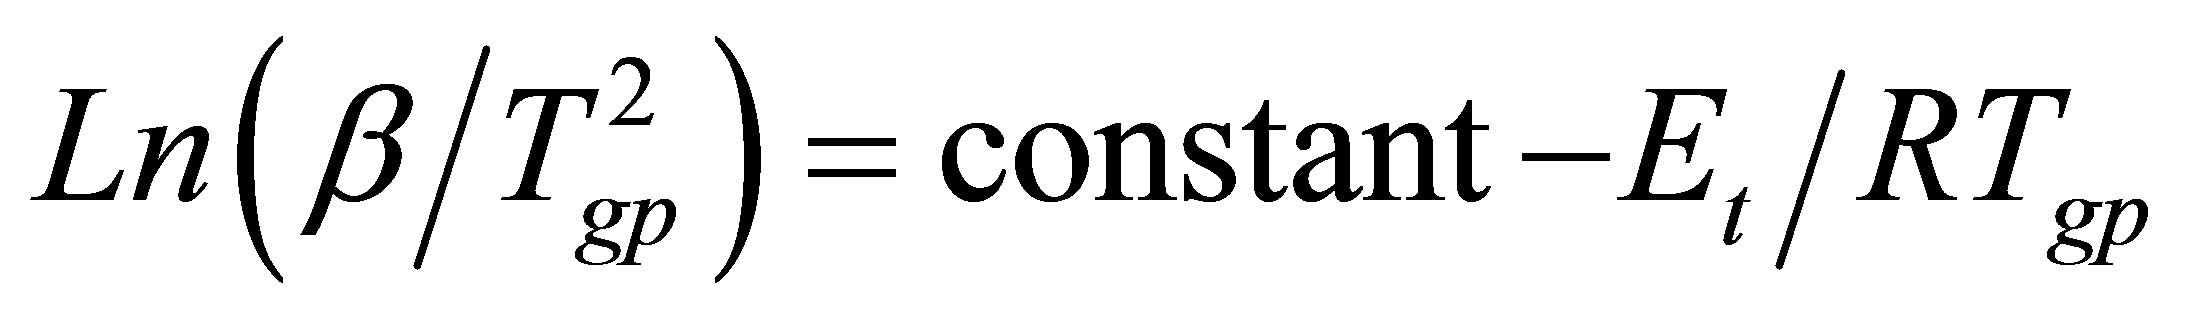
The activation energy of glass transition region has been evaluated using Kissinger formulation [10]. The Kissinger formulation is basically used for the calculation of the activation energy of crystallization region. It has also been frequently used for the evaluation of the activation energy of glass transition region [11-13]. The Kissinger equation is
 (2)
(2)
where Tgp is the temperature of endothermic peak and R is universal gas constant. Plots of  versus 1000/Tgp have been shown in Figure 4 for GexSe70Sb30−x (x = 5, 10, 15, 20) glassy sample. The activation energy of glass transition has been determined from the slope of curve. The activation energy of glass transition for different composition of glasses is given in Table 3. It is observed from Table 3 that the activation energy is minimum for15 at wt% of Sb.
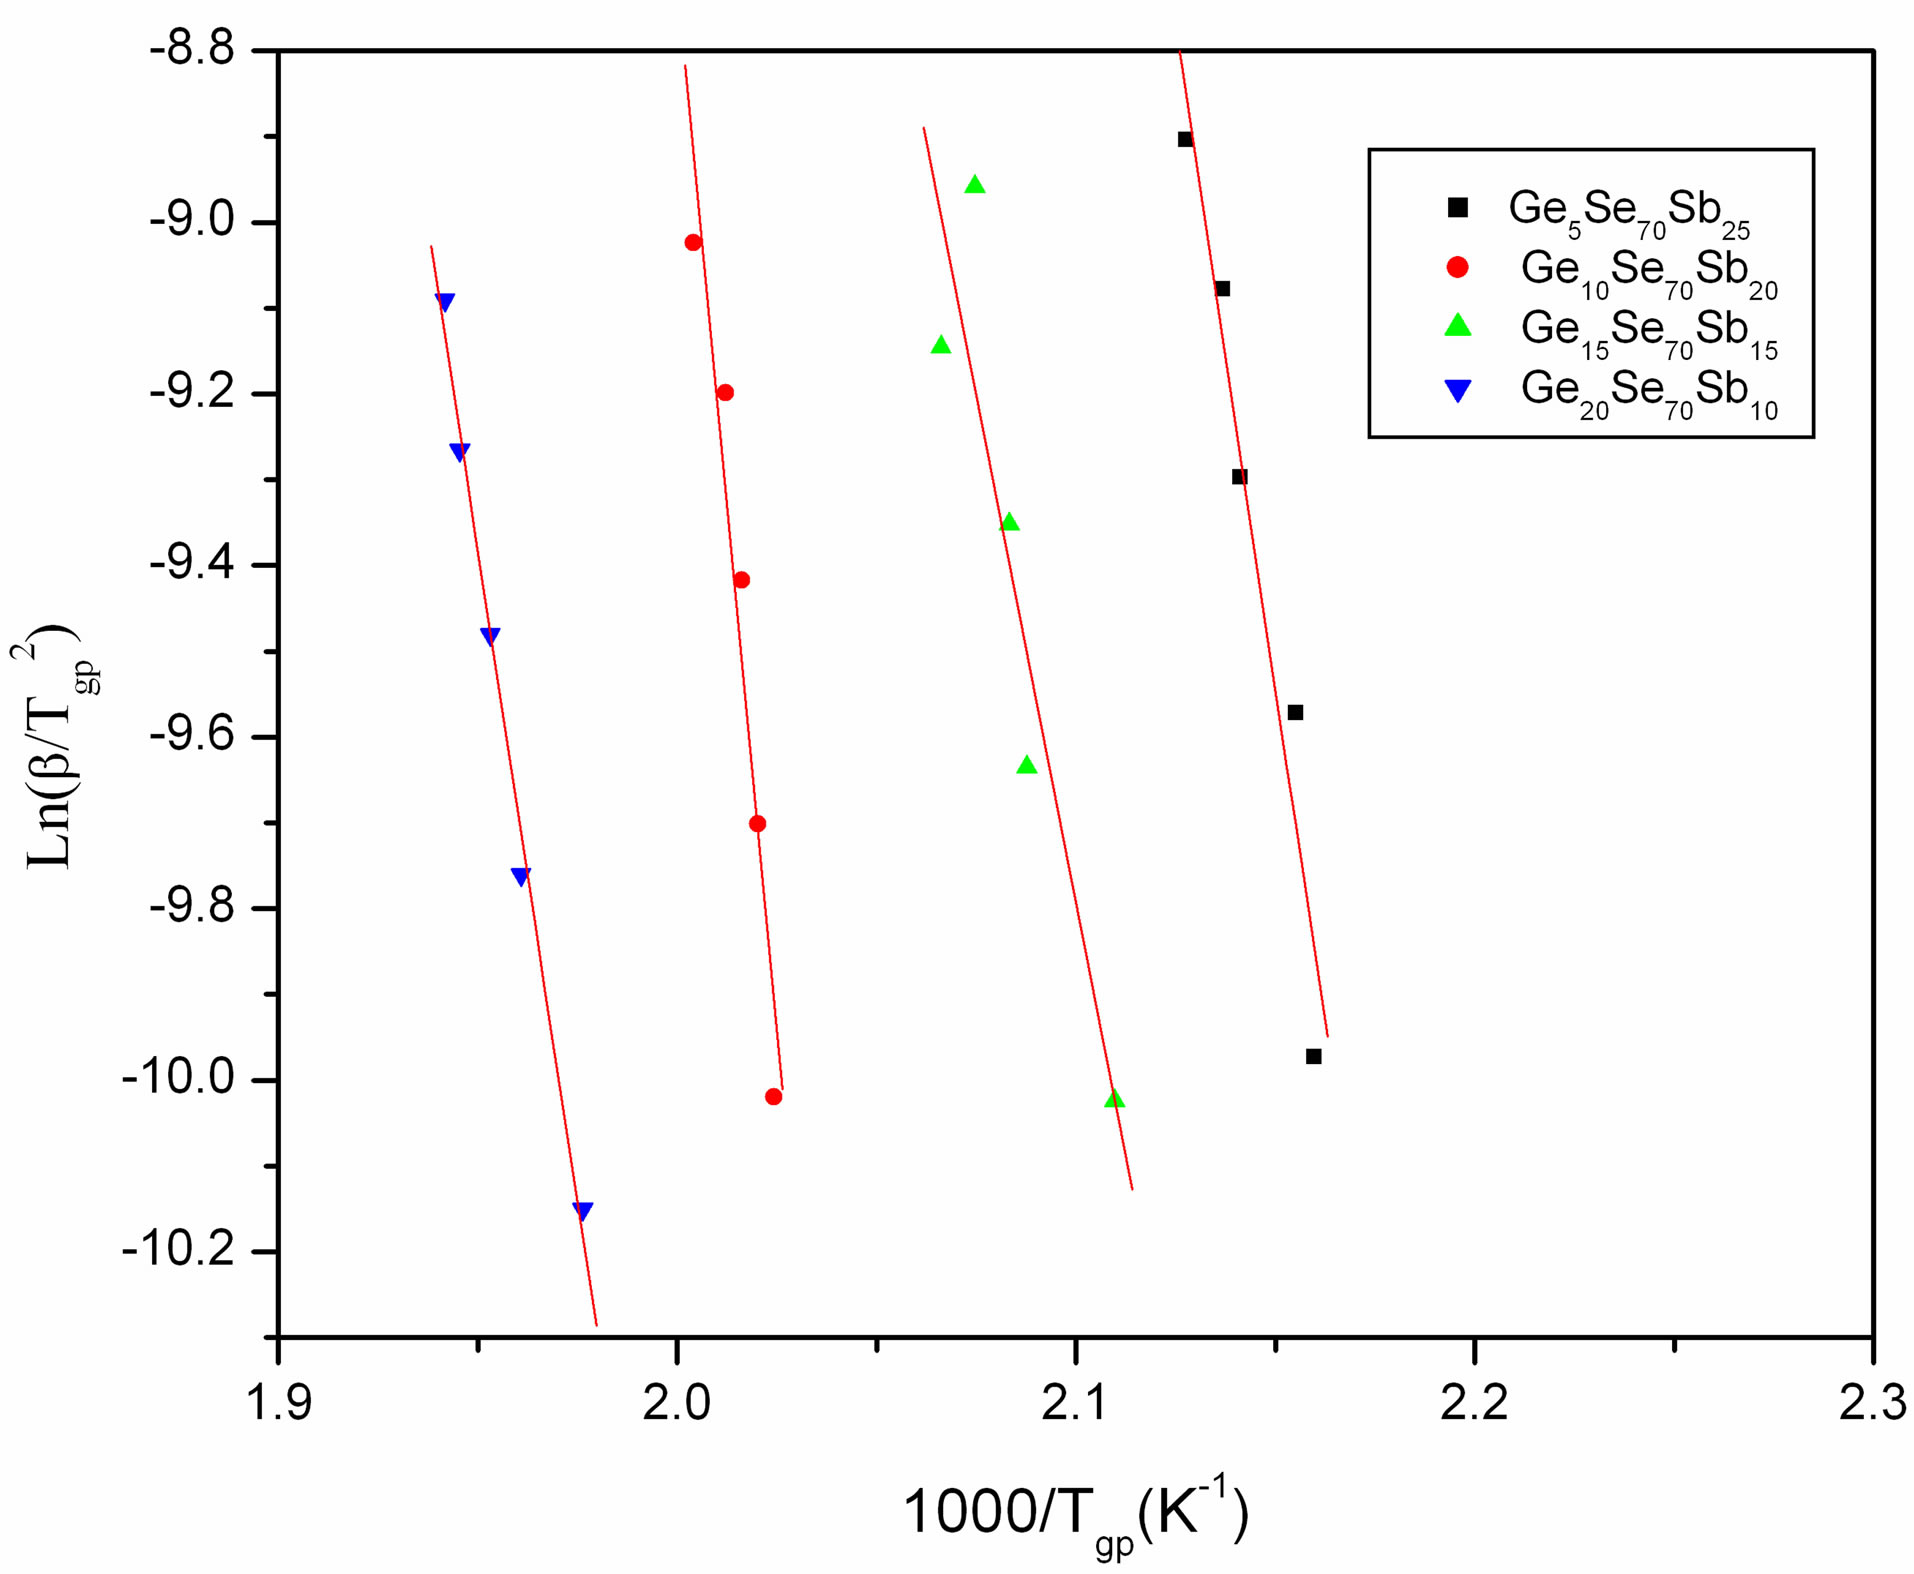
Figure 4. Plots of Ln(β/Tgp2) versus 1000/Tgp.
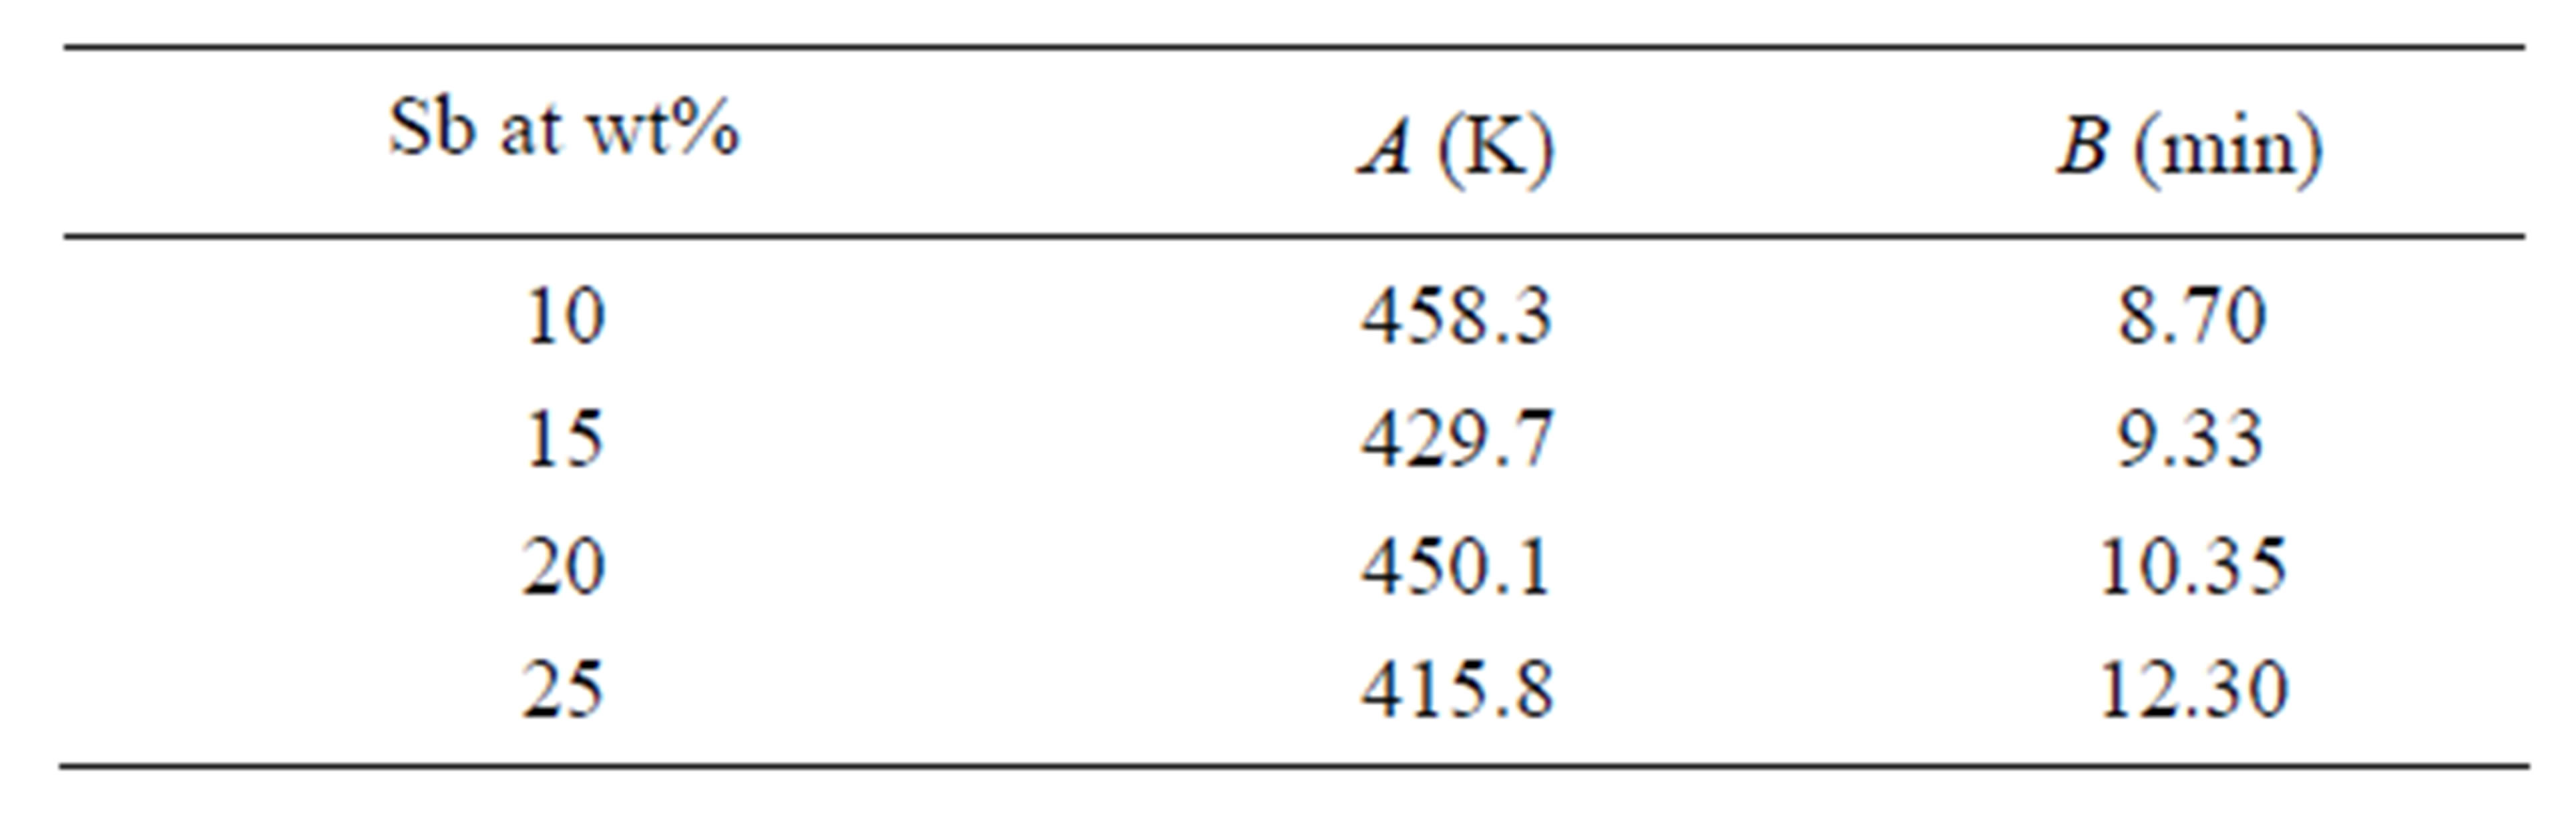
Table 2. Values of A and B for different compositions of Ge-Se-Sb system.
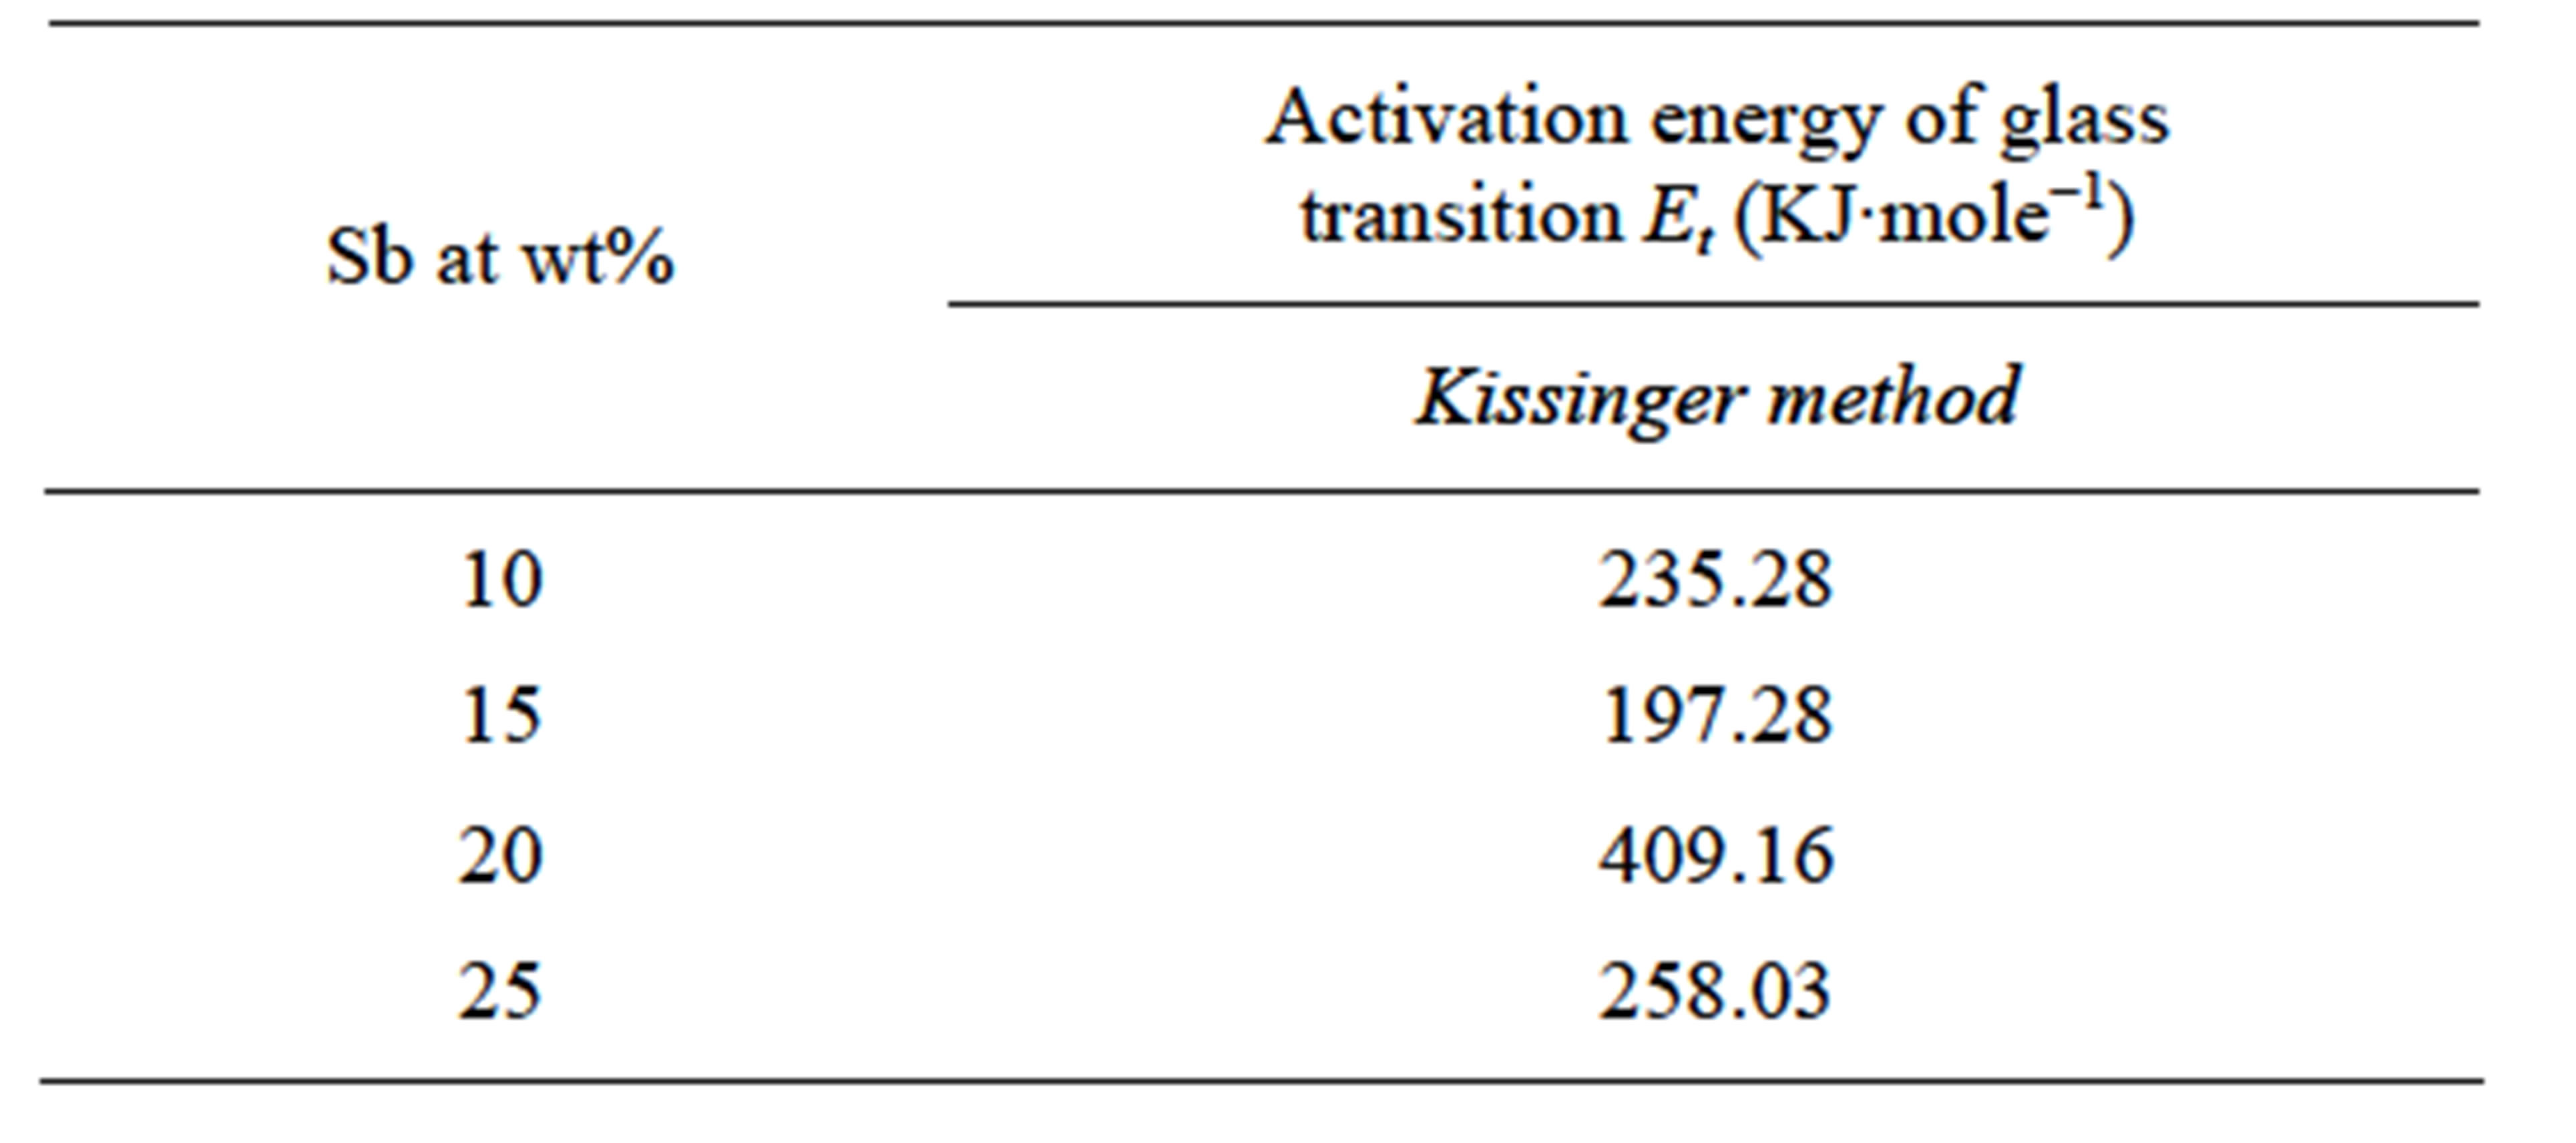
Table 3. Values of the activation energy of glass transition Et for GexSe70Sb30−x (x = 5, 10, 15, 20) glassy samples.
3.2. Kinetics of Crystallization
Kinetics of crystallization process under non-isothermal condition has been analyzed in terms of composition dependence of onset crystallization temperature (Tc), peak crystallization temperature and the activation energy of crystallization region. The activation energies to be considered in an amorphous crystalline transformation process are the activation energy for nucleation (En), activation energy for crystal growth (Eg) and that whole process of crystallization, called the activation energy of crystallization denoted by Ec. The activation energy of crystallization under non-isothermal conditions for GexSe70Sb30−x (x = 5, 10, 15) has been evaluated from two different methods. It would have not been possible to evaluate the activation energy of crystallization for Ge20Se70Sb10 as the onset and peak crystallization temperature have not been obtained in these glasses at any heating rates.
First one is Peak method; the activation energy of crystallization can be obtained from the dependence of Tp on different heating rates, using the equation of Kissinger model [14]
 (3)
(3)
where Tp is the peak crystallization temperature. Plots of  versus 1000/Tp are shown in Figure 5 for GexSe70Sb30−x (x = 5, 10, 15) glassy samples. As mentioned above the slope of the plots (straight lines) give the activation energy of crystallization.
The second method for the determination of the activation energy of crystallization is isoconversional method. Isoconversional method has two types. One set of methods relies on approximating the temperature integral such as Kissinger-Akahira-Sunose (KAS) [13,14] and Flynn-Wall-Ozawa method [15,16]. The second set of methods uses a determination of the reaction rate at an equivalent stage of the reaction at different heating rates such as Frideman-Ozawa method [17]. In the present paper, the activation energy of crystallization has been calculated using Kissinger-Akahira-Sunose (KAS) and Flynn-Wall-Ozawa isoconversional methods.
3.3. Kissinger-Akahira-Sunose (KAS) Method
 (4)
(4)
where Tαi temperature at which a fixed fraction α of the total amount is transformed. Plots of  versus 1000/Tαi are shown in Figure 6 for GexSe70Sb30−x (x = 5, 10, 15) glassy samples. Again the slope of the straight line gives the activation energy of crystallization using this method.
3.4. Flynn-Wall-Ozawa (FWO) Method
 (5)
(5)
where Tαi temperature at which a fixed fraction α of the total amount is transformed. Figure 7 shows the Plots of Ln(β) versus 1000/Tαi for GexSe70Sb30−x (x = 5, 10, 15) glassy samples. The activation energy of crystallization has been determined from the slope of the straight line.
The activation energy of crystallization Ec is an indication of the speed of the rate of crystallization. Table 4 shows the activation energy of crystallization for differrent composition of glasses and it has been noticed that the activation energy is highest for 15 at wt% of Sb.

Figure 5. Plots of Ln(β/Tp2) versus 1000/Tp.
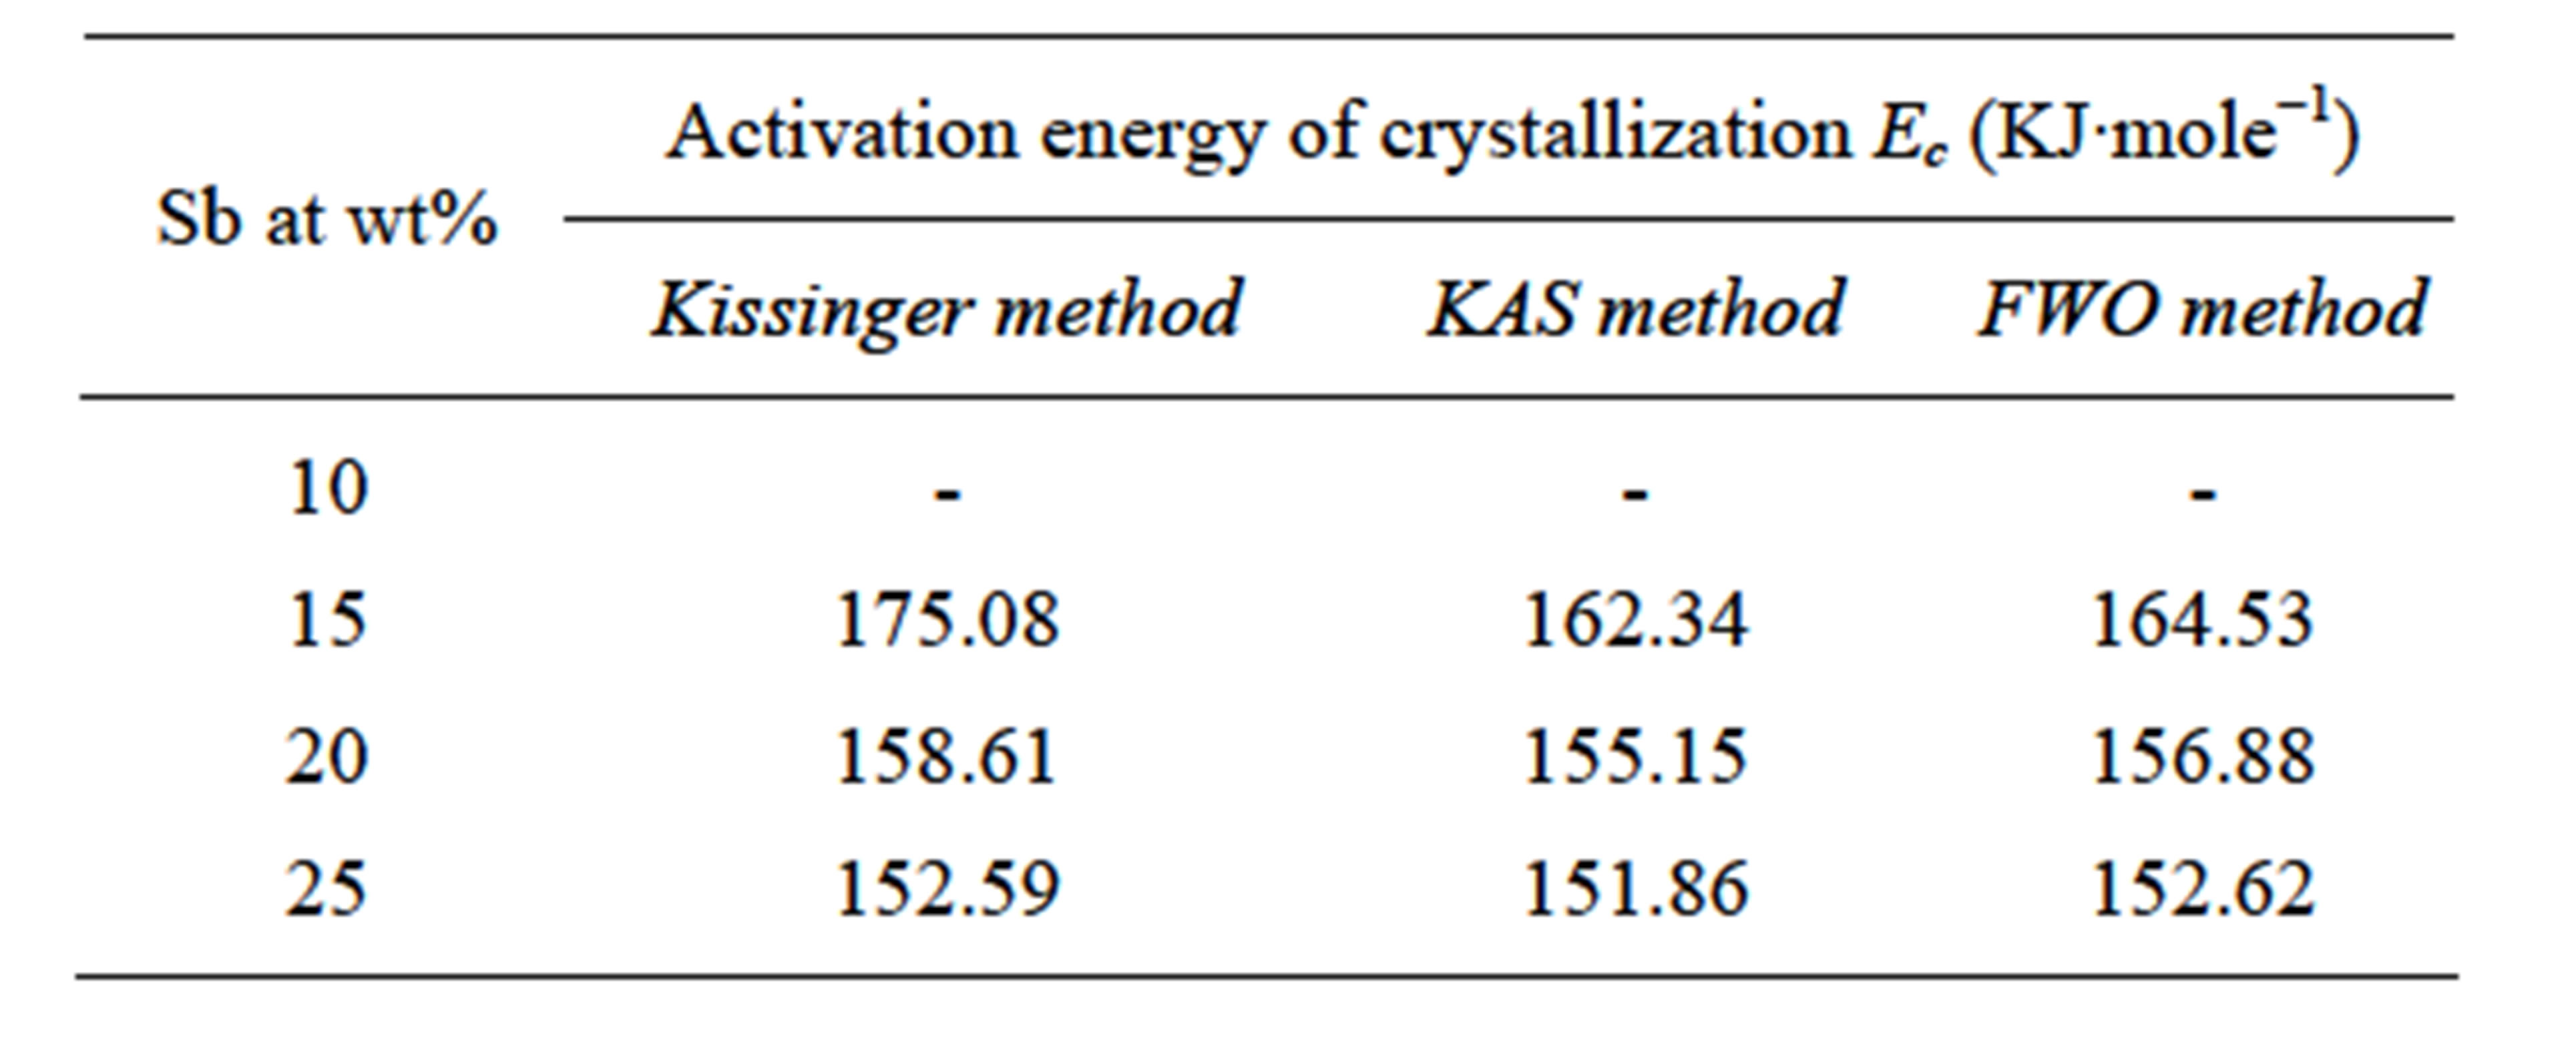
Table 4. Values of the activation energy of crystallization Ec for different compositions.
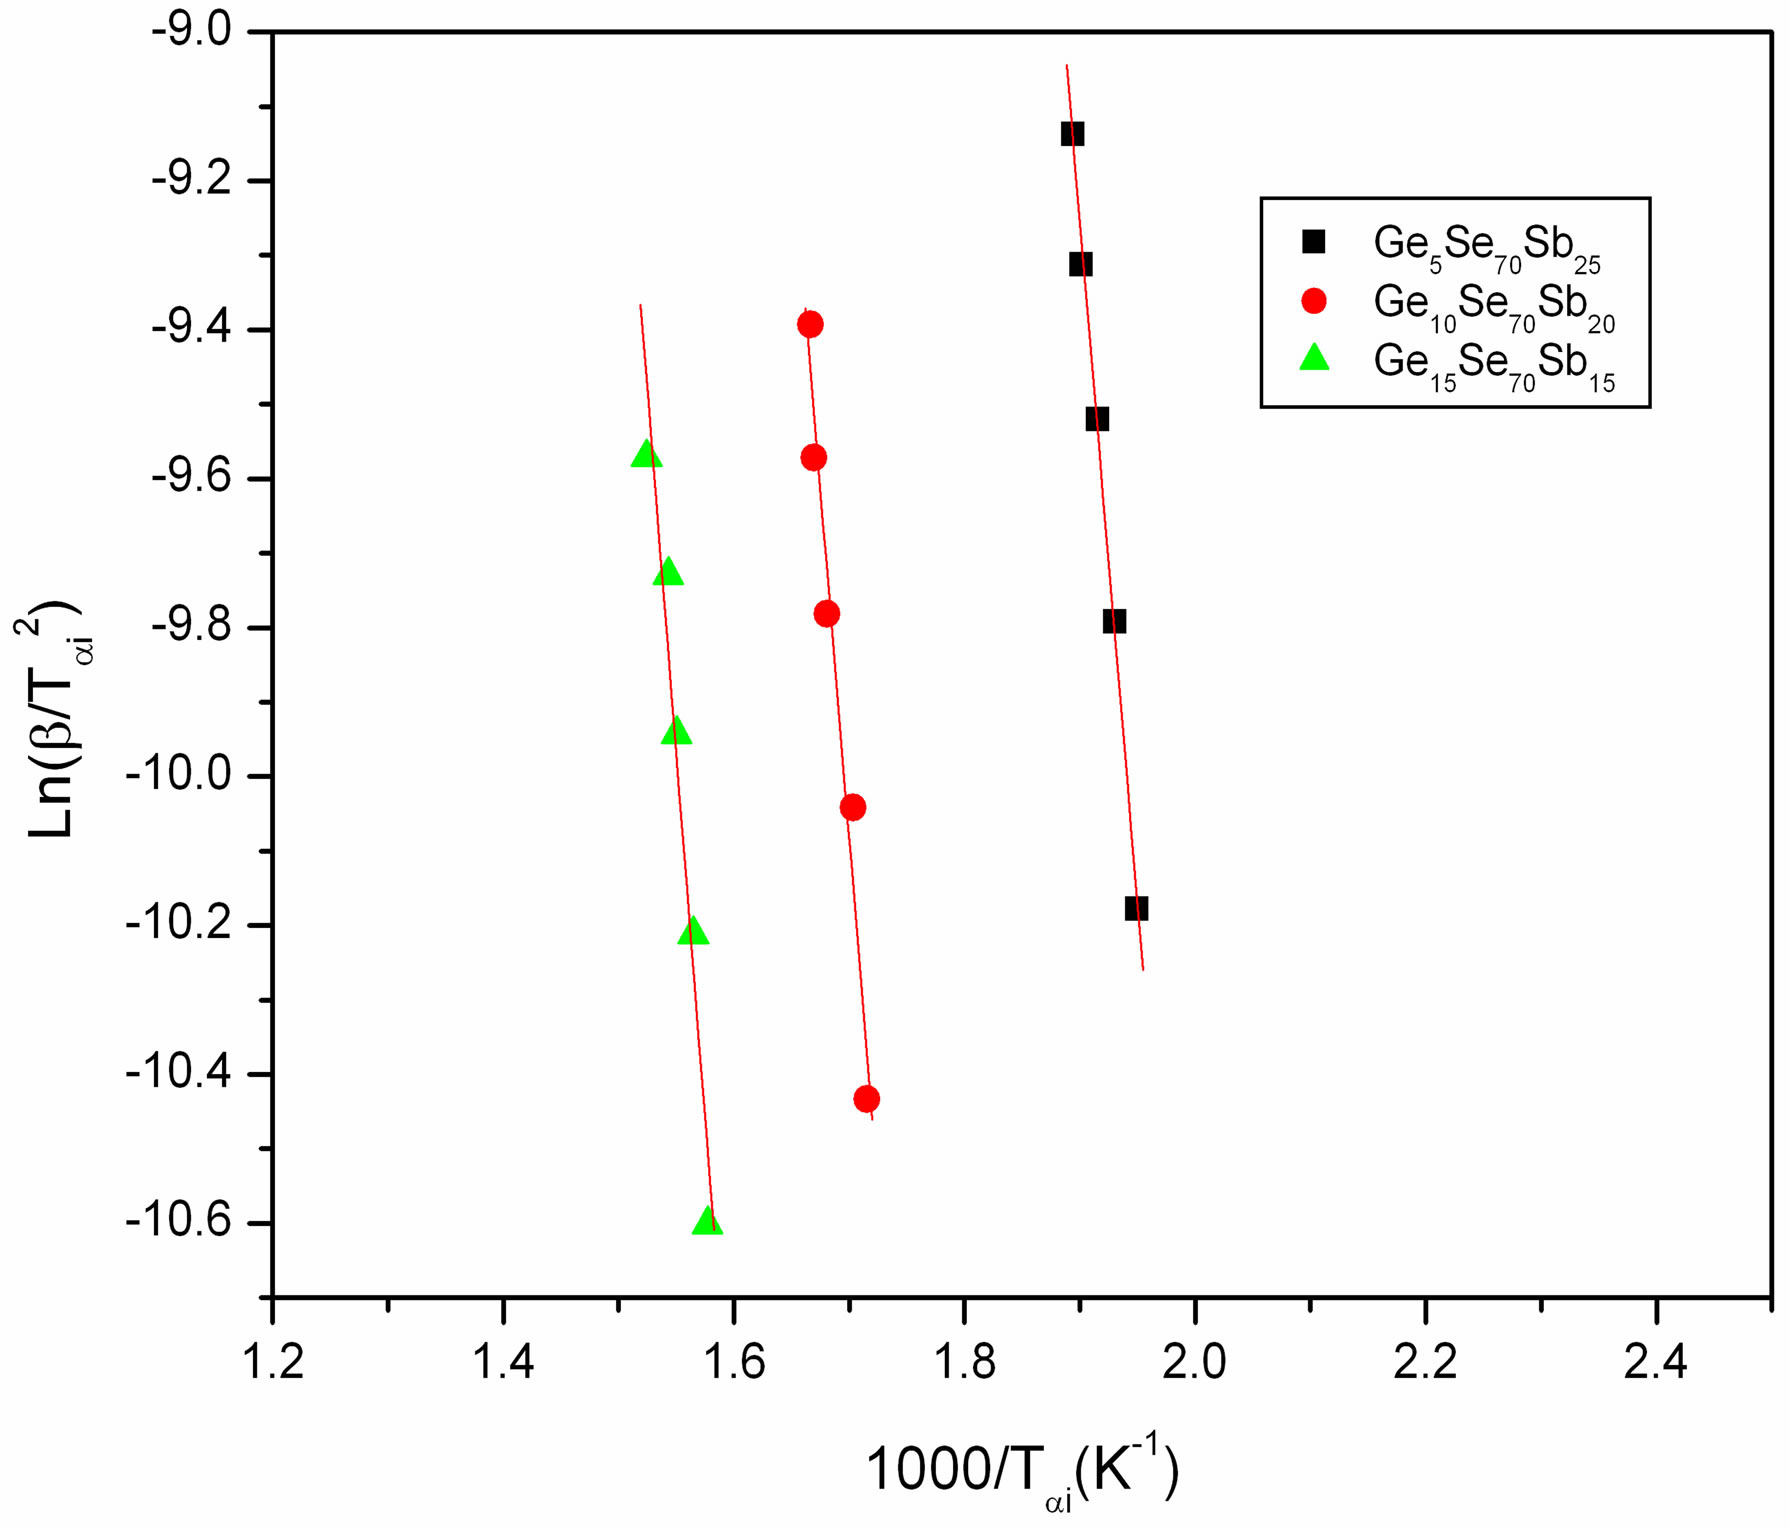
Figure 6. Plots of Ln(β/Tαi2) versus 1000/Tαi.
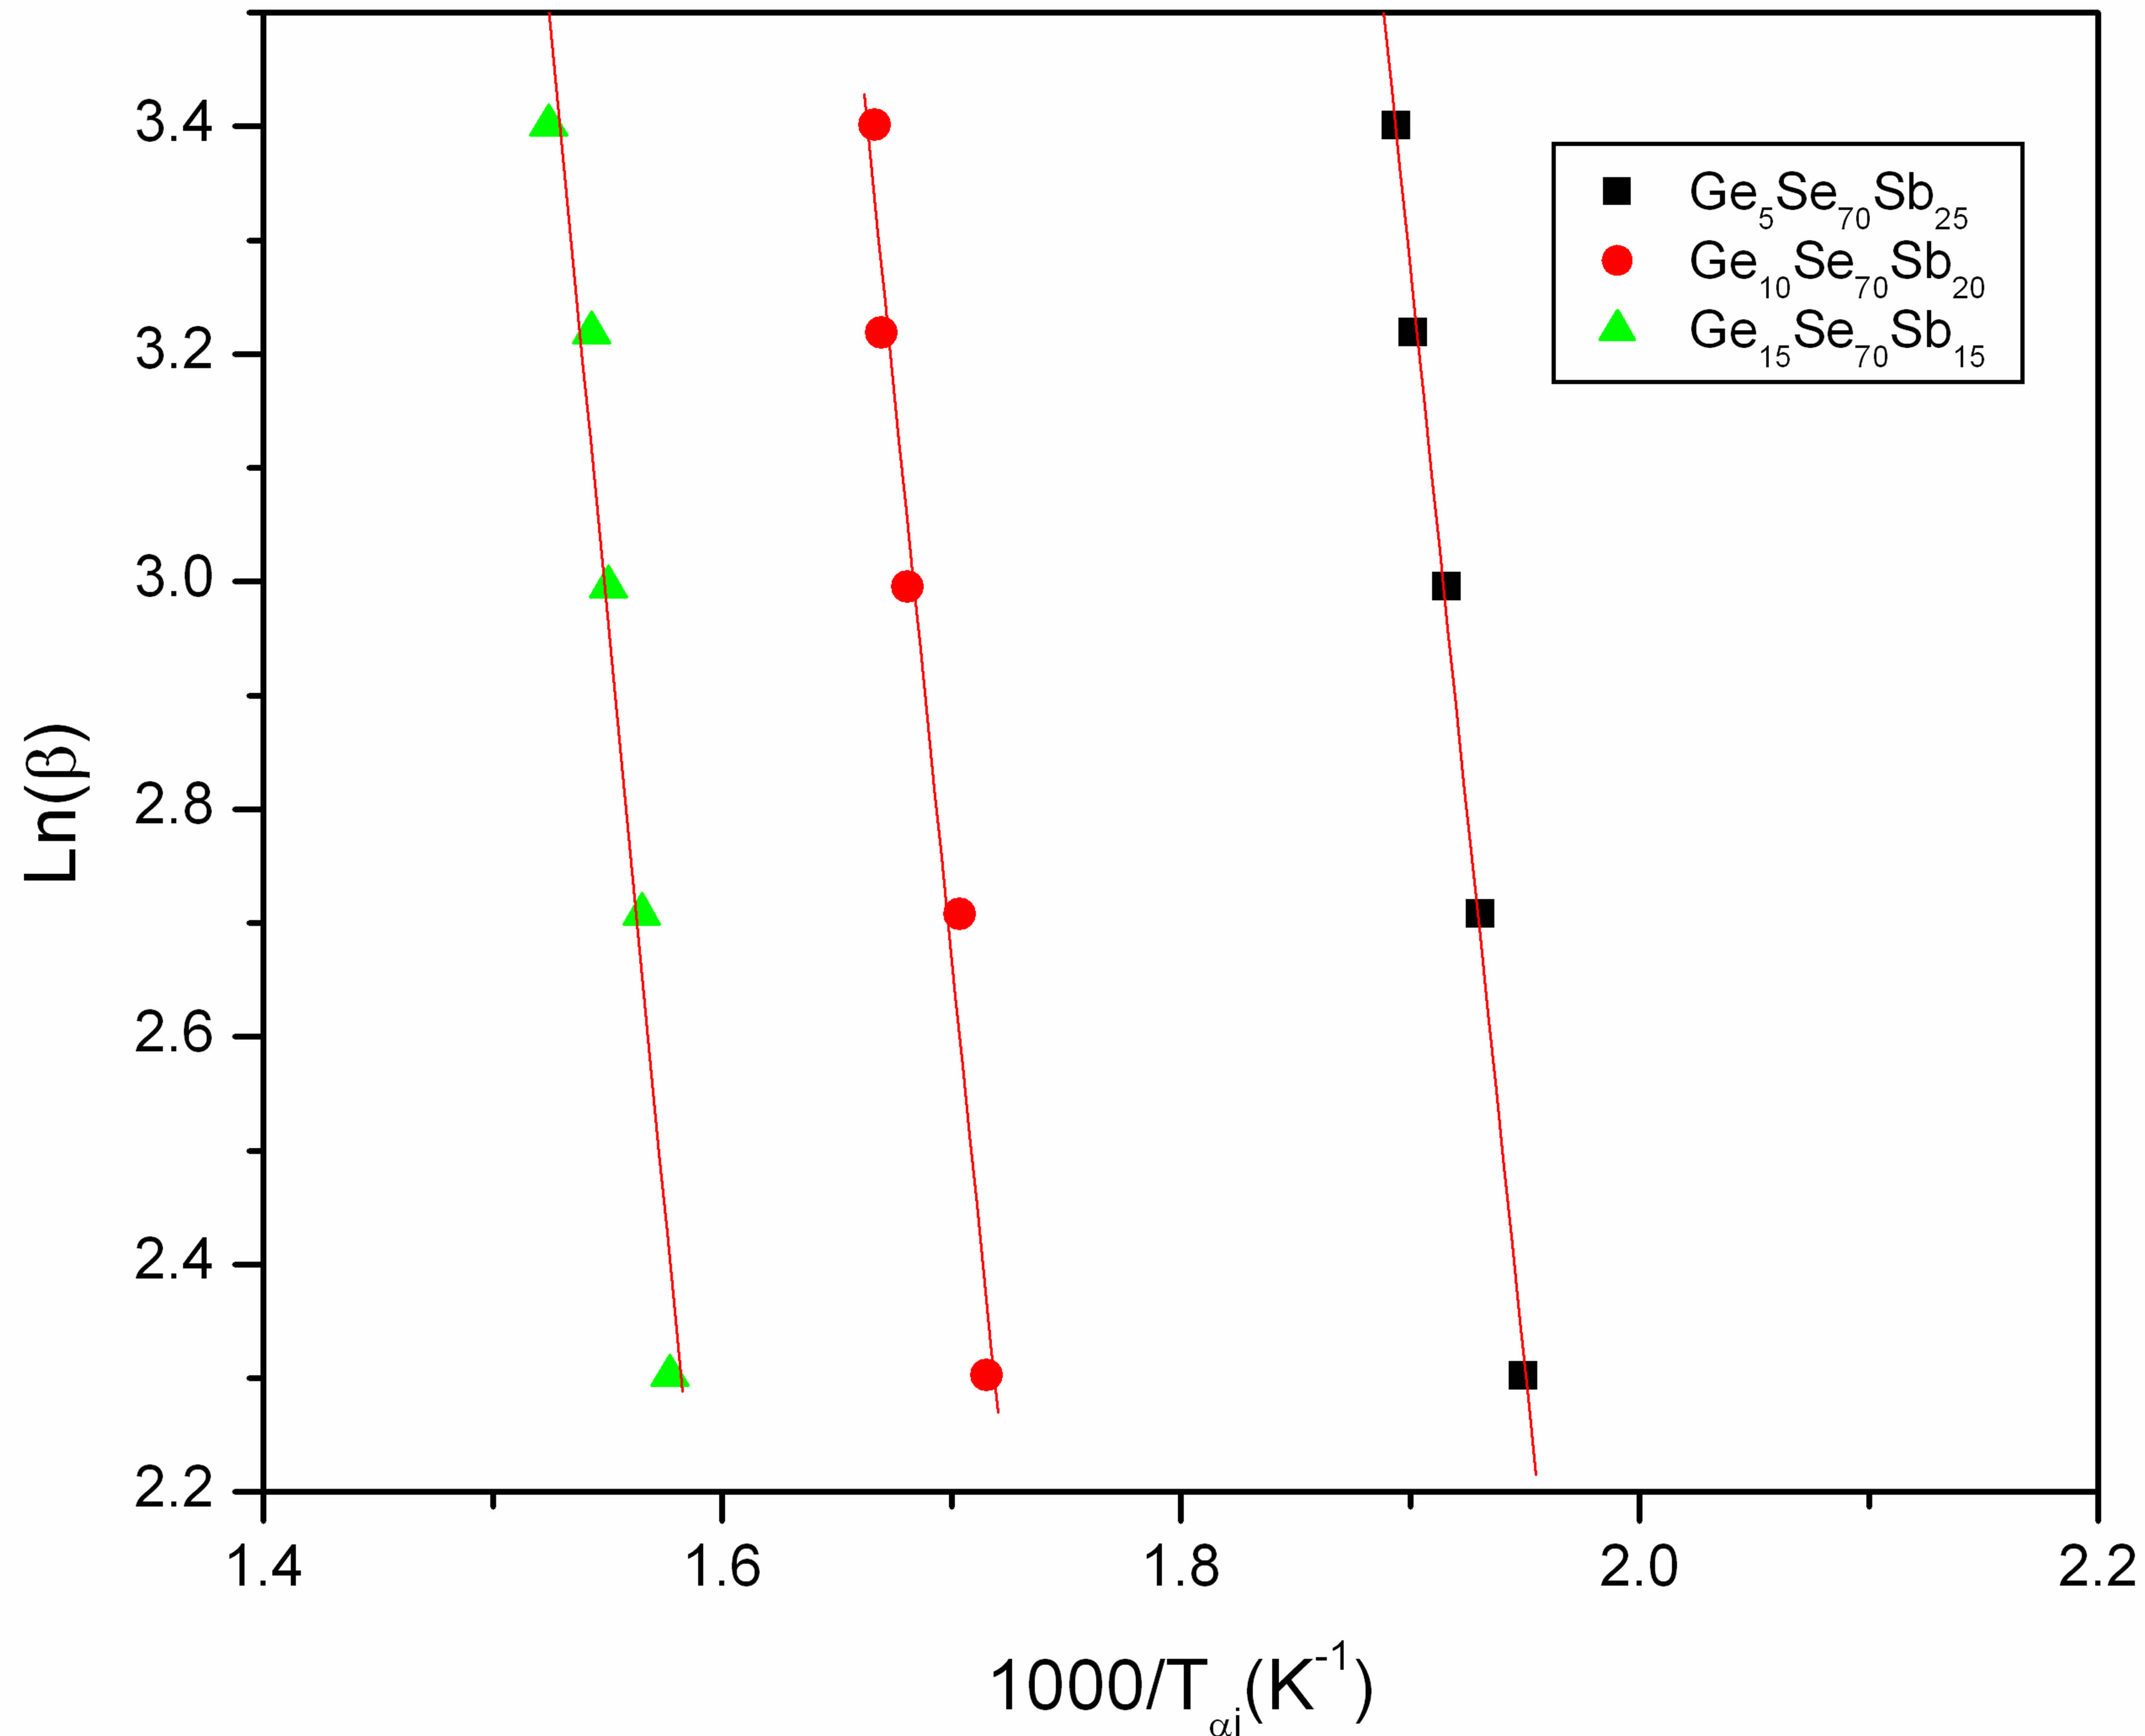
Figure 7. Plots of Ln(β) versus 1000/Tαi.
3.5. Thermal Stability
From application point of view the glass should be thermally stable. The thermal stability of the glasses has been decided on the basis of kinetic resistance to crystallization. The kinetic resistance is the difference of the onset crystallization (Tc) temperature and onset glass transition temperature (Tg). The larger the difference then higher is the resistance [18]. Therefore, in GexSe70Sb30−x (x = 5, 10, 15, 20) glasses a composition, which has higher value of kinetics resistance, is most stable. It has been observed that glass Ge15Se70Sb15 has the highest thermal stability. Figure 8 shows the variation of Tc − Tg with percentage composition of Sb in the Ge-Se-Sb glasses. It is also noted from Table 1 that Tc − Tg is highest for 15 at wt% of Sb in the glass and therefore Ge15Se70Sb15 glass is thermally more stable.
4. Conclusions
The studies of kinetics of crystallization and thermal sta-
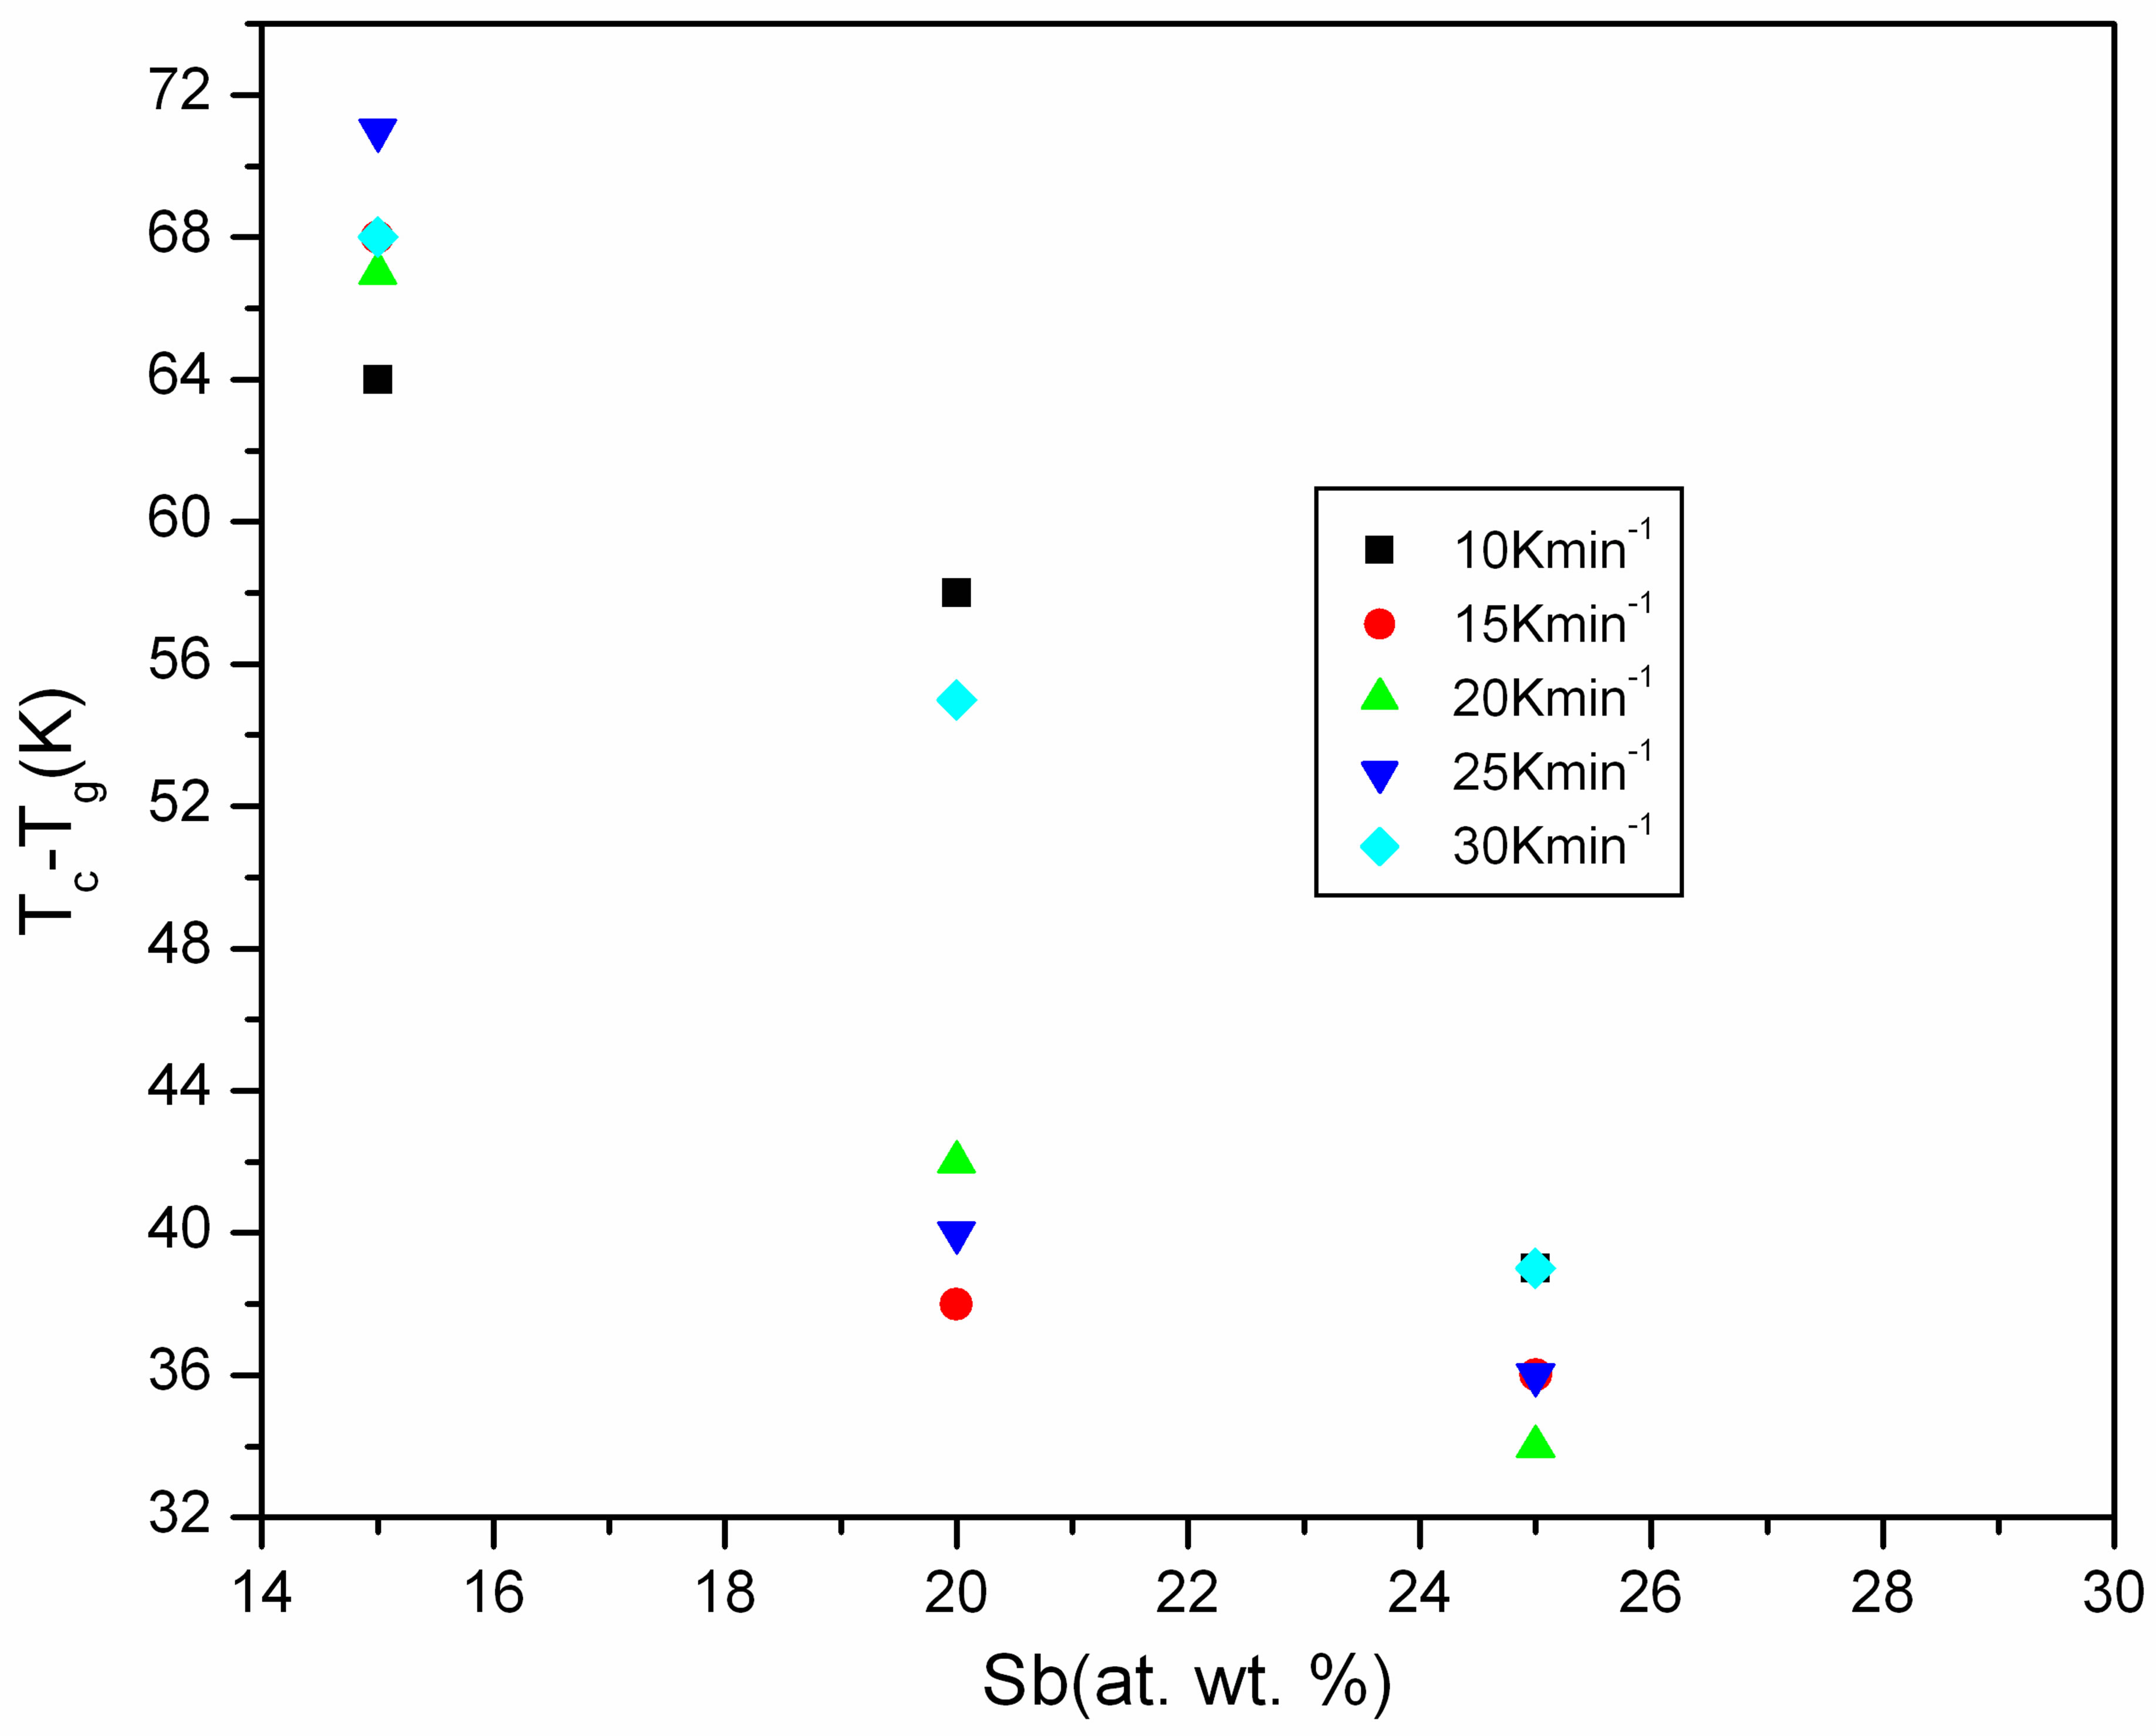
Figure 8. Variation of Tc − Tg with atomic weight percentage of Sb.
bility of GexSe70Sb30−x (x = 5, 10, 15, 20) chalcogenide glasses have led to following conclusions:
Ÿ Glass transition and crystallization process have been shown in each DSC thermogram except Ge20Se70Sb10 alloys.
Ÿ The glass transition temperature is found to vary for different composition indicating a structural change due to addition of Sb.
Ÿ A glassy sample having high kinetic resistance to crystallization is more stable as compared to other glasses. Accordingly Ge15Se70Sb15 is more stable glass than the other members of the series.
5. Acknowledgements
One of the authors (Anusaiya) is grateful to the DSA programme of UGC in the department for providing financial support in the form of fellowship during this work.
REFERENCES
- K. Tanaka, “Structural Phase Transition in Chalcogenide Glasses,” Physical Review B, Vol. 39, No. 2, 1989, pp. 1270-1279. http://dx.doi.org/10.1103/PhysRevB.39.1270
- S. Kumar, M. Hussain and M. Zulfequar, “Effect of Silver on the Dielectric Properties,” Physica B, Vol. 371, No. 2, 2006, pp. 193-198. http://dx.doi.org/10.1016/j.physb.2005.09.021
- M. Esquerre, J. C. Carballes, J. P. Audiere and C. Mazieres, “Crystallization of Amorphos (Bulk and Thin Films) GexSe1−x (0 < x < 0.20) Alloys,” Journal of Materials Science, Vol. 13, No. 6, 1978, pp. 1217-1223. http://dx.doi.org/10.1007/BF00544727
- A. B. Ghokle and R. B. Abbaschaian, “The Ge-Se (Germenium-Selinum) System,” Bulletin of Alloy Phase Diagrams, Vol. 11, No. 3, 1990, pp. 257-263. http://dx.doi.org/10.1007/BF03029295
- A. R. Hillton and D. J. Hayes, “The Interdependence of Physical Parameters for Infrared Transmiting Glasses,” Journal of Non-Crystalline Solids, Vol. 17, No. 3, 1975, pp. 339-348.
- M. Frumer, H. Ticha, J. Klikoka and P. Tomiska, “Optical Absorption in Vitreous GeSb2Se4,” Journal of NonCrystalline Solids, Vol. 13, No. 1, 1973, pp. 173-178. http://dx.doi.org/10.1016/0022-3093(73)90046-X
- J. A. Savage, P. J. Webber and A. M. Pitt, “An Assessment of Ge-Sb-Se Glasses as 8 to 12 µm Infrared Optical Materials,” Journal of Materials Science, Vol. 13, No. 4, 1987, pp. 859-864. http://dx.doi.org/10.1007/BF00570524
- M. Lasocka, “The Effect of Scanning Rate on Glass Transition Temperature of Splat-Cooled Te85Ge15,” Materials Science and Engineering, Vol. 23, No. 2-3, 1976, pp. 173- 176. http://dx.doi.org/10.1016/0025-5416(76)90189-0
- M. M. A. Imran, D. Bhandri and N. S. Saxena, “Enthalpy Recovery during Structural Relaxations of Se96In4 Chalcogenide Glasses,” Physica B, Vol. 293, No. 3-4, 2001, pp. 394-401. http://dx.doi.org/10.1016/S0921-4526(00)00543-3
- H. E. Kissinger, “Reaction Kinetics in the Differential Thermal Analysis,” Analytical Chemistry, Vol. 29, No. 11, 1957, pp. 1702-1706. http://dx.doi.org/10.1021/ac60131a045
- H. S. Chen, “A Method for Evaluating Viscosities of Metallic Glasses from the Rates of Thermal Transformations,” Journal of Non-Crystalline Solids, Vol. 27, No. 2, 1978, pp. 257-263. http://dx.doi.org/10.1016/0022-3093(78)90128-X
- J. E. Shelby, “Thermal Expansion of Amorphous Metals,” Journal of Non-Crystalline Solids, Vol. 34, No. 1, 1979, pp. 111-119. http://dx.doi.org/10.1016/0022-3093(79)90010-3
- H. E. Kissinger, “Variation of Peak Temperature with Heating Rate in Differential Thermal Analysis,” Journal of Research of the National Bureau of Standards, Vol. 57, No. 4, 1956, pp. 217-221. http://dx.doi.org/10.6028/jres.057.026
- T. Akahira and T. Sunose, “Joint Convention of Four Electrical Institutes,” Science Technology, Vol. 16, 1971, pp. 22-31.
- T. Ozawa, “A New Method of Analyzing Thermogravimetric Data,” Bulletin of The Chemical Society of Japan, Vol. 38, No. 11, 1965, pp. 1881-1886. http://dx.doi.org/10.1246/bcsj.38.1881
- J. Flynn and A. Wall, “A Quick, Direct Method for the Determination of Activation Energy from Thermogravimetric Data,” Journal of Polymer Science Part B, Vol. 4, No. 5, 1966, pp. 323-328. http://dx.doi.org/10.1002/pol.1966.110040504
- H. L. Friedman, “Kinetics of Thermal Degradation of Charforming Plastics from Hermogravimetry and Application to a Phenolic Plastic,” Journal of Polymer Science Part C, Vol. 6, No. 1, 1964, pp. 183-185.
- S. Mahadevan, A. Giridhar and A. K. Singh, “Calorimetric Measurements on As-Sb-Se Glasses,” Journal of NonCrystalline Solids, Vol. 88, No. 1, 1986, pp. 11-34. http://dx.doi.org/10.1016/S0022-3093(86)80084-9