New Journal of Glass and Ceramics
Vol.2 No.2(2012), Article ID:18591,10 pages DOI:10.4236/njgc.2012.22010
Thermal and Structural Characterization of Transparent Rare-Earth Doped Lead Fluoride Glass-Ceramics
![]()
1Laboratoire de Chimie de la Matière Condensée de Paris, UPMC, Chimie ParisTech, Paris, France; 2Département de Physique, Université d’Annaba, Annaba, Algérie; 3Laboratoire de Photonique et Nanostructures, Marcoussis, France.
Email: *michel-mortier@chimie-paristech.fr
Received December 1st, 2011; revised January 9th, 2012; accepted January 22nd, 2012
Keywords: Glass-Ceramic; Rare-Earth; Thermal Analysis; Devitrification; Nanocrystallite; X-Ray Diffraction
ABSTRACT
The devitrification of glasses with composition 50GeO2-40PbO-10PbF2-xREF3, RE = Gd, Eu, 0 < x ≤ 2, leads to glass ceramics made of RE3+: β-PbF2 nanocrystals embedded in a glassy oxide matrix. This transformation is investigated using thermal analysis, X-ray diffraction and electron microscopy. A comparison with RE3+: β-PbF2 ceramics prepared by standard ceramic techniques is performed. The Rare Earth cations show a strong nucleating effect for the precipitation of the RE3+: β-PbF2 nanocrystals. The evolution of the unit cell parameters of the REF3: β-PbF2 solid solution results from a combined effect of Pb2+-RE3+ substitution and interstitial F– introduction. In the glass ceramics, RE3+: β-PbF2 nanocrystals are constrained by the glassy matrix when they form with a pressure equivalent to 1.6 GPa. The constrained nanocrystals can return to a relaxed state by chemical dissolution of the embedding glassy matrix, followed by thermal treatments.
1. Introduction
Transparent oxyfluoride nano-glass-ceramics made photoluminescent by doping with Rare-Earth (RE) ions have been shown recently to be promising materials for new optical devices such as bulk laser media and amplifying laser fibers for optical communications [1-7]. These materials are easier to prepare than single crystals and can be made in a wide variety of shape and size. They are obtained by casting of a glass, using standard glass technology, followed by an appropriate heat treatment to generate the precipitation of fluoride nanocrystallites in the remaining oxide glass. Transparent glass-ceramics have interesting optical properties, since they exhibit narrower emission linewidths and higher emission crosssection than their parent glasses [4]. Therefore, they combine the processing ability of the glasses with the outstanding optical properties of the crystals.
For about ten years, we are engaged in the investigation of lanthanide-activated transparent oxyfluoride glassceramics prepared by annealing of glasses with typical composition 50GeO2-40PbO-10PbF2-xREF3, in which the doping ions, which act as nucleating agents, are confined in β-PbF2 nanocrystals [5,8-10].
Recently, we have reported optical investigation of EuF3 doped lead fluorogermanate glasses [11], revealing that Eu3+ ions are not statistically distributed in the glass, but incorporated in fluorine rich islands separated by chains of GeO4 anions linked together. We have also compared the transparent glass-ceramic containing Eu3+: β-PbF2 nanocrystallites obtained by devitrification of the above mentioned glass with the europium activated β-PbF2 ceramics [12]. It has been shown that their optical properties are almost identical and that, in these materials, europium ions are not isolated but engaged in dimers and higher nuclearity clusters. Furthermore, in co-doped Gd3+: Eu3+: β-PbF2 ceramics, efficient energy transfer from Gd3+ to Eu3+ occurs [12]. This property might be used for instance for making photon-cutting phosphors for solar energy conversion and mercury-free fluorescent lamps [13,14].
The present paper is devoted to the investigation of the transition between the glass and glass-ceramic in RE doped lead fluorogermanate glass, RE = Eu or Gd. It reports also the study of the lead fluoride nanoparticles of the glass-ceramic using both electron microscopy and Xray diffraction. It will be shown that these nanocrystals are constrained, with a unit cell parameter decrease that can reach about 1% with respect to this of the ceramic of the same composition.
2. Experimental
2.1. Samplepreparation
2.1.1. Glass-Ceramics Containing RE3+: β-PbF2 Nanocrystallites
A family of REF3-doped lead fluorogermanate glasses having the following compositions: 50GeO2-40PbO-10 PbF2-xREF3, RE = Gd, Eu, 0 < x ≤ 2 was prepared as described in a previous paper [11]. Then, the glasses were heated at 390˚C for 10 hours, unless told otherwise. In the case of Eu3+, it has been shown that this devitrification process lead to a glass-ceramic made of Eu3+: β- PbF2 nanocrystals embedded in a glassy oxide matrix [11, 12,15-17]. Then, considering that lead fluoride amounts to 10% of the glasses composition, the glass-ceramics will be labelled GCRE10x (RE = Eu or Gd), assuming a total segregation of the Rare-Earth in the RE3+: PbF2 nanocrystals. Consequently, the parent glasses will be referred to GRE10x. For the GCEu20 glass-ceramic, the Eu3+: β-PbF2 nanocrystallites were extracted from the glassy matrix by dissolving it in 10% hydrofluoric acid at room temperature for 7 hours [18]. The insoluble precipitate resulting from the chemical attack was separated by centrifugation, washed in distilled water and then dried in air.
2.1.2. RE3+: β-PbF2 Ceramics
RE3+: β-PbF2 ceramics having the compositions 100 PbF2, y REF3, with y = 5, 10, 15 and 20, and RE = Gd, Eu (hereafter labeled CREy) were prepared by crushing together, in an agate mortar, oven-dried commercial PbF2 and REF3 powders in appropriate amounts. The mixture was then heated at 550˚C for 3 hours. It appeared essential to prevent the partial oxidation of PbF2 into lead oxyfluoride Pb2OF2 by conducting the heat treatment under a dry inert argon flow. X-ray diffraction was used to control that the as prepared CREy are single phased materials.
2.2. Experimental Techniques
Characteristic temperatures of the glasses, such as glass transition, crystallization onset and melting point, were determined from DTA (differential thermal analysis) curves obtained with a double symmetric analyzer TAG24 by Setaram. About 60 mg of calibrated powder (particle size between 45 and 71 μm) of the sample were placed in an alumina crucible and compared to a burnt alumina neutral sample. The heating rate was 10˚C/min.
The samples were studied by powder X-ray diffraction (XRD). The measurements were performed on a BRUKER AXS D5000 diffractometer equipped with a cobalt anode (λKα = 1.789 Å) for identification of the crystalline phases. To determine the unit cell parameters, the diffractometer was equipped with a copper anode and a secondary monochromator (λKα1 = 1.5406 Å, λKα2 = 1.5444 Å). The zero shift of the goniometer was previously measured using a standard reference material (Al2O3 from National Institute of Standards and Technology). The 2θ angular resolution was 0.02˚. The diffraction patterns were scanned over the 2θ range 20˚ - 80˚. X-ray powder patterns were firstly analyzed using the software EVA [19, 20]. The Kα2 components of the diffraction lines were subtracted and the positions of diffraction peaks were then carefully measured in order to refine the cell parameters using the software CHECKCELL [21].
Transmission electron microscopy (TEM) and associated selected area electron diffraction (SAED) patterns were performed on a 200-kV Phillips CM20 microscope. The fine powder samples were placed onto a carboncoated copper grid. The microscope was equipped with an energy dispersive X-ray (EDX) analyzer which enables fluoride nanocrystals microanalysis with a detection limit of 0.1 at%.
3. Results
3.1. Crystallization of the Glass-Ceramics
The DTA curves of the GGd10x glasses, as a function of x, are given Figure 1. Starting from the low temperature side of the curves, one observes successively:
• The vitreous transition Tg, around 340˚C for all the glasses.
• An exothermic peak labeled Tc around 400˚C, associated with the crystallization of the Gadolinium-doped β-PbF2 phase. Its temperature decreases when the
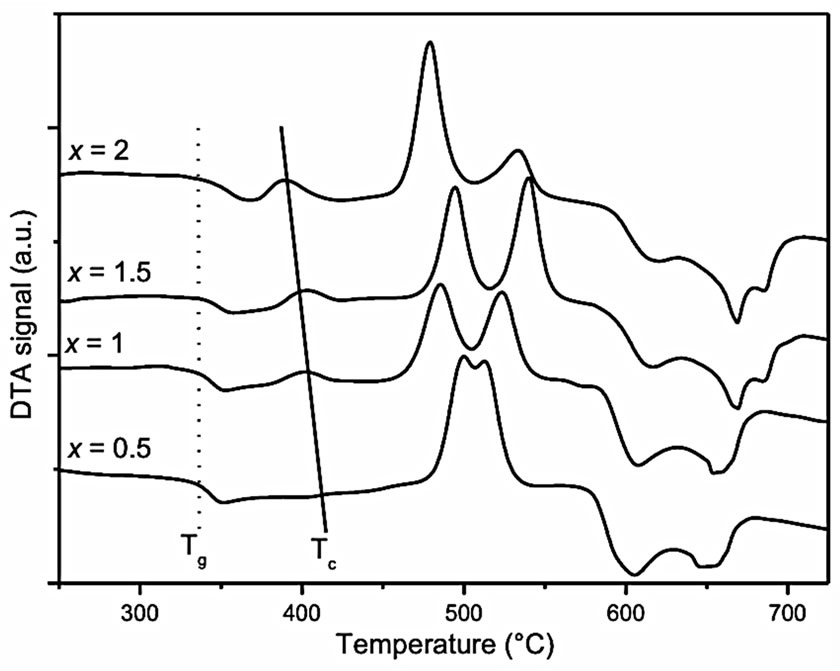
Figure 1. DTA curves of the GGd10x glasses. The dotted and solid lines indicate roughly the evolution of the glass transition temperature Tg and the maximum of the Gd3+: PbF2 crystallization peak Tc respectively.
Gd3+ doping rate increases.
• Several exothermic crystallization peaks between 460˚C and 550˚C that correspond to the formation of the mixed oxide phases PbGeO3 and PbGe4O9, as checked by XRD.
• Several endothermic peaks corresponding to the melting of the Gd3+: β-PbF2 and oxide phases above 550˚C.
These curves are quite similar to those obtained for the GEu10x series of glasses that have already been reported [11]. Nevertheless, it must be pointed out that, for a given x value, the Tc(RE: β-PbF2) is slightly shifted towards higher temperature for RE = Gd compared to Eu. For example for x = 1.5, Tc(Eu: β-PbF2) = 390˚C and Tc(Gd: β-PbF2) = 400˚C.
XRD can also be used to follow the crystallization rate of the glasses. As an example, Figure 2 reports the XRD of three glasses of the GCEu10x series obtained after annealing the parent glasses at 390˚C for 10 hours. The narrow Eu3+: β-PbF2 (cubic, fluorite type) XRD peaks, are superimposed on broad bands centered around 2θ = 33˚ and 55˚ (for a cobalt anode) characteristic of the remaining amorphous oxide matrix.
It appears that the Eu3+: β-PbF2 Bragg peaks are very weak for x = 0.5, but rather strong for x = 2. To characterize the glass crystallization rate, one can separate the contributions of the RE: β-PbF2 peaks and of the glassy matrix by simulating the XRD trace as a sum of lorentzian lines and bands. Let us define the crystallization rate R as the ratio between the sum of the intensities of the first four RE: β-PbF2 diffraction lines, over the area of the whole XRD trace shown in Figure 2.
The R values for GCRE10x glass-ceramics obtained at 390˚C for 10 hours are reported Table 1. For GCGd20, the glassy oxide matrix begins to crystallize under such heat treatment. Therefore, for this sample, the annealing temperature was lowered to 385˚C (Table 1).
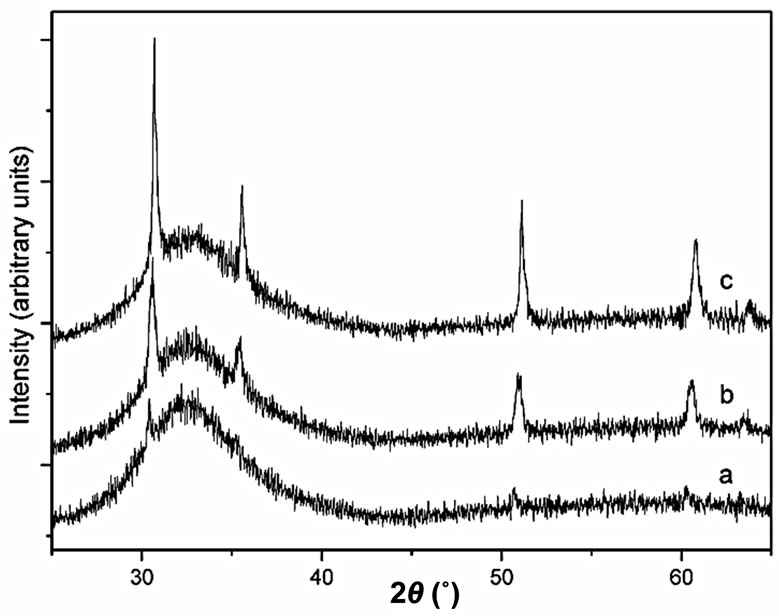
Figure 2. XRD patterns (cobalt anode) of three GEu10x glassceramics after annealing at 390˚C for 10 hours: (a) x = 0.5; (b) x = 1.5; (c) x = 2.
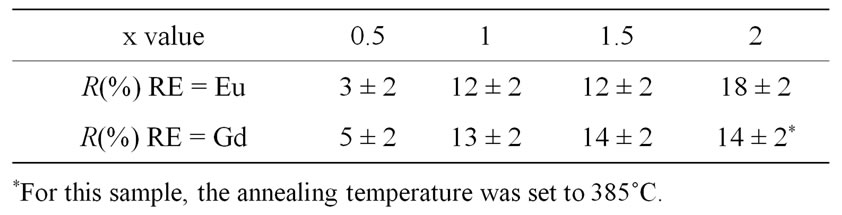
Table 1. XRD R values (see text) as a function of the RareEarth type and content (x) in the GCRE10x glass-ceramics obtained by annealing of the parent glasses at 390˚C for 10 hours.
In the GCEu10x series, it can be observed that the highest R value, obtained for GCEu20, is 18% ± 2% (Table 1). For this compound, R remains constant either when increasing the annealing duration at 390˚C or by increasing the annealing temperature to 400˚C. Therefore, it can be considered that R = 18% ± 2% corresponds to the complete crystallization of the Eu3+: β-PbF2 phase in the glass-ceramics. Let us consider now the GCGd10x series. It must be noticed that Eu: β-PbF2 and Gd: β-PbF2 have very similar chemical composition, essentially made of PbF2, since their RE/Pb ratio is at most equal to 0.2. The mass attenuation coefficients of europium and gadolinium for the cobalt Kα X-ray wavelength are very close. Furthermore, these chemical elements are neighbors in the periodic table, and have very similar atomic diffusion factors. Then, the intensities of the XRD peaks of GCEu10x and GCGd10x are expected to be almost identical for a given crystallization rate. It follows that R values for GCEu10x and GCGd10x can be directly compared and the total crystallization for GCGd10x sample would correspond also to a R value close to 18%. Unfortunately, GCEU20 and GCGd20 samples cannot be compared easily because of different annealing temperatures.
3.2. RE: PbF2 Nanoparticles Size and Shape in the Glass-Ceramics
The crystallite sizes L of the RE: PbF2 in the glass-ceramics can be extracted from the width at half maximum Δ(2θ) of the RE: PbF2 Bragg diffraction peaks according to the Scherrer formula
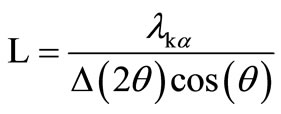
in which  is the Kα X-ray wavelength.
The L values for the RE: PbF2 nanocrystals in the annealed GCRE10x glass-ceramics, averaged over the four first XRD peaks, are reported in Table 2.
The RE: PbF2 nanoparticles shape in the glass-ceramics has been studied using electron microscopy. Figure 3 shows the TEM images of two glass ceramics samples: GCGd15 (Figure 3(a)) and GCEu20 (Figure 3(b)).
3.3. RE3+: PbF2 Unit Cell Parameters of the Glass-Ceramics and Ceramics
The RE3+: β-PbF2 unit cell parameters a of the CREy ceramics and GCRE10x glass-ceramics obtained after annealing of the parent glasses are gathered in Table 3 and shown in Figure 4. It has been shown previously that in the GCRE10x glass-ceramics, a is independent of the crystallization rate [22,23]. The first nanocrystals that precipitate in a GRE10x glass have the same composition than the last ones, e.g. 10x REF3 - 100 PbF2. Generally
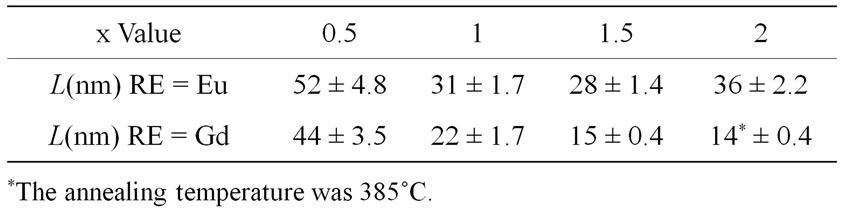
Table 2. RE3+: β-PbF2 crystallite sizes in the glass-ceramics obtained by annealing at 390˚C for 10 hours, calculated from the linewidth of the RE3+: PbF2 Bragg diffraction peaks.
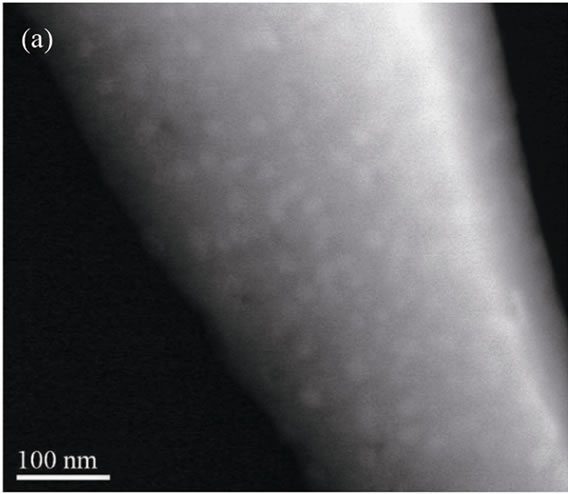
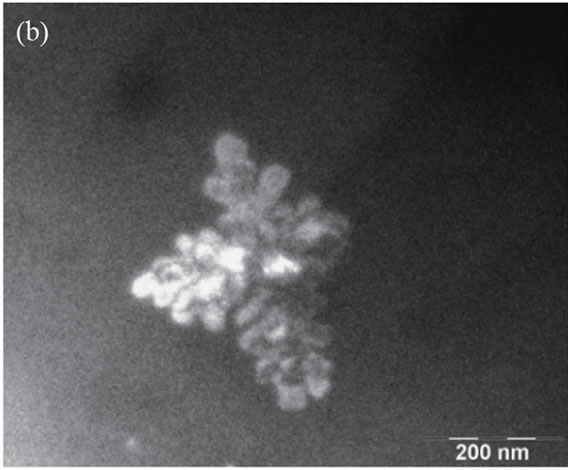
Figure 3. Transmission electron micrograph showing the RE: β-PbF2 nanoparticles embedded in the glassy matrix in: (a) GCGd15 glass-ceramic; (b) GCEu20 glass-ceramic (dark field image).

Table 3. Unit cell parameters (Å) of the RE3+: β-PbF2 phase in the CREy ceramics, and GCRE10x glass-ceramics obtained after annealing of the parent glasses at 390˚C for 10 hours (e.s.d. are given in brackets).
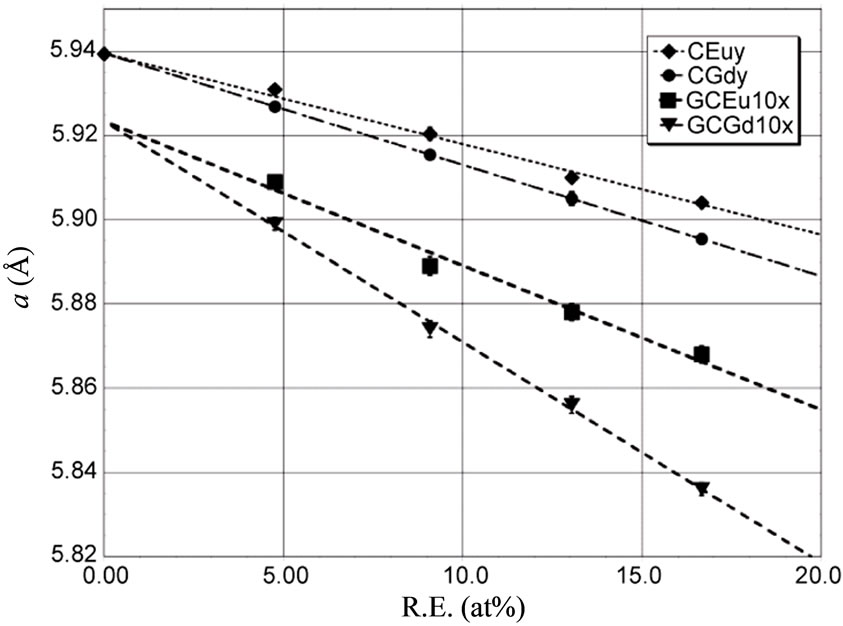
Figure 4. Variation of the unit cell parameter of the RE3+: β-PbF2 phases in the ceramics CREy and glass-ceramics GCRE10x as a function of the Rare Earth atomic fraction  in these phases for RE = Gd and Eu.
speaking, the size of the RE:PbF2 unit cell is always smaller than the pure β-PbF2 one (a = 5.94 Å) [24] and decreases when the RE content increases. In the CREy ceramics and the GCRE10x glass-ceramics, the variation of the unit cell parameter a, as function of their Rare Earth content, obeys the Vegard’s law, e.g. it depends linearly on the RE atomic fraction. For a given RareEarth content, the unit cell parameter a is always smaller for Gd than for Eu in the CREy series as well as in the GCRE10x one.
In the case of the ceramics, and for both Gd and Eu, a extrapolates for y = 0 to the pure β-PbF2 unit cell parameter value (Figure 4) as expected. However, for a given RE and a given doping rate, the unit cell parameter of the RE3+: PbF2 nanoparticles in the glass-ceramic is always significantly smaller than the unit cell parameter of the ceramic (Table 3). The lines of the Gd and Eu glass-ceramics (Figure 4) extrapolate for x = 0 to a = 5.924 Å.
3.4. Investigation of the Eu: PbF2 Nanoparticles Extracted from the GCEu20 Sample
The XRD of the insoluble mixture obtained after HF attack of the GCEu20 glass-ceramic, as described above, is shown in the Figure 5(a). For sake of comparison, the XRD of the GCEu20 sample prior to the chemical attack and of the CEu20 ceramic are also given Figures 5(d) and (c) respectively.
Under chemical treatment of the glass-ceramic with HF, the (50GeO2-40PbO) glassy matrix transforms into soluble GeF4 and insoluble α-PbF2. Since the Eu3+: β-PbF2 nanoparticles extracted from the glass are also insoluble, one obtains a mixture, the two component of which are easily distinguished using transmission electron microscopy imaging as shown in Figure 6. The α- PbF2 crystals appear as needles ~2 µm long and ~200 nm in diameter. They are surrounded by the Eu3+: β-PbF2 nanocrystallites, which are much smaller and often agglomerated into dendrimers shaped nanoparticles typically 100 nm in size. The chemical composition of the two kinds of lead fluoride was established using EDX microanalysis. The Eu3+: β-PbF2 composition, averaged over several nanocrystallites, is (in atomic %): Pb: 24.9, Eu: 5.6, F: 69.5.
The large α-PbF2 needles are surrounded by smaller Eu doped β-PbF2 nanoparticles. Since the glass-ceramic contains 40PbO, which transform into 40 α-PbF2 upon HF attack and 10 Eu3+: β-PbF2, the α-PbF2 dominate in the XRD of the insoluble mixture (Figure 5(a)). The Eu3+: β-PbF2 XRD peaks, which are at the same diffraction angles than in the parent glass-ceramic GCEu20 (Figure 5(d)) have been marked with arrows in Figure
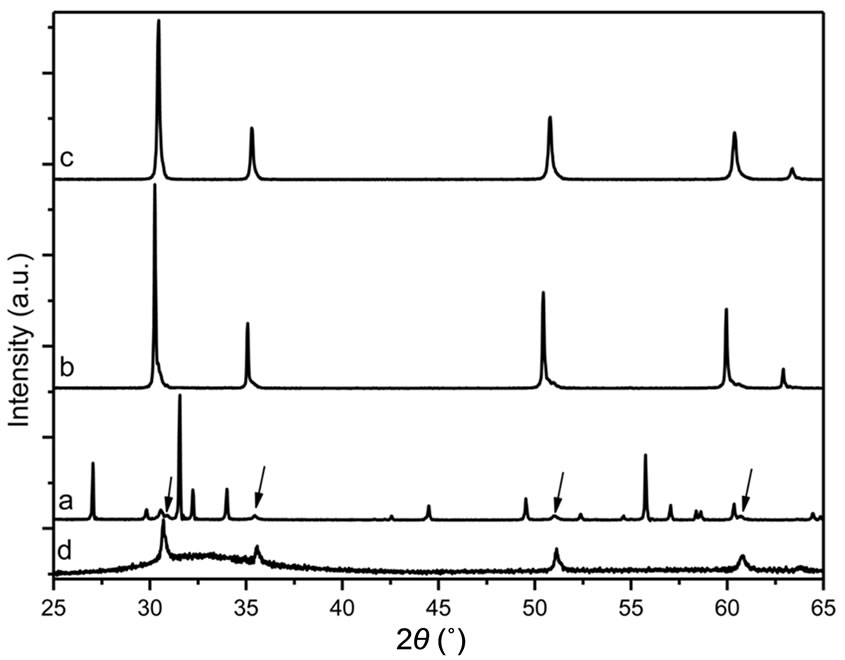
Figure 5. XRD patterns (cobalt anode) of the mixture resulting from the HF attack of GCEu20 glass-ceramic. (a) as obtained after drying, (b) after annealing at 400˚C for 3 hours under argon atmosphere. The XRD patterns of CEu20 ceramic (c) and GCEu20 prior to HF attack (d) are given for comparison. The arrows on trace (a) indicate the XRD peaks of the Eu3+: β-PbF2 nanocrystallites which are at the same position than those of trace (d).

Figure 6. TEM image of the mixture resulting from HF attack of the GCEu20 glass ceramic.
5(a), in order to facilitate their identification.
Figure 5(b) exhibits the XRD pattern of the above mixture after annealing for 3 hours at 400˚C under argon atmosphere in order to prevent the lead fluoride oxidation. Under such conditions, metastable α-PbF2 transforms into undoped β-PbF2. The Eu3+: β-PbF2 nanocrystallites manifest themselves as a shoulder on the large angle side of each undoped β-PbF2 peak, which dominate the XRD diagram. Figure 7 presents, as an example, an expanded view of the XRD diagram shown in Figure 5(b), around 2θ = 51˚ (cobalt anode) corresponding to the β-PbF2 (311) peak region. The observed trace can be fitted as a sum of three lorentzian peaks labeled A, B and C in Figure 7.
4. Discussion
4.1. Nucleating Efficiencies of the RE Dopants in the Glass-Ceramics
The nucleating character of the Rare-Earth ions in the REF3-doped lead fluorogermanate or fluorosilicate glasses is well documented [4,6-8,11]. Here, the Eu3+ and Gd3+ nucleating role is evidenced by the decrease of the β-PbF2 crystallization temperature when the Rare-Earth content of the glasses increases as shown in Figure 1. Evolution of the XRD patterns (Figure 2) and crystallization rate R (Table 1) of the GCRE10x glass-ceramics, as a function of the RE doping rate, confirms that RE3+ ions promote the crystallization of the lead fluoride nanocrystals. Assuming that the crystallization rate R of the glass GREy varies linearly with the amount of RE3+: β-PbF2 nanocrystals formed, one can deduce that there are only about 1/4 of the total PbF2 content of the glass that form RE3+: β
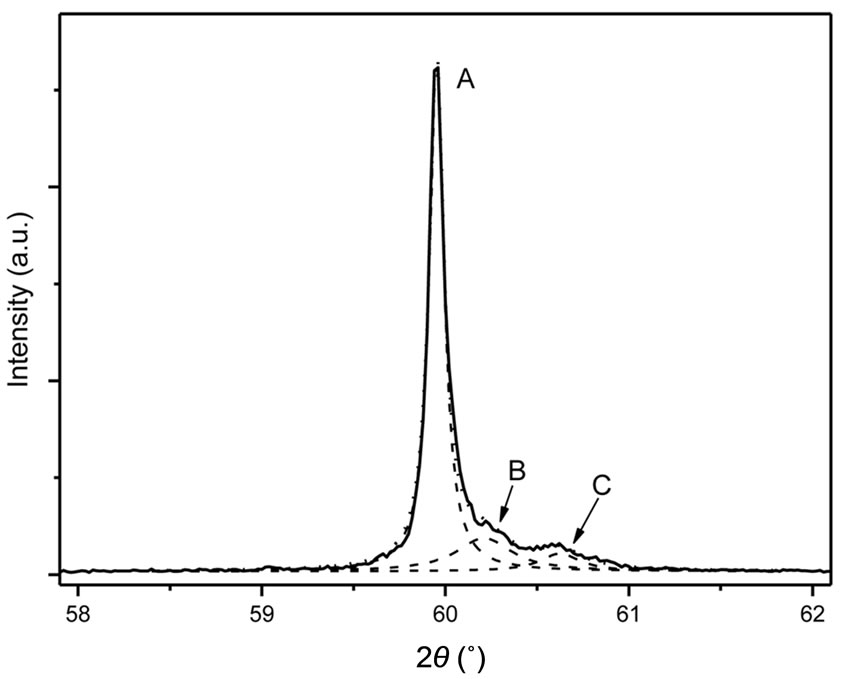
Figure 7. Expanded view of the (311) XRD peak (cobalt anode) of the insoluble mixture resulting from the HF attack of the GCEu20 ceramic after annealing for 3 hours at 400˚C. The observed peak can be deconvoluted into three lorentzian peaks labeled A, B and C.
PbF2 nanocrystals for GCRE5 and 2/3 for GCRE10 (Table 1).
The present results allow comparing the nucleating efficiencies of GdF3 and EuF3. Since the PbF2 crystallization peaks are at slightly lower temperatures for Eu than for Gd, for a given Rare-Earth content, one can infer that in the GRE10x glass, europium has a slightly better β- PbF2 nucleating efficiency than gadolinium.
In previous works dealing with similar glasses doped with CeF3, ErF3 and YbF3 [8,25], it was shown that the RE:β-PbF2 nucleation efficiency order of the Rare-Earth was Ce > Er > Yb. Table 4 gives the ionic radii, according to [26], of Pb2+ and several RE3+ ions in eightfold coordination and also crystallization temperatures of GRE10x glasses for x = 1.5 and x = 2. It appears that the bigger is the Rare-Earth cation, the higher is its lead fluoride nucleating power in the glass. Indeed, for a given REF3 content (10x) of the GRE10x glasses, the crystallization temperature increases when the R.E. ion size decreases (Table 4). It means that the efficiency of the Rare-Earth ion to promote the precipitation of RE3+: β-PbF2 nanocrystallites increases with the R.E. ion size. This may be related to the stability of the RE: β-PbF2 fluorite solid solution, whose solubility limit, and consequently thermodynamic stability, decreases when the RE ionic radius decreases [24], e.g. when the size difference with respect to Pb2+ increases. It is more difficult to deduce the relative nucleating efficiencies of Eu and Gd using the crystallization rates R (Table 1). The R values for GCRE10x glass-ceramics (R.E.: Eu and Gd) for a given R.E. content are almost the same taking into account the standard errors.
4.2. Size and Morphology of the RE3+: β-PbF2 Nanoparticles in the Glass-Ceramics
In the GCGd10x series, the Gd3+: β-PbF2 nanoparticles are rather spherical and rather monodisperse as exemplified Figure 3(a) for the GCGd15 glass-ceramic. The nanoparticles diameter is about 18 nm, in good agreement with the crystallite size of 15 nm deduce from the XRD linewidth (Table 2). Thus, the nanoparticle sizes can be
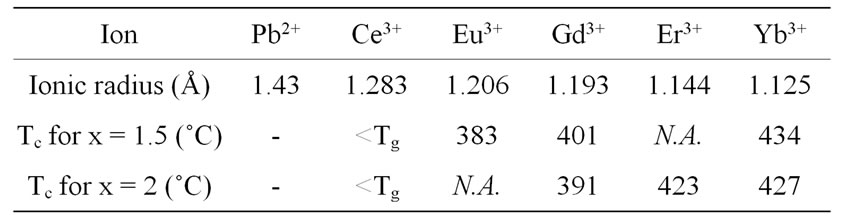
Table 4. Ionic radii (eightfold coordination) of lead and some Rare-Earth cations according to [26] and crystallization temperatures (Tc) for x = 1.5 and x = 2 (this work for Eu3+ and Gd3+ and ref [8,25] for the other rare earths) N.A.: not available because the crystallization peak is masked by another phenomenon, <T g: crystallization occurs at a temperature lower than the glass transition one.
assimilated with the nanocrystallites ones obtained from XRD. The Gd3+: β-PbF2 nanoparticle sizes decrease when the RE content of the glass increases (Table 2). This observation is in agreement with the increase of the nucleating efficiency with the R.E. content described in the previous part. This is easily understood when considering that higher is the RE content of the starting glass, the larger is the number of crystallization seeds, which therefore have no surrounding matter let to grow. Consequently, the nanocrystals are smaller.
On the contrary, the shape of the Eu3+: β-PbF2 nanoparticles of the GCEu10x series appears dendritic and not spherical, as shown in Figure 3(b) for the GCEu20 material. Consequently, the crystallite sizes obtained from XRD (Table 2) differ from the nanoparticles size for the europium doped glass-ceramic. Dentritic nanoparticles seem clearly constituted of several crystallites. Thus, it is difficult to correlate safely the evolution of the crystallite sizes with the nucleating efficiency as function of the R.E. content or as function of the R.E. element.
4.3. Influence of the RE Content and Nature on the RE3+: β-PbF2 Unit Cell Parameters
We will first consider the decrease of the unit cell parameter of the CREy ceramics when their REF3 content y increases as reported in Figure 4 and Table 3. This decrease, for various RE cations, has already been noticed in previous studies for the ceramics [24,27] and also for glass-ceramics [8,23], but the reasons for that were not fully discussed to our knowledge.
This decrease can be explained basically on the basis of sterical effects as follows. The RE3+: β-PbF2 ceramics have the cubic fluorite structure which can be described as a packing of fluoride cubes of a/2 edge, the centre of which are alternatively empty and occupied by the Pb2+ cations. The CREy ceramics have the composition of points of the solid solution PbF2-REF3, which can be formulated Pb1–zREzF2+z where z, the atomic fraction, is expressed as . An approximate structural description of the Pb1–zREzF2+z compounds is to consider that z Pb2+ are replaced by z RE3+ cations, while simultaneously, z interstitial fluoride ions takes place in the empty cubes of the structure and a part of fluoride ions migrate from normal positions to interstitial ones [24]. The F– ionic radius is taken equal to the greatest value ~1.19 Å and the RE3+ cations ionic radii (in eightfold coordination) are given in Table 4. Let us first consider that the interstitial fluorides do not significantly affect the unit cell parameter of CREy. It seems reasonable since the fluoride cube in which they lie is large enough to geometrically accommodate them. Indeed, assuming that the interstitial F– is in the centre of the cube, the closest distance between fluoride ions occurs on the cube diagonal. For CRE20 for instance, a ~ 5.90 Å and
 Å is larger than 4r(F–) = 4.76 Å.
On the contrary the replacement of Pb2+ by smaller RE3+ ions will decrease the cation-anion distance in the substituted cubes and therefore the unit cell parameter. The higher is the RE content of the CREy, the smaller will be the a parameter value. Furthermore, for a given RE content, since r(Gd3+) is slightly smaller than r(Eu3+), the solid solution unit cell parameter will be smaller for RE = Gd, than for RE = Eu. This is exactly what is observed in Figure 4.
On a more quantitative point of view, taking the ionic radii given Table 4 and assuming that F– and RE3+ touch each other along the diagonal of the a/2 edge cube, one must estimate the unit cell parameter of a hypothetic fluorite crystal in which all Pb2+ ions would have been replaced by RE3+. This gives 5.53 and 5.50 Å for Eu3+ and Gd3+ respectively. Then, for instance for the CRE20 solid solutions, in which the RE atomic fraction is 16.67%, one expect a unit cell parameter to be the weight averaged unit cell of β-PbF2 and of the above hypothetic RE fluorites. This gives 5.872 for CEu20 and 5.866 for CGd20, in reasonable agreement with the experimental values, 5.904 and 5.895 respectively (Table 3). The difference between calculated and experimental values may be due to the effect of the interstitial fluorides, which tend to expand the cubes in which they lie, because of electrostatic repulsion between the interstitial F– and those occupying the vertices of the cubes. The same arguments hold for the evolution (Figure 4 and Table 3) of the RE3+: β-PbF2 unit cell parameter in the GCRE10x glassceramics, as function of the RE content x and of the RE type.
4.4. Comparison of the Unit Cell Parameters of the RE3+: β-PbF2 Ceramics and Nanoparticles
It must now be discussed why, for a given RE ion and a given doping rate, the a unit cell parameter of the RE3+: β-PbF2 nanocrystals of the glass-ceramic is always smaller than that of the ceramic as shown in Figure 4 and Table 3. For GCGd20, the difference is 0.059 Å (Table 3), which represent approximately 1% or the unit cell parameter value. We propose that this difference is due to a pressure effect exerted by the glassy oxide matrix of the glass-ceramic on the RE3+: β-PbF2 nanocrystals.
Two hypotheses may be set out to account for this constrain.
At first, it may come from a difference in the thermal expansion coefficient between the RE3+: β-PbF2 nanocrystals that form under annealing of the parent glass for 10 hours at 390˚C and the remaining glassy matrix.
The thermal expansion coefficient α of pure lead fluoride is typically 50 × 10–6 K–1 at 400˚C [28]. One can assume that the RE3+: β-PbF2 nanocrystals have a similar α value. The thermal expansion coefficient of the remaining germanate glass is unknown. However, several similar glasses have been investigated in the literature. Mixed-alkali germanate glasses have α values of 10 - 15 × 10–6 K–1 at 300˚C [29] and mixed silicate—germanate glasses have α values of typically 10 × 10–6 K–1 between 293 and 573 K [30]. It is therefore reasonable to assume that the RE3+: β-PbF2 nanocrystals have higher thermal expansion coefficients than the remaining glassy matrix. The formation of the RE3+: β-PbF2 nanocrystals begins when the parent glass reach 390˚C, and is ended after a 10 hours heat treatment. Therefore these nanocrystals cannot be constrained upon cooling, since they shrink more than the remaining glassy matrix.
We are let with the second hypothesis which considers that the RE3+: β-PbF2 nanocrystals are constrained by the glassy matrix as soon as they form and grow upon annealing at 390˚C. It must be recalled that, for a given heat treatment, the devitrification rate of the GRE10x glass increases with y. For GRE5, only ~25% of the RE3+: β-PbF2 nanocrystals are formed while 100% are formed upon the same annealing of GRE20 (section 4.1). The higher is the nanocrystals content of the GCRE10x, the stronger will be the pressure exerted by the glassy matrix which cannot accommodate a large number of RE3+: β- PbF2 nanocrystals. Furthermore, the fluorine content of glass decreases when the lead fluoride crystallizes amplifying the constraint applied on nanocrystallites. Indeed, the pure oxide glass exhibits a more rigid network than the oxyfluoride one. This explain why the difference between the unit cell parameters a of the ceramic and the glass ceramic, for a given REF3 content (y = 10x), increases with this content (Figure 4).
According to Table 3, the difference between the unit cell parameter of the glass ceramic and ceramic can reach 1%, for GCGd20 compared to CGd20. For α-PbF2, such shrinkage would correspond to an applied pressure of 1.6 GPa [31]. For the 20 % Gd3+ β-PbF2 nanocrystals in the GCGd20 glass ceramic, the applied pressure is probably very similar.
4.5. Unit Cell Parameter of the Eu3+: β-PbF2 Nanoparticles Extracted from the GCEu20 Glass-Ceramic
As indicated in section 3.4, EDX microanalysis was performed on the nanocrystallites extracted from the GCEu20 glass-ceramic. It gives: Pb: 24.9%, Eu: 5.6%, F: 69.5%, in atomic %. No oxygen was detected, confirming that the glassy oxide matrix has been completely removed by the hydrofluoric acid treatment. Theoretically, considering the total precipitation of the Eu3+: β-PbF2 phase in the GCEu20 glass-ceramic and full segregation of europium ions into the lead fluoride, the Eu: β-PbF2 nanocrystallites formula should be Pb10Eu2F26, e.g. Pb: 26.3%, Eu: 5.3%, F: 68.4% (in atoms). This agrees rather well with the experimental determination given above.
It appears that the Bragg peaks of nanocrystallites extracted from the GCEu20 glass-ceramic, indicated by arrows in Figure 5(a), are exactly at the same positions than in the GCEu20 sample (Figure 5(d)), and shifted from those of the CEu20 Eu3+: β-PbF2 ceramic (Figure 5(c)). It means that the unit-cell parameter of the extracted nanocrystallites remains unchanged during the extraction process. The nanocrystallites remain constrained at room temperature even when the glassy matrix is removed.
After annealing of the extracted nanocrystallites for 3 hours at 400˚C, the Bragg diffraction peaks (Figure 5(b)) have a composite structure and can be fitted as a sum of three lorentzian peaks. For example, this is demonstrated in Figure 7 for the β-PbF2 (311) peak region around 2θ = 60˚ (cobalt anode). The A peak is due to undoped β-PbF2 which was formed by transformation, under annealing, of the α-PbF2 resulting from the chemical attack of the glassy matrix. The C peak is identical to the one of the Eu3+: β-PbF2nanocrystallites of the GCEu20 glass ceramic and B identical to the diffraction peak of the Eu3+: β-PbF2 ceramic CEu20. Thus, by this annealing treatment, the constrained metastable nanocrystallites extracted from the GCEu20 glass-ceramics have been partly converted to relaxed Eu3+: β-PbF2 of the same composition. Assuming that the proportion of the B and C species are proportional to their peak areas, approximately 77% of the constrained nanocrystallites have been converted into regular Eu3+: β-PbF2 under such heat treatment. The B and C peak are broader than the A one. This is due to a smaller size of the constrained and relaxed nanocrystallites compared to that of the β-PbF2 resulting from the transformation of α-PbF2.
Increasing the annealing duration at 400˚C to 6 and 12 hours leads to a slight increase of the conversion rate of the constrained nanocrystallites but they do not disappear. This indicates that the activation energy barrier which separates the regular Eu3+: β-PbF2 particles, similar to the CEu20 ceramic, and the constrained ones, as it was in the glass ceramic, is rather high. For a 12 hour annealing, one notice a slight shift of the A peak towards larger diffraction angles, indicating that some europium is diffuseing from the doped nanoparticles to the pure β-PbF2 particles. Annealing of the constrained metastable nanocrystallites to 500˚C for 3 hours completely relax the strains and only one diffraction peak, lying between the A and B one shown in Figure 7, is observed. This indicates that the undoped β-PbF2 crystals have reacted with the doped particles to give β-PbF2 with an intermediate doping rate, whose experimental a parameter is equal to ~5.93 Ǻ. Since the composition of the original glass is 40 PbO for 10 Eu3+: β-PbF2, the composition of the averaged ceramic is expected to correspond to CEu4 ceramic, whose unit cell a parameter, equal to 5.933 Ǻ (Figure 3), is in good agreement with the experimental one.
5. Conclusions
Annealing of the glasses with composition 50GeO2- 40PbO-10PbF2-xREF3, RE = Eu, Gd, lead to the precipitation of RE3+: β-PbF2 nanocrystallites embedded in a (50GeO2-40PbO) glassy oxide matrix. Evolution of the crystallization temperature as function of the doping rate, crystallization rate R and nanocrystallites size show that the Rare Earth ions have a strong nucleating effect for promoting the formation of RE3+: β-PbF2 nanocrystals from the lead fluoro-germanate glass. The nucleating effect is slightly stronger for Eu3+ than for Gd3+. This is related to the larger size of the europium ion, and to a higher stability of the Eu3+: β-PbF2 solid solution.
The unit cell parameter of the fluorite type RE3+: β-PbF2 solid solution decreases when the Rare Earth content increases and, for a given RE content, is always smaller for Gd than for Eu. This is quantitatively explained by the replacement of Pb2+ ions by smaller RE3+ cations, with simultaneous incorporation of interstitial F– ions in the lattice.
The RE3+: β-PbF2 nanocrystallites in the GCRE10x glass ceramics have always smaller unit parameters than the ceramics CREy of the same Rare Earth content. The highest difference observed can reach 1% for GCGd20, compared to CGd20. This is explained by considering that the glassy matrix exert a high pressure on the nanocrystallites formed under annealing. In the above-mentioned case, this pressure is evaluated to be about 1.6 GPa. The nanocrystallites of the glass-ceramics remain constrained at room temperature, even when the glassy oxide matrix is removed by chemical attack. They return partially to relaxed nanocrystals, with the same unit cell parameter than the ceramic of the same composition, under annealing for several hours at 400˚C. Heating at 500˚C is required to achieve total conversion to unstrained ceramic.
6. Acknowledgements
The authors thank Mrs Akiko Suganuma for her help in the preparation of several samples used in this study.
REFERENCES
- G. Müller and N. Neuroth, “Glass-ceramic—A New Laser Host Material,” Journal of Applied Physics, Vol. 44, No. 5, 1973, pp. 2315-2318. doi:10.1063/1.1662556
- P. A. Tick, N. F. Borrelli, L. K. Cornelius and M. A. Newhouse, “Transparent Glass-Ceramics for 1300 nm Amplifier Applications,” Journal of Applied Physics, Vol. 78, No. 11, 1995, pp. 6367- 6374. doi:10.1063/1.360518
- M. C. Gonçalves, L. F. Santos and R. M. Almeida “Rareearth-Doped Transparent Glass-Ceramics,” Comptes Rendus Chimie, Vol. 5, No. 12, 2002, pp. 845-854. doi:10.1016/S1631-0748(02)01457-1
- M. Mortier, “Between glass and Crystal: Glass-Ceramics, a New Way for Optical Materials,” Philosophical Magazine Part B, Vol. 82, No. 6, 2002, pp. 745-753. doi:10.1080/13642810208224364
- M. Mortier and D. Vivien, “Ceramic and Glass-Ceramic lasers,” Annales de Chimie—Science des Matériaux, Vol. 28, No. 6, 2003, pp. 21-33. doi:10.1016/j.anncsm.2003.09.003
- V. Lavin, F. Lahoz, I. R. Martin and U. R. RodriguezMendoza, “Optical properties of the Rare-Earth Ions in Transparent Oxyfluoride Glass-Ceramics” in: R. Balda, Ed., Photonic Glasses, Research Signpost, Kerala, 2006, pp. 115-149.
- M. Mortier and G. Dantelle, “Oxyfluoride Transparent Glass-Ceramics,” in: A. Tressaud, Ed., Functionalized Inorganic Fluorides, Willey, New York, 2010, pp. 273 - 306.
- G. Dantelle, M. Mortier, D. Vivien and G. Patriarche, “Nucleation Efficiency of Erbium and Ytterbium Fluorides in Transparent Oxyfluoride Glass-Ceramics,” Journal of Materials Research, Vol. 20, No. 2, 2005, pp. 472- 481. doi:10.1557/JMR.2005.0051
- G. Dantelle, M. Mortier, Ph. Goldner and D. Vivien, “EPR and Optical Study of Yb3+-Doped β-PbF2 Single Crystals and Nanocrystals of Glass-Ceramics,” Journal of Physics: Condensed Matter, Vol. 18, No. 34, 2006, pp. 7905-7922. doi:10.1088/0953-8984/18/34/005
- G. Dantelle, M. Mortier and D. Vivien, “EPR and Optical Studies of Erbium-Doped β-PbF2 Single-Crystals and Nano-Crystals in Transparent Glass-Ceramics,” Physical Chemistry Chemical Physics, Vol. 9, No. 41, 2007, pp. 5591-5598. doi:10.1039/B706735F
- C. Bensalem, M. Mortier, D. Vivien and M. Diaf, “Thermal and Optical Investigation of EuF3-Doped Lead Fluoroger-Manate Glasses,” Journal of Non-Crystalline Solids, Vol. 356, No. 1, 2010, pp. 56-64. doi:10.1016/j.jnoncrysol.2009.09.023
- C. Bensalem, M. Mortier, D. Vivien and M. Diaf, “Optical Investigation of Eu3+: PbF2 Ceramics and Transparent Glass-Ceramics,” Optical Materials, Vol. 33, No. 6, 2011, pp. 791-798. doi:10.1016/j.optmat.2010.12.024
- R. T. Wegh, H. Donker, K. D. Oskam and A. Meijerink “Visible Quantum Cutting in LiGdF4: Eu3+ through Downconversion,” Science, Vol. 283, No. 5402, 1999, pp. 663- 666. doi:10.1126/science.283.5402.663
- C. R. Ronda, “Phosphors for Lamps and Displays: An Applicational View,” Journal of Alloys and Compounds, Vol. 225, No. 1-2, 1995, pp. 534-538. doi:10.1016/0925-8388(94)07065-2
- D. Zhao, X. Qiao, X. Fan and M. Wang, “Local vibration around Rare-Earth Ions in SiO2-PbF2 Glass and Glass-CeRamics Using Eu3+ Probe,” Physica B: Condensed Matter, Vol. 395, No. 1-2, 2007, pp. 10-15. doi:10.1016/j.physb.2006.12.007
- K. Driesen, V. K. Tikhomirov and C. Görller-Walrand, “Eu3+ as a probe for Rare-Earth Dopant Site Structure in Nano-Glass-Ceramics,” Journal of Applied Physics, Vol. 102, No. 2, 2007, Article ID: 024312. doi:10.1063/1.2759195
- L. A. Bueno, A. S. Gouveia-Neto, E. B. da Costa, Y. Messaddeq and S. J. L. Ribeiro, “Structural and SpectroScopic Study of Oxyfluoride Glasses and Glass-Ceramics Using Europium Ion as a Structural Probe,” Journal of Physics: Condensed Matter, Vol. 20, No. 14, 2008, Article ID: 145201. doi:10.1088/0953-8984/20/14/145201
- M. Mortier and G. Patriarche, “Oxide Glass Used as Inorganic Template for Fluorescent Fluoride Nanoparticles Synthesis,” Optical Materials, Vol. 28, No. 12, 2006, pp. 1401-1404. doi:10.1016/j.optmat.2005.07.008
- P. Caussin, J. Nusinovici and D. W. Beard, “Using Digitized X-Ray Powder Diffraction Scans as Input for New PC-AT Search/Match Program,” Advanced X-ray Analysis, Vol. 31, 1988, pp. 423-430.
- P. Caussin, J. Nusinovici and D. W. Beard, “Specific Data Handling Techniques and New Enhancements in Search/Match Program,” Advanced X-ray Analysis, Vol. 32, 1989, pp. 531-538.
- J. Laugier, B. Bochu, “Laboratoire des Matériaux et du Génie Physique, ” 1999. http://www.lmgp.grenoble-inp.fr/
- M. Mortier and G. Patriarche, “Structural characterisation of Transparent Oxyfluoride Glass-Ceramics,”Journal of Materials Science, Vol. 35, No. 19, 2000, pp. 4849-4856. doi:10.1023/A:1005661315593
- G. Dantelle, M. Mortier, G. Patriarche and D. Vivien, “Er3+-doped PbF2: Comparison between Nanocrystals in Glass-Ceramics and Bulk Single Crystals” Journal of Solid State Chemistry, Vol. 179, No. 7, 2006, pp. 1995- 2003. doi:10.1016/j.jssc.2006.03.038
- A. Dib, S. Aléonard and M. Th. Roux, “Synthèse et Caractéristiques Cristallographiques des Phases Solides de Type Fluorine des Systèmes PbF2-LnF3,”Journal of Solid State Chemistry, Vol. 52, No. 3, 1984, pp. 292-301. doi:10.1016/0022-4596(84)90012-4
- G. Dantelle, M. Mortier, D. Vivien and G. Patriarche “Effect of CeF3 addition on the nucleation and UpConversion Luminescence in Transparent Oxyfluoride GlassCeramics,” Chemistry Materials, Vol. 17, No. 8, 2005, pp. 2216-2222. doi:10.1021/cm047821d
- J. E. Huheey, E. A. Keiter and R. Keiter, “Inorganic Chemistry, principle of structure and reactivity,” Harper Collins College Publishers, New York, 1993.
- S. N. Achary, A. K. Tyagi, P. Balog and J. Köhler, “High-Pressure and High-Temperature Studies on Fluorite-Type Pb1–xNdxF2+x (x = 0.15 and 0.25),” Journal of Alloys and Compounds, Vol. 417, No. 1-2, 2006, pp. 250- 253. doi:10.1016/j.jallcom.2005.08.069
- T. S. Aurora, D. O. Pederson and S. M. Day, “Thermal-Expansion and Index-of-Refraction Variation in Lead Fluoride between 300 and 850 K,” Physical Review B, Vol. 41, No. 14, 1990, pp. 9647-9649. doi:10.1103/PhysRevB.41.9647
- J. E. Shelby, “Thermal expansion of Mixed-Alkali GermaNate Glasses” Journal of Applied Physics, Vol. 46, No. 1, 1975, pp. 193-196. doi:10.1063/1.321318
- H. Darwish, S. N. Salama and S. M. Salman, “Contribution of Germanium Dioxide to the Thermal Expansion Characteristics of Some Borosilicate Glasses and Their Corresponding Glass-Ceramics” Thermochimica Acta, Vol. 374, No. 2, 2001, pp. 129-135. doi:10.1016/S0040-6031(01)00481-6
- L. Ehm, K. Knorr, F. Mädler, H. Voigtländer, E. Busetto, A. Cassetta, A. Lausi and B. Winkler, “High-Pressure X-Ray Diffraction Study on α-PbF2,” Journal of Physics and Chemistry of Solids, Vol. 64, No. 6, 2003, pp. 919- 925. doi:10.1016/S0022-3697(02)00437-7
NOTES
*Corresponding author.