Journal of Crystallization Process and Technology
Vol.3 No.1(2013), Article ID:27263,4 pages DOI:10.4236/jcpt.2013.31001
The Oleic Acid Composition Effect on the Carboxymethyl Cellulose Based Biopolymer Electrolyte
Advanced Materials Research Group, Renewable Energy Research Interest Group, Department of Physical Sciences, Faculty of Science & Technology, University Malaysia Terengganu, Terengganu, Malaysia.
Email: *ikmar_isa@umt.edu.my
Received September 6th, 2012; revised October 17th, 2012; accepted October 28th, 2012
Keywords: Solid Biopolymer Electrolyte; Carboxymethyl Cellulose; FTIR; XRD; Conductivity
ABSTRACT
Biopolymer electrolyte based on carboxymethyl cellulose has been prepared by doping with different concentration of oleic acid via solution casting technique. Fourier Transform Infrared spectroscopy was used to study the complexation between the salt and polymer. New peak was observed at 1710, 2850, 2920 cm−1. X-ray diffraction study reveals the amorphous nature of the biopolymer electrolyte. Impedance study shows the highest ionic conductivity, σ, was found to be 2.11 × 10⁻⁵ S·cm−1 at room temperature (303 K) for sample containing 20 wt% of oleic acid and the biopolymer electrolyte obeys Arrhenius behaviour.
1. Introduction
Electrolyte is the barrier that insulates the anode from the cathode in the battery and it is the medium through which ions are transported between the anode and cathode during discharge and charge [1]. The widespread use of batteries has created many environmental concerns, such as toxic metal pollution. Battery manufacture consumes resources and often involves hazardous chemicals. Used batteries also contribute to electronic waste [2].
The development of lithium batteries has gained an unexpected impact in the last two decades for portable telecommunication devices, computers and hybrid electric vehicles have been a constantly increasing [3]. Current commercial for e.g. lithium batteries are using liquid electrolytes, which are highly flammable, so that metal casing has to be used to prevent possible leakage [4]. This problem does not exist for solid biopolymer electrolytes. It will be safer, longer-lasting, lighter, and cheaper than commercial lithium batteries.
Cellulose is the earth’s most widespread natural organic chemical and, thus, highly important as a renewable resource. More intensive exploitation of cellulose, as a renewable feedstock, is aided by the development of suitable solvents for mechanical and chemical processing [5]. In this present study, a solid biopolymer electrolyte is presented to overcome this problem. Electrolyte from cellulose or cellulose derivative which is carboxymethyl cellulose (CMC) was chosen due to the naturally occurring polysaccharide and the most abundant organic substance on the earth. Due to the abundance, low cost and easier process ability, so CMC is chosen in this research.
2. Methodology
2.1. Sample Preparation
CMC (Acros Organic Co.) was dissolved in distilled water. The solution was stirred until the CMC completely dissolved. Different amount in (wt%) of OA (R&M Marketing) was dissolved in ethanol then added to the CMC solution and stirred until it become homogenous. The mixtures were then casted into Petri dishes and dried in oven at 60˚C until film form. The films were then kept in desiccators (with silica gel) for further drying.
2.2. Fourier Transform Infrared (FTIR) Spectroscopy
A Thermo Nicolet Avatar 380 FTIR spectrometer was used to analyze the samples. The spectrometer was equipped with an attenuated total reflection (ATR) accessory with a germanium crystal. The sample was put on a germanium crystal and infrared light was passed through the sample with a frequency ranging from 4000 to 675 cm−1 with spectra resolution of 4 cm−1.
2.3. X-Ray Diffractometry (XRD)
XRD measurements were performed on a Rigaku MiniFlex II diffractometer equipped with an X’celerator, using CuKα radiation in the range of 2θ = 5˚ to 80˚.
2.4. Electrochemical Impedance Spectroscopy (EIS)
Conductivity of the CMC-OA biopolymer electrolytes were measured by using the HIOKI 3532-50 LCR HiTester that was interfaced to a computer in frequency range 50 Hz to 1 MHz. The software controlling the measurement also calculates the real and imaginary impedance. The films were cut into a suitable size of 2 cm diameter and placed between the blocking stainless steel electrodes of a conductivity cell which are connected by leads to a computer. The bulk impedance (Rb) value was obtained from the plot of negative imaginary impedance (Zi) versus real part (Zr) of impedance and the conductivity of the sample was calculated from the Equation (1).
 (1)
(1)
where A = Area of film-electrode contact and t = Thickness of the film (in cm).
3. Results and Discussion
3.1. FTIR Study
Figure 1 shows the FTIR spectrum of CMC and OA from 700 to 4000 cm−1. The characteristic transmission band at 3315 cm−1 can be attributed to the hydrogen bonding OH stretching region [6]. According to [7], the small hump at 2920 cm−1 was ascribed to C-H stretching associated with the ring methane hydrogen atoms. The band at 1590 cm−1 confirmed the presence of COO− and assigned to stretching of the carboxyl group [7]. The band at 1410 cm−1 and 1320 cm−1 was assigned to OH stretching in-plane and C-H stretching in symmetric of CMC. The IR spectrum of CMC polymer showed the bands at 1110 cm−1 and 1040 cm−1 were characteristic of
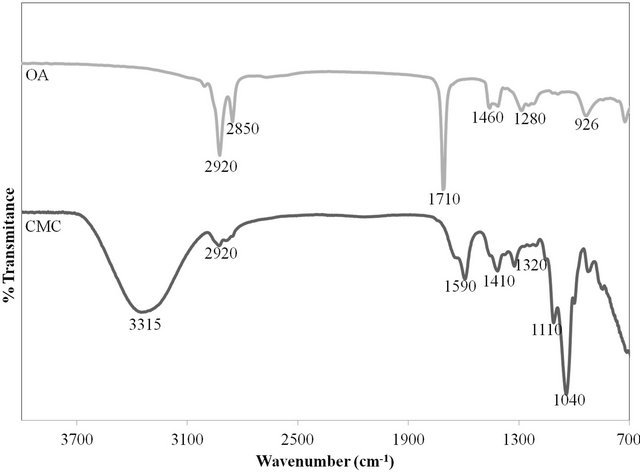
Figure 1. FTIR spectra of CMC and OA.
the C-O stretching on polysaccharide skeleton [8]. The sharp band at 2920 cm−1 and 2850 cm−1 can be assigned to C-H stretching in asymmetric and symmetric, respectively of OA [9]. The intense peak at 1710 cm−1 was derived from the existence of the C=O stretch and the band at 1280 cm−1 exhibited the presence of the C-O stretch. According to [9], the O-H in-plane and out-of-plane bands appeared at 1460 cm−1 and 926 cm−1, respectively.
Upon addition of OA, the intensity of the peak of H+ (2850 cm−1 and 2920 cm−1) increase gradually until 20 wt% indicating that the deprotonation of the OA increases. Further addition of ionic dopant caused the peak intensity of dopant increased. This is accommodating to the values of the conductivity obtained for the samples [10]. The new peaks are observed by the addition of OA as shown in Figure 2. The peak at 1710 cm−1 belongs to C=O stretching of OA. The sharp band around 2920 cm−1 and 2850 cm−1 were assigned to C-H stretching in asymmetric and symmetric, respectively. The band at 1597 cm−1 confirmed the presence of COO− was assigned to stretching of the carboxyl group. The IR spectrum of CMC showed the band at 1040 cm−1 was characteristic of the C-O stretching on polysaccharide skeleton. The intensity of the peak is less obvious with the addition of OA as shown in Figure 2. According to [11], OA molecules (being relatively small in size compared with polymer molecules) penetrate into the CMC matrix and establish attractive forces between OA molecules and chain segments. These attractive forces reduce the cohe-
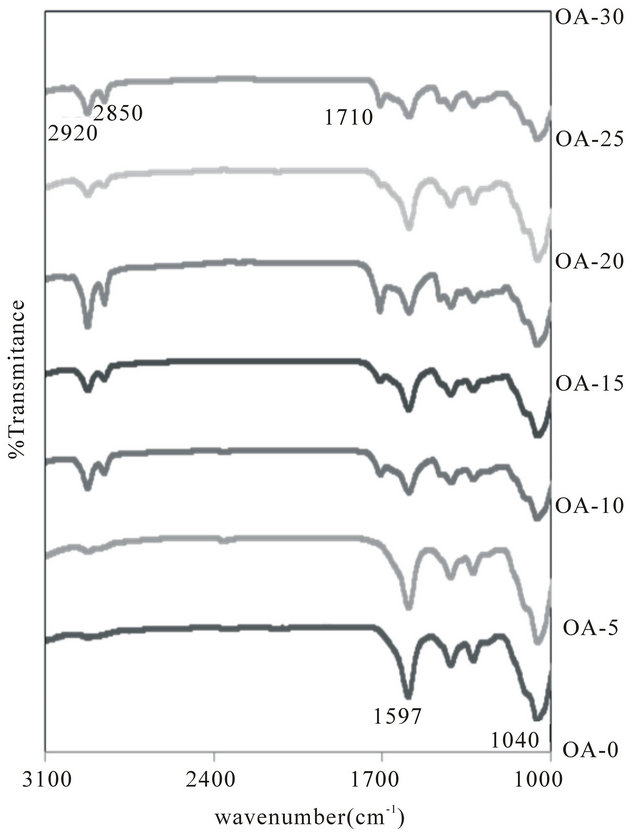
Figure 2. FTIR spectrum of the sample in the region between 1600 and 3100 cm−1.
sive forces between the polymer chains and increase the segmental mobility, thus enhancing electrical conductivity. Based on Figure 2, it can be shown that peak intensity of H+ (2850 cm−1 and 2920 cm−1) of OA is increases whereas the peak of COO− (1597 cm−1) of CMC was less obvious with the addition of OA. It is suggested that protonation due to H+ occurred in the present samples and the interactions between CMC and OA existed.
3.2. XRD Study
The X-ray diffraction patterns of pure CMC and samples OA-0 until OA-30 at room temperature from 2θ = 5˚ to 80˚ were shown in Figure 3. Thus, the XRD analysis revealed the complex formation in the polymer matrices and shows that the sample is amorphous. Besides, it can be clearly seen that OA-20 had the highest intensity at the peak of 21˚ due to H+ occurred in the present samples and accommodated to the values of the conductivity obtained.
3.3. Conductivity Study
Figure 4 shows the conductivity plot of the CMC based biopolymer electrolytes and it appears to go through a maximum value at 20 wt% of ionic dopant (OA) and dramatically decreases at higher dopant concentrations. The increase in electrical conductivity by increasing the dopant concentration implies that the ionic mobility was proportionally increases. The presence of mobile ions also increased the amorphous structure of the polymer and therefore ion migration easily can takes place [12]. When more than 20 wt% of OA concentration has been added, the value of electrical conductivity drastically dropped. This phenomenon exists due to the occurrence of non-conducting ion-pair [13]. It can also be explained that the mobility of ions depend on the concentration and the nature of organic salt in which interactions with the polymeric chain occur. As such, the result above agrees
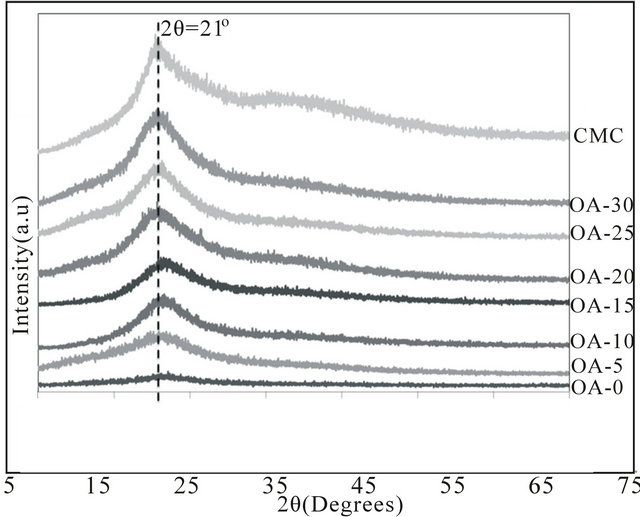
Figure 3. XRD pattern for different samples of CMC-OA and CMC.
with the XRD and FTIR studies where the complexation is seen to occur between the dopant and the polymer. Due to the complexation, the conductivity of the polymer electrolytes was enhanced.
The temperature-dependent of ionic conductivity measurements were used to analyze the mechanism of ionic conduction of polymer electrolytes [14]. Figure 5 depicts the plot of log conductivity, σ versus 1000/T for samples OA-0 to OA-30 from 303 K to 393 K. From Figure 5, the relationship between conductivity and temperature of the biopolymer electrolytes are characteristically Arrhenius behavior with the regression values, R2, is almost unity and the conductivity is thermally assisted [12].
4. Conclusion
Biopolymer electrolytes based on CMC doped with OA has been successfully prepared by solution casting technique. The CMC-OA biopolymer electrolyte obtained the highest conductivity of 2.11 × 10⁻⁵ S·cm−1 at room temperature for sample OA-20 with OA concentration of
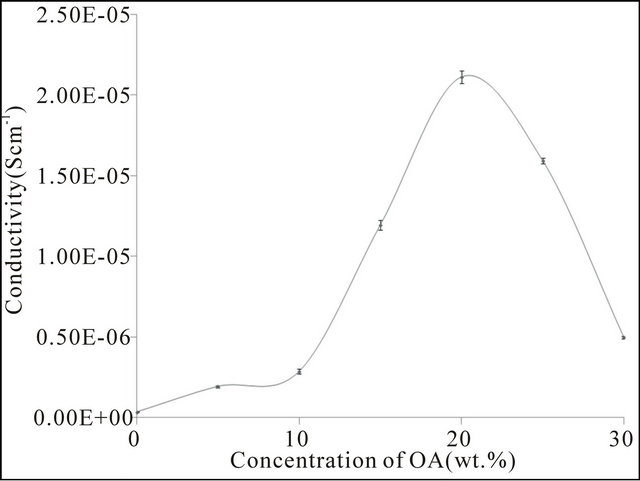
Figure 4. Room temperature ionic conductivity of CMCOA.
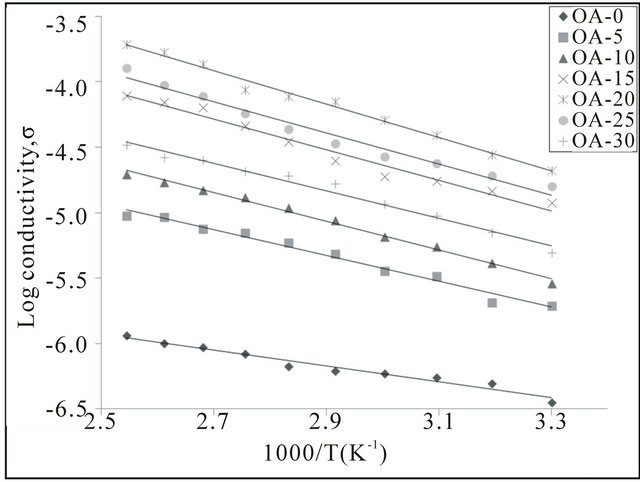
Figure 5. Temperature dependence for conductivity of CMCOA electrolyte.
20 wt%. The conductivity of the CMC-OA biopolymer electrolyte was further confirmed by the Arrhenius plot with regression values, R2, in the range of 0.97 to 0.99, showing that the samples obey Arrhenius behaviour. FTIR studies was carried out to determine the dissociation of free protons (H+) from the carboxyl group (-COOH) of OA. XRD had shown that the samples were in amorphous state and can be clearly seen that OA-20 had the highest intensity at the peak of 21˚ due to complexation of the sample.
5. Acknowledgements
The authors would like to thank MOHE for My Master Scholarship, Department of Physical Sciences under the Faculty of Science and Technology, University Malaysia Terengganu for the helps and supports given for this work.
REFERENCES
- M. Stephan and K. S. Nahm, “Review on Composite Polymer Electrolytes for Lithium Batteries,” Polymer, Vol. 47, No. 16, 2006, pp. 5952-5964. doi:10.1016/j.polymer.2006.05.069
- P. Fonseca, D. S. Rosa, F. Gaboardi and S. Neves, “Development of a Biodegradable Polymer Electrolyte for Rechargeable Batteries,” Journal of Power Sources, Vol. 155, No. 2, 2006, pp. 381-384. doi:10.1016/j.jpowsour.2005.05.004
- K. Siddhanta, K. Prasad, R. Meena, G. Prasad, G. K. Mehta, M. U. Chhatbar, et al., “Profiling of Cellulose Content in Indian Seaweed Species,” Bioresource Technology, Vol. 100, No. 24, 2009, pp. 6669-6673. doi:10.1016/j.biortech.2009.07.047
- S. A. Khiar, R. Puteh and A. K. Arof, “Conductivity Studies of a Chitosan-Based Polymer Electrolyte,” Physica B, Vol. 373, No. 1, 2006, pp. 23-27. doi:10.1016/j.physb.2005.10.104
- N. E. A. Shuhaimi, L. P. Teo, S. R. Majid and A. K. Arof, “Transport Studies of NH4NO3 Doped Methyl Cellulose Electrolyte,” Synthetic Metals, Vol. 160, No. 9-10, 2010, pp. 1040-1044. doi:10.1016/j.synthmet.2010.02.023
- W. Zaidi, Y. Oumellal, J. P. Bonnet, J. Zhang, F. Cuevas, M. Latroche, et al., “Carboxy Methylcellulose and Carboxy Methylcellulose-Formate as Binders in MgH2-Carbon Composites Negative Electrode for Lithium-Ion Batteries,” Journal of Power Sources, Vol. 196, No. 5, 2011, pp. 2854-2857. doi:10.1016/j.jpowsour.2010.11.048
- J. F. Su, Z. Huang, X. Y. Yuan, X. Y. Wang and M. Li, “Structure and Properties of Carboxymethyl Cellulose/ Soy Protein Isolate Blend Edible Films Crosslinked by Maillard Reactions,” Carbohydrate Polymers, Vol. 79, No. 1, 2010, pp. 145-153. doi:10.1016/j.carbpol.2009.07.035
- M. F. Abou Taleb, H. L. Abd El-Mohdy and H. A. Abd El-Rehim, “Radiation Preparation of PVA/CMC Copolymers and Their Application in Removal of Dyes,” Journal of Harzadous Materials, Vol. 168, No. 1, 2009, pp. 68-75.
- S. Kong, P. Zhang, X. Wen, P. Pi, J. Cheng, Z. Yang, et al., “Influence of Surface Modification of SrFe12O19 Particles with Oleic Acid on Magnetic Microsphere Preparation,” Particuology, Vol. 6, No. 3, 2008, pp. 185-190. doi:10.1016/j.partic.2008.03.004
- S. R. Majid and A. K. Arof, “Proton-Conducting Polymer Electrolyte Films Based on Chitosan Acetate Complexed with NH4NO3 Salt,” Physica B, Vol. 355, No. 1-4, 2005, pp. 78-82. doi:10.1016/j.physb.2004.10.025
- M. Z. A. Yahya and A. K. Arof, “Effect of Oleic Acid Plasticizer on Chitosan-Lithium Acetate Solid Polymer Electrolytes,” European Polymer Journal, Vol. 39, No. 5, 2003, pp. 897-902. doi:10.1016/S0014-3057(02)00355-5
- M. M. Ali, M. Z. A. Yahya, M. Mustaffa, A. H. Ahmad, R. H. Y. Subban, M. K. Harun, et al., “Electrical Properties of Plasticized Chitosan-Lithium Imide with Oleic Acid Based Polymer Electrolytes for Lithium Rechargeable Batteries,” Ionics, Vol. 11, No. 5-6, 2005, pp. 460- 463. doi:10.1007/BF02430267
- S. Ramesh and K. C. Wong, “Conductivity, Dielectric Behaviour and Thermal Stability Studies of Lithium Ion Dissociation in Poly(Methyl Methacrylate)-Based Gel Polymer Electrolytes,” Ionics, Vol. 15, No. 2, 2009, pp. 249-254. doi:10.1007/s11581-008-0268-2
- M. N. Chai and M. I. N. Isa, “Carboxyl Methylcellulose Solid Polymer Electrolytes: Ionic Conductivity and Dielectric Study,” Journal of Current Engineering Research, Vol. 1, No. 1, 2011, pp. 23-27.
NOTES
*Corresponding author.